Strongly Interacting Bose Gases near a
-wave Shape Resonance
Xing-Can Yao*,1, 2, 3 Ran Qi*,4 Xiang-Pei Liu,1, 2, 3Xiao-Qiong Wang,1, 2, 3Yu-Xuan Wang,1, 2, 3Yu-Ping Wu,1, 2, 3 Hao-Ze Chen,1, 2, 3 Peng Zhang,4, 5 Hui Zhai,6, 7 Yu-Ao Chen,1, 2, 3 and Jian-Wei Pan1, 2, 3
1
Shanghai Branch, National Laboratory for Physical Sciences at Microscale and Department of Modern Physics, University of Science and Technology of China, Shanghai, 201315, China
2
CAS Center for Excellence and Synergetic Innovation Center in Quantum Information and Quantum Physics, University of Science and Technology of China, Hefei, Anhui 230026, China
3
CAS-Alibaba Quantum Computing Laboratory, Shanghai, 201315, China
4
Department of Physics, Renmin University of China, Beijing, 100872, China
5
Beijing Key Laboratory of Opto-electronic Functional Materials & Micro-nano Devices, 100872 (Renmin Univeristy of China)
6
Institute for Advanced Study, Tsinghua University, Beijing, 100084, China
7Collaborative Innovation Center of Quantum Matter, Beijing, 100084, China
Many unconventional quantum matters, such as fractional quantum Hall effect andd-wave high-Tc superconductor, are discovered in strongly interacting systems. Understanding quantum many-body systems with strong interaction and the unconventional phases therein is one of the most challenging problems in physics nowadays. Cold atom systems possess a natural way to create strong interaction by bringing the system to the vicinity of a scattering resonance. Although this has been a focused topic in cold atom physics for more than a decade, these studies have so far mostly been limited for
s-wave resonance. Here we report the experimental observation of a broadd-wave shape resonance in degenerate 41
K gas. We further measure the molecular binding energy that splits into three branches as a hallmark ofd-wave molecules, and find that the lifetime of this many-body system is reasonably long at strongly interacting regime. From analyzing the breathing mode excited by ramping through this resonance, it suggests that a quite stable low-temperature atom and molecule mixture is produced. Putting all the evidence together, our system offers great promise to reach a
d-wave molecular superfluid.
In the last century, conventional quantum matters have been well understood by Landau’s Fermi liquid theory, concept of symmetry breaking, as well as the perturba-tion theory [1]. Nowadays it is of great interest to find new quantum matters beyond the conventional paradigm, which can also have potential application to the next gen-eration of quantum technology. Usually in such systems the interaction between particles is so strong that pertur-bation theory fails, and the system flows to a phase that is intrinsically different from a non-interacting or weakly interacting system. Ultracold atomic gases provide ideal physical systems to search for such phases, because the interaction between atoms can be precisely controlled and tuned to be very strong by bringing the system to the vicinity of a scattering resonance, for example, by the technique of magnetic Feshbach resonance [2, 3].
Indeed, in the past decades, many studies have been focused on strongly interacting atomic Bose and Fermi gases near ans-wave resonance, where interesting physics such as emergent scale invariance and perfect fluidity have been observed [4–18]. On the other hand, studies so far are mostly limited tos-wave resonances. Only recently few works have experimentally studied many-body prop-erties of interacting fermions near ap-wave resonance [19]. Strongly interacting atomic gases have so far not been studied for ad-wave resonance and not for bosons with any high partial wave resonances. The challenge is due to the short lifetime and the narrow resonance width for higher partial waves resonances. In fact, all d-wave resonances reported before are quite narrow [20, 21].
A scattering resonance can also be distinguished into a Feshbach resonance and a shape resonance, based on the origin of the bound state [2]. For a Feshbach resonance, the bound state comes from a different channel, such as atoms in different hyperfine spin states, and it is tuned to the scattering threshold by magnetic field due to the difference in magnetic moment between this bound state and scattering states. While for a shape resonance, the bound state is supported by the attractive potential of the same channel as the scattering atoms, which in this case is the van de Waals potential between two atoms.
Magnetic field sensitivity of the bound state in a Fes-hbach resonance is a double-edged sword. On the one hand, most scattering resonances in cold atom system are Feshbach resonances because of its magnetic field tun-ability; on the other hand, once the coupling channels are weak such as in a high partial wave resonance, the resonance becomes quite narrow in terms of magnetic field, and consequently it becomes hard to investigate experimentally. In contrast, the shape resonance only occurs incidentally, but once it happens, the bound state is much less sensitive to the magnetic field and therefore it appears quite broad in magnetic field even for high partial wave resonance. Therefore, the advantage for a high partial wave shape resonance is that a thorough investigation of strongly interacting quantum gas there becomes much more experimentally accessible.
Here we first report that ad-wave resonance is identi-fied in41K gas through atom loss. Very recently a similar
d-wave Feshbach resonance has also been observed in
85
Rb-87
Rb mixture through atom loss as well[22]. In this work we present a systematic study of strongly interact-ing bosons near thisd-wave resonance. We use magnetic field modulation spectroscopy to measure the molecular binding energy, and the results agree very well with multi-channel quantum defect theory (MQDT) [23–25]. A few pieces of evidence are presented to show that thisd-wave resonance is indeed a shape resonance. The lifetime of this strongly interacting bosons near thed-wave resonance is measured and found to be several tens of milliseconds, which is reasonably long. Many-body interaction effect has also been observed by ramping this Bose condensate through the resonance, during which a collective oscilla-tion is excited. This is attributed to the change of the internal energy due to atom-molecule conversion, and a simple model is proposed to estimate the molecule fraction produced through the ramping.
Observation of d-wave Resonance. The experi-mental setup for preparing ultracold 41
K gas has been described in our previous works [26–28]. Up to 7×10⁵ 41K atoms in the |F = 1, mF = 1ihyperfine state can be
cooled to form a pure condensate at magnetic field304.5G. The41K Bose-Einstein condensate (BEC) is confined in a
disk-like trap with radial and axial trapping frequencies being ωr= 20.8Hz and ωa = 84 Hz, respectively. The Thomas-Fermi radii are about28.8µm radially and 8µm axially.
To detect the scattering resonance, inelastic loss mea-surement is performed where enhanced atom losses occur at resonance due to a larger three-body decay rate. First, the magnetic field is rapidly ramped to8G in10ms and followed by a100ms equilibrium time. Then, the mag-netic field is ramped to the targeted value, and held there for a waiting time. Finally, to reduce the uncertainty in measuring atom number, we switch off the optical trap and ramp the magnetic field back to304.5G simultane-ously. After20ms time-of-flight (TOF), strong saturation absorption imaging [29] is performed to determine the remaining final number Nf. The accuracy of the mag-netic field is calibrated by radio-frequency spectroscopy between the two lowest hyperfine states of41K and it is
found to be better than10mG.
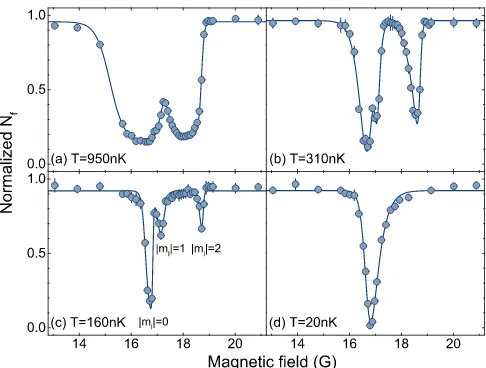
In Fig. 1 we show the remaining final numberNf nor-malized by the initial atom number versus magnetic field for four different temperatures of950nK,310nK,160nK, and 20 nK, which respectively correspond to tempera-tures quite above BEC temperature (Tc), slightly below Tc,0.85Tcand well belowTc(i.e. a nearly pure BEC with no visible thermal fraction). In Fig. 1(a), the loss curve shows two peaks and they display an asymmetric shape. This is one feature of the high partial wave resonance. As lowering the temperature belowTc, the thermal broad-ening becomes narrower, and one of the peak can now be resolved as two peaks, as shown in Fig. 1(b) and (c). This is a hallmark of a d-wave resonance which can split intom= 0, m=±1andm=±2resonances due to the
FIG. 1. Inelastic loss spectroscopy of41
K atoms in the vicinity of d-wave shape resonance. (a)-(d) show the normalized re-maining final numberNfversus magnetic field at temperatures 950nK (a),310nK (b),160nK (c) and20nK (d), respectively. Data points are counted and statistically averaged over four measurements with standard error margin being calculated (applicable to all figures in the following). The blue solid guid-ing lines in (a)-(d) are fits to the data points usguid-ing asymmetric double Sigmoidal function.
magnetic dipolar interactions. It is easy to show that due to the dipolar energy splitting, the ratio of the distance betweenm=±1andm= 0resonances to the distance betweenm=±2andm= 0resonances is 4 : 1, which is approximately consistent with the experimental data shown in Fig. 1(b) and (c).
More intriguingly, as further lowering the temperature toward a pure BEC, two of the peaks associated with m=±1andm=±2disappear. This is because when the kinetic energy of atoms is too small to penetrate through thed-wave centrifugal barrier, the atomic loss induced by d-wave scattering is negligible. Nevertheless, because the dipolar interaction can couple thes-wave scattering state to a d-wave bound state, but only to the bound state withm= 0 due to the rotational symmetry alongz, theˆ
resonance withm= 0can still lead to significant atom loss in very low temperature.
Measurement of Molecular Binding Energy.
Now we aim at a more direct detection of the molecules by applying a field modulation spectroscopy [30, 31]. Af-ter producing the condensate at304.5 G, we ramp the magnetic field to15 G in 10 ms and hold at that field for an additional100ms. Next, we ramp the magnetic field to a value near the resonance and then apply a small sinusoidal oscillation with frequencyfmodfor a duration between200ms to 2s. To avoid amplitude dependent broadening and shifting effects, the modulation amplitude is chosen to be50mG. For example, at magnetic field of
yield-16 17 18 19 20 21 22
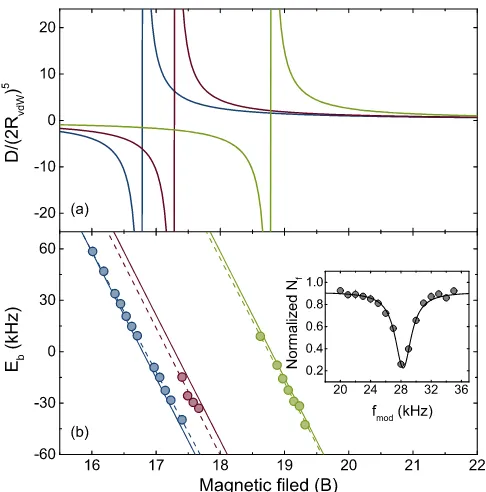
FIG. 2. Molecular binding energy of d-wave shape resonance. (a) The d-wave hyper-volume D normalized by(2RvdW)
5
cal-culated by MQDT as a function of magnetic field, where
RvdW= 65.42a0is the van de Waals length of 41
K atoms. (b) The measurement results (dots) and theoretical results from MQDT calculations (solid lines) of molecular binding energy as a function of magnetic field form= 0(blue),m=±1(red)
andm = ±2(green) resonances, respectively. The dashed
lines are the linear fittings of the experimental data. Eb<0 represents the bound state, whileEb>0corresponds to the quasi-bound state. The inset shows a typical resonant associa-tion loss spectrum fitted with a Lorentz funcassocia-tion.
ing a resonant frequency of28.30(3)kHz and spectrum width of 2.58(8)kHz, as shown in the inset of Fig. 2.
Using this method, we can associate atoms not only into bound molecules but also into quasi-bound molecules. The binding energiesEb are then extracted and plotted as a function of magnetic field, as shown in Fig. 2. For m = 0 resonance, a linear dependence of the binding energy on the magnetic-field is clearly observed with a slope ofB0= 70.36(58)kHz/G. The resonance position
of m = 0 is thus determined to be16.833(3) G, which is in excellent coincidence with the peak loss position of
16.828(4)G obtained through inelastic loss spectrum of a
pure BEC in Fig. 1(d). The binding energy of molecular state associated with m = ±1 is difficult to measure, mainly due to the small splitting betweenm= 0andm=
±1resonances. Therefore, we increase the modulation time to5 s and only observe association loss spectrum in the bound molecules side. The resonance position for m=±1is measured to be B±1 = 17.19(6)G, and the
fitted slope is74(12)kHz/G. The large error bars on these results are due to small data set of our measurement. For m = ±2 resonance, the obtained resonance position is
B±2= 18.75(1) G and slope is72(2)kHz/G, respectively.
To compare experimental measurement with theory, we employ the MQDT calculation. We first exclude the dipolar interaction, and if we take the singlet and triplet scattering lengths aS = 85.53a0 and aT = 60.54a0 re-ported in previous literatures (a0is the Bohr radius) [32], the MQDT predicts that thed-wave resonance locates atB = 65.1G. Here we fine tune the parameter aT to match the resonance position at(B0+B±2)/2, and we
findaT= 58.89a0. Using this new parameter ofaT, we then turn on dipolar interaction and compare the full results from MQDT with all experimental data sets. We can calculate both thed-wave super-volumeD and the bound state energy. Thes-wave super-volumeD charac-terizes thed-wave scattering amplitude and a divergent Dlocates thed-wave resonance. The results are shown in Fig. 2, and we can see that the bound state energies predicted by MQDT agree well with the experiments.
Evidence of Shape Resonance. Here we report a few pieces of strong evidence because of which we are sure that the resonances observed here is actually a shape resonance.
(I) It is known that for a pure van de Waals potential at large distanceV(r) =−16R4
vdW/r
6 (m=~= 1), a
d-wave shape resonance occurs when thes-wave scattering length satisfies the condition [2, 24]
as= 0.956RvdW. (1)
This condition is obtained by matching the solution of a van de Waals potential to the short range physics, the later of which is captured by thes-wave scattering length as. For two 41K atoms in their lowest hyperfine spin state|F= 1, mF = 1i, using the input parametersaS=
85.53a0andaT= 58.89a0, our MQDT showsas= 62.30a0 at zero field. Knowing thatRvdW= 65.42a0 for41K, one has
as= 0.952RvdW. (2)
The already very small difference between Eq. 2 and Eq. 1 tells that ad-wave bound state supported by this van der Waals potential is quite close to the scattering threshold. It is therefore conceivable that when the multi-channel coupling at short distance varies a little bit as tuning the magnetic field, it can cause a slow varying ofasand bring the system to the onset of a shape resonance.
0.0 0.5 1.0
0.0 0.5 1.0
0 500 1000 1500 2000 0.0
0.5 1.0
(c) (b)
No
r
m
a
lize
d
N
f
(a)
Time (ms)
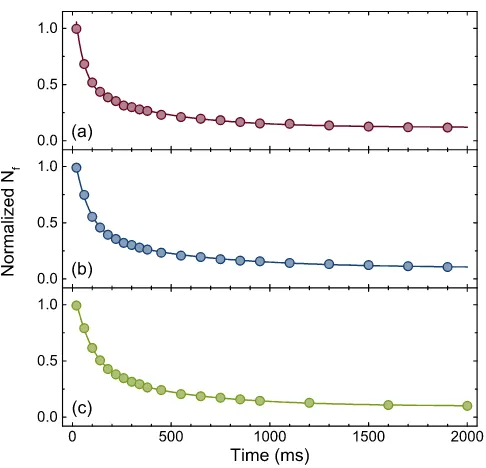
FIG. 3. Lifetime of 41
K atoms in the vicinity of shape resonance. The final number normalized by the initial number is plotted as a function of holding time. The measurements are performed at magnetic field of16.751G (a),16.708G (b), and16.621 G (c), respectively. Solid curves correspond to fitting with a sum of two exponential functions.
Thus, the bound state must sit at the lower field and the quasi-bound state must be at the higher field, which is in contrast to what we see here.
(III) From the MQDT calculation, one can also obtain theζres parameter defined in [25], where|ζres| ≫1means the resonance is dominated by single channel. In our case, we findζres=−201(ζresis always negative for all ℓ > 0 according to [25]). Our MQDT calculation also determines that the Bohr magneton for the bound state is1.832MHz/G, very close to that of two atoms in the scattering state (1.756 MHz/G). Both shown that the bound state is dominated only by the scattering channel. In addition, close to a resonance (i.e., the one withm= 0), we can cast Das a function of B into the form
D=Dbg
1 + ∆
B−B0
, (3)
whereDbg is the background super-volume. Here we can formally define a resonance width∆and it is found that∆
is as large as180.3 G. Although (III) can not distinguish a shape resonance from a broad Feshbach resonance, but as said, because a high partial wave Feshbach resonance is generically narrow due to the weak inter-channel coupling resulting from the centrifugal barrier, this can be taken as another evidence of shape resonance.
Measurement of Lifetime. Lifetime is very crucial for experimental study of this new strongly interacting quantum system. To measure the lifetime in the vicinity of this shape resonance, the cloud is cooled to about300nK
0 25 50 75 100 125 150 175 54.6
63.7 72.8 81.9 51.6 60.2 68.8 77.4
R
a
d
i
a
l
w
i
d
t
h
(
m
)
Time (ms)
FIG. 4. Collective oscillations of the radial width of the BEC after magnetic field ramping across the shape resonance. Blue (top) and red (bottom) circles correspond to the upward and downward magnetic field ramping across the resonance, respectively. Solid lines are the fitting curves based on a sinusoid model.
slightly belowTc, then we set the magnetic field to the quasi-bound side of resonance and measure the remaining final numberNfas a function of holding time. We note that in the absorption detection, since the binding energy is negligible small, both atoms and possible molecules are counted inNf.
Nf versus holding time are plotted in Fig. 3 for three different magnetic field values, where the binding ener-gies of quasi-bound molecule roughly correspond tokbTc,
1.5kbTc and 2.5kbTc, respectively. We find the curves in Fig. 3 can be well fitted with a sum of two expo-nential functions asα1e−t/τ1+α2e−t/τ2, and the fitting
results are(τ1, τ2) = (44(2),401(14))ms for Fig. 3(a), and
= (73(2),546(26))ms for (b) and = (84(3),464(24))ms
for (c). This lifetime is reasonably long, in particular, for the case of Fig. 3(a) sufficiently close to resonance. This provides an excellent opportunity to study many interesting strongly interacting physics in this system.
at the final magnetic field for a variable time. Finally, the optical trap is switched off and the cloud is probed at
304.5G after20ms TOF using the same imaging method described above. A striking feature is that a coherent oscillation of cloud radius are found in both cases, as shown in Fig. 4. Both curves can be nicely approximated by a single frequency harmonic oscillations with small damping rates. The fitted oscillation frequenciesωc are
40.56(10)Hz and40.48(10)Hz for upward ramping and
downward ramping, respectively. This givesωc= 1.95ωr, whereωris the radial trapping frequency introduced ear-lier. In our case, the trapping aspect radioλ=ωa/ωr≈4, the breathing mode frequency is approximately 1.81ωr [33, 34]. Thus we think this mode is consistent with a breathing mode.
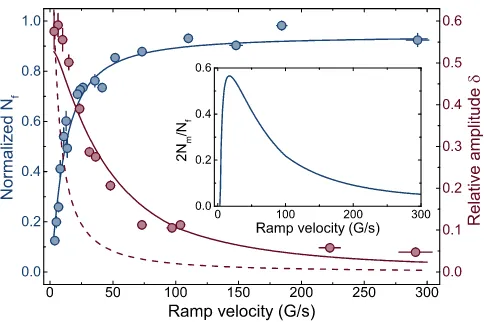
A natural scenario attributes the excitation of the col-lective oscillation after ramping to the change of internal energy due to the atom-molecule conversion. To inves-tigate this effect more clearly, we further take the case of downward ramping from17.404G to 16.621G, and vary the ramping velocity from3 G/s to 300G/s. For each ramping velocity, the remaining final numberNfis measured immediately at the end of ramp and the BEC fraction is found to be larger than 90%. Fig. 5 shows both normalizedNfand oscillation amplitudeδas a func-tion of the ramping velocity. We find that normalizedNf increases and the oscillation amplitude decreases as the ramping velocity increases.
In general, the remaining final numberNfshould con-tain both atoms in the scattering state (with their total number denoted by Na) and molecules in the bound state (with their total number denoted by Nm), and Nf = Na + 2Nm. If we assume that Nf are all con-tributed by atoms in the scattering state, i.e. Nf=Na, we can determine the radial Thomas-Fermi radius of the final cloud as Rf = (15asa4hoNa)1/5 = (15asa4hoNf)1/5, whereaho=λ1/4
p
~/mωr. On the other hand, the initial
Thomas-Fermi radius can be calculated from the total initial atom number Ni as Ri = (15asa4hoNi)1/5. Since the breathing mode is excited because the initial cloud of radiusRi is suddenly brought to a situation with new equilibrium radiusRf, the relative oscillation amplitude δ, defined as the peak to the valley distance divided by the average, is naturally estimated by
δ
If we takeNa =Nf for different ramping velocities, we determine δ as a function of v shown by the dashed line in Fig. 5. It is very clear that it systematically underestimates the oscillation amplitude. In other words, we overestimate the final Thomas-Fermi radius.
This in fact strongly suggests the final cloud is a mixture of atoms and molecules. The actual final cloud size should be smaller because part of Nf is actually contributed
0 50 100 150 200 250 300
FIG. 5. The normalized remaining final number Nf (blue circles) and the relative oscillation amplitudeδ(red circles) as a function of ramping velocityv. Blue and red solid lines are the fitting curves ofNf andδrespectively. The dashed line shows the estimatedδassuming that the final cloud is purely made of atoms (see text for details). The discrepancy between the dashed line and the experimental data strongly supports the final cloud is a mixture of atoms and molecules. The inset shows the molecule fraction2Nm/Nfas a function of ramping
velocityvextracted from a simple theoretical model.
by the bound molecules. Here we need to make the following two bold assumptions of this atom-molecule mixture: (i) The molecules always reside in the atom cloud so that final Thomas-Fermi radius after ramping Rf is still determined by the atoms. (ii) The effect of
atom-molecule interaction on the Thomas-Fermi radius is insignificant and can be ignored. Thus, we assume that the relationRf= (15asa4hoNa)1/5 still hold. Now we take a best fit of experimental data for oscillation amplitude versus ramping velocity to determine a function δ(v), as shown by the solid line in Fig. 5. Therefore, with this function and the experimental data ofNi, we can determineNa with Eq. 4, and the molecule number is then extracted asNm= (Nf−Na)/2.
The molecule fraction in the final cloud 2Nm/Nf is plotted in the inset of Fig. 5. One can see that this molecule fraction is small for both small or large ramping velocity. This result is quite reasonable because at small ramping velocity, the molecules have enough time to decay into a deep bound state through three-body loss and to escape the trap; and for fast ramping velocity there is not enough time for atoms to penetrate through the centrifugal barrier and to covert into molecules. As a result, the molecule fraction reaches a maximum at some intermediate ramping velocity. Therefore, our analysis suggests that a ramping with moderate velocity produces a mixture of atoms and molecules, which should be in a condensate phase for the temperature as low as our system.
studied the strongly interacting many-body system of bosons near that. First of all, we find from both atom loss and molecular binding energy measurements that the resonances split into three branches, which is the hallmark ford-wave molecules. Secondly, we find the life-time is sufficiently long in the strongly interacting regime. Thirdly, by ramping through the resonance, we observe the many-body interaction effect, which also provides strong evidence that the system becomes a mixture of both atoms and molecules after ramping. In addition, the nearly undamped breathing mode oscillation strongly suggests the system remains at a low-temperature con-densate phase. All the evidence point to that a d-wave molecular superfluid can exist in our system. Studying d-wave superfluid can shed light on similar systems such as d-wave superconductor found in many high-Tc and strongly correlated materials.
We thank Cheng Chin and Bo Gao for very help-ful discussions. This work has been supported by the NSFC of China, the CAS, and the National Fundamental Research Program (under Grant Nos. 2013CB922001, 2016YFA0301600, 2016YFA0301600).
[1] L. D. Landau and E. M. Lifshitz, Course of theoretical physics, Vol. 9., Statistical physics, part 2(1980). [2] C. Chin, R. Grimm, P. Julienne, and E. Tiesinga, Rev.
Mod. Phys.82, 1225 (2010).
[3] I. Bloch, J. Dalibard, and W. Zwerger, Rev. Mod. Phys.
80, 885 (2008).
[4] J. Kinast, A. Turlapov, J. E. Thomas, Q. Chen, J. Stajic, and K. Levin, Science 307, 1296 (2005).
[5] S. Nascimbe`ne, N. Navon, K. J. Jiang, F. Chevy, and C. Salomon, Nature463, 1057 (2010).
[6] M. Horikoshi, S. Nakajima, M. Ueda, and T. Mukaiyama, Science327, 442 (2010).
[7] N. Navon, S. Nascimbe`ne, F. Chevy, and C. Salomon, Science328, 729 (2010).
[8] M. J. H. Ku, A. T. Sommer, L. W. Cheuk, and M. W. Zwierlein, Science335, 563 (2012).
[9] L. A. Sidorenkov, M. K. Tey, R. Grimm, Y.-H. Hou, L. Pitaevskii, and S. Stringari, Nature498, 78 (2013).
[10] C. Cao, E. Elliott, J. Joseph, H. Wu, J. Petricka, T. Schaefer, and J. E. Thomas, Science58, 33101 (2011).
[11] A. Sommer, M. Ku, G. Roati, and M. W. Zwierlein,
Nature472, 201 (2011).
[12] D. Stadler, S. Krinner1, J. Meineke, J.-P. Brantut, and T. Esslinger, Nature 491, 736 (2012).
[13] J.-P. Brantut, C. Grenier, J. Meineke, D. Stadler, S. Krin-ner, C. Kollath, T. Esslinger, and A. Georges, Science
342, 713 (2013).
[14] M. Koschorreck, D. Pertot, E. Vogt, and M. K¨hl, Nat. Phys.9, 405 (2013).
[15] A. B. Bardon, S. Beattie, C. Luciuk, W. Cairncross, D. Fine, N. S. Cheng, G. J. A. Edge, E. Taylor, S. Zhang, S. Trotzky, and J. H. Thywissen, Science344, 722 (2014).
[16] E. Elliott, J. Joseph, and J. E. Thomas, Phys. Rev. Lett.
112, 040405 (2014).
[17] S. Deng, Z.-Y. Shi, P. Diao, Q. Yu, H. Zhai, R. Qi, H. Wu, Science353, 371 (2016).
[18] K. M. O’Hara, S. L. Hemmer, M. E. Gehm, S. R. Granade, and J. E. Thomas, Science298, 2179 (2002).
[19] C. Luciuk, S. Trotzky, S. Smale, Z. Yu, S. Zhang, J. H. Thywissen, Nat. Phys.12, 599 (2016).
[20] T. Volz, S. Durr, N. Syassen, G. Rempe, E. Kempen, and¨
S. Kokkelmans, Phys. Rev. A72, 010704 (2005).
[21] J. P. Covey, S. A. Moses, M. Gärttner, A. Safavi-Naini, M. T. Miecnikowski, Z. Fu, J. Schachenmayer, P. S. Julienne, A. M. Rey, D. S. Jin and J. Ye, Nat. Commun. 7, 11279
(2016)
[22] Y. Cui, C. Shen, M. Deng, S. Dong, C. Chen, R. L¨u, B. Gao, M. K. Tey, and L. You, arXiv:1709.08794 (2017). [23] B. Gao, E. Tiesinga, C. J. Williams, and P. S. Julienne,
Phys. Rev. A72, 042719 (2005).
[24] B. Gao, Phys. Rev. A80, 012702 (2009).
[25] B. Gao, Phys. Rev. A84, 022706 (2011).
[26] X.-C. Yao, H.-Z. Chen, Y.-P. Wu, X.-P. Liu, X.-Q. Wang, X. Jiang, Y. Deng, Y.-A. Chen, and J.-W. Pan, Phys. Rev. Lett.117, 145301 (2016).
[27] Y.-P. Wu, X.-C. Yao, H.-Z. Chen, X.-P. Liu, X.-Q. Wang, Y.-A. Chen, and J.-W. Pan, J. Phys. B50, 094001 (2017).
[28] H.-Z. Chen, X.-C. Yao, Y.-P. Wu, X.-P. Liu, X.-Q. Wang, Y.-X. Wang, Y.-A. Chen, and J.-W. Pan, Phys. Rev. A
94, 033408 (2016).
[29] G. Reinaudi, T. Lahaye, Z. Wang, and D. Guéry-Odelin, Opt. Lett.32, 3143 (2007).
[30] S. T. Thompson, E. Hodby, and C. E. Wieman, Phys. Rev. Lett.95, 190404 (2005).
[31] J. P. Gaebler, J. T. Stewart, J. L. Bohn, and D. S. Jin, Phys. Rev. Lett.98, 200403 (2007)).
[32] S. Falke, H. Kn¨ockel, J. Friebe, M. Riedmann, E. Tiemann, and C. Lisdat, Phys. Rev. A78, 012503 (2008).
[33] S. Stringari, Phys. Rev. Lett.77, 2360 (1996).