forests
ISSN 1999-4907 www.mdpi.com/journal/forests Article
Impacts of Frequent Burning on Live Tree Carbon Biomass and
Demography in Post-Harvest Regrowth Forest
Luke Collins 1,†,*, Trent Penman 1, Fabiano de Aquino Ximenes 2, Doug Binns 3, Alan York 4 and Ross Bradstock 1
1
Centre for Environmental Risk Management of Bushfire, Institute for Conservation Biology and Environmental Management, University of Wollongong, Wollongong, NSW 2522, Australia; E-Mails: [email protected] (T.P.); [email protected] (R.B.)
2
NSW Department of Primary Industries, Level 2, 470 Church St, North Parramatta, NSW 2151, Australia; E-Mail: [email protected]
3
Forestry Corporation of NSW, P.O. Box 4019, Coffs Harbour, NSW 2450, Australia; E-Mail: [email protected]
4
Department of Forest and Ecosystem Science, University of Melbourne, 4 Water Street, Creswick, VIC 3363, Australia; E-Mail: [email protected]
† Current address: Hawkesbury Institute for the Environment, University of Western Sydney,
Locked Bag 1797, Penrith, NSW 2751, Australia.
* Author to whom correspondence should be addressed; E-Mail: [email protected]; Tel.: +61-2-45711647; Fax: +61-2-45701103.
Received: 23 January 2014; in revised form: 18 March 2014 / Accepted: 9 April 2014 / Published: 22 April 2014
biomass in frequently burnt plots by the end of the study. Significant differences in carbon biomass between the two extremes in frequency were only evident after >15–20 years of sustained treatment. Reduced growth rates and survivorship of smaller trees on the frequently burnt plots compared to unburnt plots appeared to be driving these patterns. The biomass of understorey trees, which constituted ~10% of total living tree biomass, was not affected by frequent burning. These findings suggest that future shifts toward more frequent fire will potentially result in considerable reductions in carbon sequestration across temperate forest ecosystems in Australia.
Keywords: carbon; tree demography; fuel reduction burning; fire frequency; eucalypt forest
1. Introduction
Carbon sequestration is an important strategy for the mitigation of climate change. Native forests store a considerable proportion of terrestrial carbon [1,2], hence managing these forests to increase carbon sequestration and storage will be of environmental importance [3]. The amount of carbon a forest can store will be strongly influenced by prevailing environmental conditions, such as temperature and precipitation, and disturbance regimes such as fire [4,5]. Fire regimes will be sensitive to a range of factors including climate, vegetation and human activities (e.g., fire management, anthropogenic ignitions) [6–8]. Characteristic patterns in climate, vegetation and human activities are temporally dynamic, consequently fire regimes experienced across broad landscapes and vegetation types have the potential to experience considerable shifts [9,10], even at relatively short time frames (e.g., decades to centuries; [11]). Very little is known about the response of carbon stocks to different fire regimes [4], representing a major impediment for forest management aimed at increasing carbon sequestration.
Fire frequency is one element of the fire regime that is likely to be influential in shaping carbon stocks. The interval between fires can influence plant mortality rates, growth rates and the recruitment of seedlings between fires [21–23]. Such key demographic processes influence stand structure and biomass. The shortening of intervals between fires (i.e., increasing fire frequency) has been observed in some cases to lead to reductions in growth rate [23–25] and recruitment [22,26], increases in tree mortality [22,25–27] and reductions in tree basal area and carbon storage [22,25,27,28].
The Bulls Ground Frequent Burning Study is a long term experiment designed to examine the effect of frequent low intensity burning on the dynamics of an open wet sclerophyll forest community [29], a common forest type in which canopy species are predominantly resprouters (i.e., have a high capacity for vegetative recovery following wildfire), the dominant fire response syndrome of canopy species across temperate forests of eastern Australia [30,31]. Two burning treatments were imposed in this experiment, with experimental plots being either burnt notionally every three years or protected from fire (i.e., unburnt) [29]. These treatments approximate the upper and lower fire frequency extremes that may be expected within many temperate and sub-tropical eucalypt forest ecosystems [12,32]. All trees within the experimental plots were remeasured six times over the study period at three to six year intervals. This experiment provided an ideal opportunity to examine the variability in carbon stocks, and some of the important underlying demographic processes (i.e., growth rate and survival) driving these patterns, across the range of possible fire frequencies occurring in this forest type. Specifically we predicted that: (i) tree biomass will be reduced on frequently burnt plots compared to unburnt plots, due to reduced growth rates and increased mortality on frequently burnt plots; and (ii) that the impacts of frequent burning will not be immediate, but rather will take several decades to become evident, owing to the dominance of resprouting as a fire response of tree species in these forests.
2. Methods
2.1. Study Area and Experimental Design
aged and in a state of regeneration. Hence biomass accumulation occurred over the course of the study period.
The Bulls Ground Frequent Burning Study was established in 1969 in order to examine the effect of frequent low intensity fire on forest growth. Although implementation of the experimental treatments still continues, our focus was on the period between 1969 and 1992, during which time systematic surveys of tree plots were undertaken. Fourteen treatment blocks (~1 ha) were established in openings where trees had been felled during logging operations of 1958–1959. Treatment blocks were randomly assigned to frequently burnt and unburnt treatments, each with seven replicate blocks. A low intensity burn was applied to the burnt treatment in autumn at approximately three year intervals (1970, 1973/1974, 1977, 1980, 1983, 1986, 1989, 1992), with between 70%–100% of each plot being burnt each time [29]. Fires were generally of a low severity (<5 m maximum scorch height, [34]) consuming on average ~60% of fine fuel (<25 mm) in the surface and near surface layers [36]. Each block was burnt as a discrete unit. Cleared buffer areas were placed around blocks to protect them 5 cm were recorded within survey plots during each survey period. Measurements were only made for overstorey tree species (Eucalyptus spp., Corymbia gummifera and Syncarpia glomulifera) in 1969 and 1972. However, from 1974 onwards all overstorey and understorey species greater than 5 cm DBH were recorded, with Allocasuarina torulosa being the dominant understorey species. Consequently, data analysis was conducted independently for overstorey tree species and understorey species to accommodate the different survey period lengths. Carbon biomass of overstorey and understorey living trees was calculated using DBH data based on the allometric relationship for native sclerophyll forests provided in Keith [37]:
Y = exp(−2.3267 + 2.4855 lnX)/1000 (1)
where Y is aboveground biomass (tonnes, t) and X is DBH (cm). This generic equation was used as there were insufficient species specific equations suitable for our study area and species. While the use of a generic equation would have reduced the level of accuracy of our above ground biomass predictions, this inaccuracy was present across all plots and should not impede comparison between experimental treatments. The concentration of carbon in above ground living tree biomass was taken to be 50% of estimated above ground biomass [3]. Individual tree biomass was used to calculate carbon biomass (t ha−1) within each plot.
tree basal area (cm2) per year between two measurement periods for each tree where consecutive DBH measurements were available. DBH was measured over bark in our study, which may lead to overestimates in the difference in growth rate between burnt and unburnt plots (see Discussion), as fire can reduce bark thickness via bark consumption [38]. Survivorship was calculated as the number of trees (DBH > 5cm) that were recorded during the previous survey period. Unrecorded trees were assumed to have died between the two survey periods. DBH was recorded as changing from greater than 5 cm to less than 5 cm between survey periods for a small number of trees (n = 66; <0.5% of the dataset). Such records appear to have been sporadically taken, so these trees were treated as having died. 2.3. Statistical Analysis
Analysis of the effect of burning treatment on tree biomass, number and DBH was undertaken in two ways. The first examined differences in burning treatment effects within each survey period, while the second focused on the effect of burning treatment and regeneration age across all survey periods. The effect of burning treatment within each survey period was assessed using one-way analysis of variance (ANOVA) for tree biomass and the number of trees. Biomass and the number of trees were assessed for normality using histograms and the Shapiro Wilk normality test and homogeneity of variances was assessed using the Bartlett Test. Logarithmic transformations (ln) were applied where these assumptions were violated, and transformed data was subsequently reassessed. Minor violations of the assumption of normality and homogeneity of variances were considered acceptable due to the balanced design on the study [39]. Linear mixed models (LMM) were used to analyse the effect of burning treatment within each survey period on the DBH of individual trees within plots, with plot being included as a random effect to account for the nested nature of tree measurements within plots. Logarithmic transformations were applied to DBH measurements to improve normality.
Mixed models were used to examine how biomass, tree number and DBH were affected by regeneration age and burning treatment. Relationships between response data and regeneration age within both burnt and unburnt treatments were assessed visually using scatterplots to determine if they were linear or non-linear. Linear mixed models (LMM) were used to assess linear relationships and generalised additive mixed models (GAMM) were used for non-linear relationships. Logarithmic transformations (ln) were applied to response data with an apparent non-normal distribution. Plot number was included as a random effect in the mixed models to account for the repeated measures on each plot. Every combination of regeneration age and burning treatment was assessed up to first order
interactions. Akaike’s information criterion (AIC) was used for model selection, with the best model
being the one with the lowest AIC [40]. Models within two AIC points were considered to be plausible alternatives, with the most parsimonious model (i.e., the one with the fewest predictor variables) being selected preferentially [41]. Models greater than 10 AIC points from the best model were considered to have no support [41].
relationship between growth rate and DBH1 and the repeated tree measurements, with plot number being included as a random effect. The AIC approach described above was used for model selection. Every combination of fire treatment, TS2, DBH1 and interactions between DBH1 and fire treatment described above was used for model selection. Every combination of fire treatment and TS2 including first order interactions was assessed.
Analysis was conducted using the ―R‖ statistical package (R Development Core Team, 2010, [44]). The package ―nlme‖ was used for LMMs and the package ―mgcv‖ was used for GAMMs.
3. Results
3.1. Biomass, Tree Density and Size
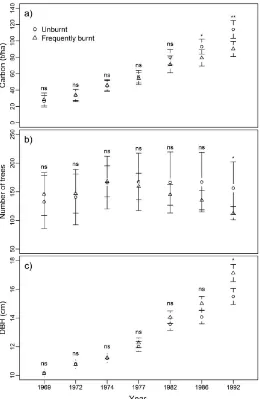
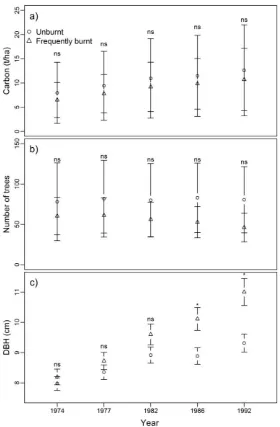
Overstorey tree species comprised approximately 90% of the estimated above ground living tree carbon pool, with understorey species making up the remaining 10%. Carbon biomass of overstorey tree species increased with time on both the frequently burnt and unburnt plots, though the rate of accumulation was lower on the frequently burnt plots (Figure 1a). One-way ANOVA comparing fire effects within measurement periods found that significant differences in carbon biomass only occurred in the final two measurements (1986 and 1992—i.e., after five and seven fires respectively) (Figure 1a). This indicates that extensive periods (~15–20 years) of frequent burning were required before significant changes in above ground carbon storage in overstorey species occurred. The preferred LMM assessing the effect of fire treatment and forest regeneration age contained a significant interaction between these two variables (p < 0.001), indicating that accumulation of living biomass in overstorey trees following logging occurred at a lower rate on frequently burnt plots than unburnt plots. No other models were within 10 AIC points of this model indicating no support. There was no significant effect of burning treatment on carbon biomass of understorey tree species within any of the survey periods (Figure 2a). The preferred LMM assessing the effect of fire treatment and regeneration age on understorey species biomass supported this finding, as it contained only regeneration age, which had a significant positive effect on biomass (p < 0.000). No other models were within two AIC points of this model, with only the additive model containing fire treatment and
regeneration age being within 10 AIC points (∆AIC = 2.33). However, burning treatment did not have a significant effect (p = 0.808) on biomass in this additive model.
the differential responses of overstorey tree density to regeneration age within frequently burnt and unburnt plots described above (Figure 1b). No other models were within 10 AIC points of this model indicating no support. Although one-way ANOVA found no significant effect of burning treatment on the number of understorey trees within survey periods (Figure 2b), the preferred LMM contained a significant interaction between regeneration age and burning treatment (p < 0.000), with no other models having any support (i.e., ∆AIC > 10). This model indicates that the number of understorey trees was decreasing with regeneration age on frequently burnt plots, but increasing slightly with age on unburnt plots. Variability in the number of overstorey and understorey trees across plots also decreased with time on the frequently burnt plots, as evidenced by the narrowing of the 95% confidence intervals, suggesting that frequent burning is leading to a more uniform stand density spatially (Figures 1b and 2b).
Figure 2. Mean and 95% confidence interval for (a) estimated carbon biomass (tha−1), (b) number of trees and (c) tree diameter for understorey species on frequently burnt and unburnt plots across all survey periods. Symbols above error bars show the results of one way analysis of variance (a,b) or linear mixed models (c) comparing the effects of burning within each treatment year (ns: p > 0.05; *: 0.05 > p > 0.01; **: 0.01 > p > 0.001). Untransformed data is presented.
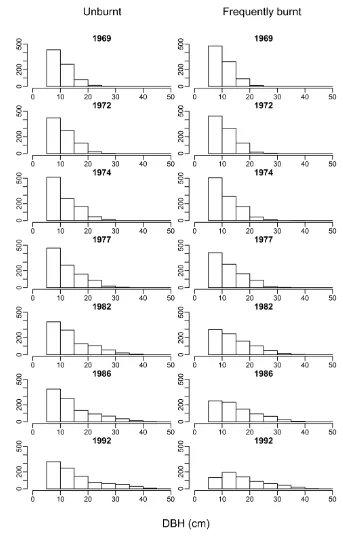
both treatments (Figure 3). Similar patterns were observed for understorey species [45]. This indicates that frequent burning was removing the smaller trees, resulting in fewer individuals with a greater diameter on average compared to the unburnt plots.
3.2. Growth Rate
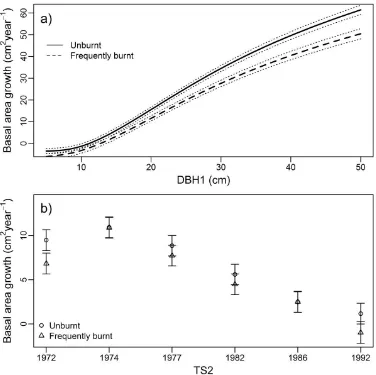
The best GAMM for the growth rate of both overstorey and understorey species contained an interaction between DBH at first survey (DBH1) and burning treatment and burning treatment and timing of the second survey (TS2). No other models had any support (i.e., ∆AIC > 10). Growth rate of overstorey species was lower on frequently burnt plots compared to unburnt plots, with differences becoming greater for larger trees (Figure 4a). Growth rates typically decreased over time on both frequently burnt and unburnt plots, though burning treatment effects were variable across survey periods (Figure 4b). In contrast to overstorey species, the growth rate of understorey species was greater on frequently burnt plots compared to unburnt plots, with differences becoming greater for larger trees (Figure 5a). Growth rates typically decreased over time on both frequently and unburnt burnt plots (Figure 5b).
Figure 5. Model predictions of annual change in basal area of understorey species between measurement periods (cm2 year−1) in response to: (a) burning treatment and DBH at the first survey (DBH1); and (b) timing of the second survey (TS2) and burning treatment. Dotted lines in (a) show the 95% confidence interval. Error bars in (b) show 95% confidence intervals. Predictions held TS2 constant at 1992 in (a) and DBH1 constant at 8 cm in (b).
3.3. Survival
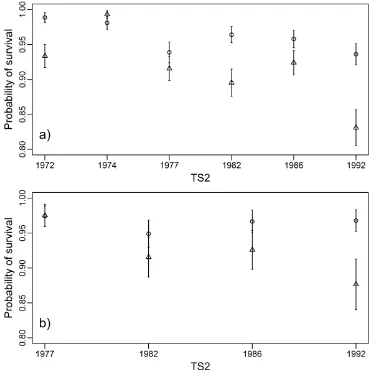
Figure 6. The proportion of trees surviving between survey periods. Overstorey species are shown in (a), and understorey species are shown in (b). Values on the x-axes show the timing of the second survey period (TS2). Error bars represent 95% confidence intervals.
4. Discussion
4.1. Impacts of Frequent Burning on Carbon and Stand Structure
Impacts of frequent burning were not immediate, with significant differences in living tree carbon stocks only being recorded after ~15 years (or five fires) of frequent burning. This is presumably because the mechanisms driving these changes (e.g., reduced growth rates, increased mortality) only lead to noticeable changes in tree biomass after extended periods and/or multiple fires (see below). Therefore the effects of frequent burning may take several decades to become evident. It also emphasises the value of long term experiments, such as this one, in distinguishing responses of long-lived species such as trees. Although these results suggest that short periods (i.e., <15 years) of frequent burning may occur without reducing live tree carbon storage in regenerating stands, it is possible that a ―lag effect‖ will exist whereby the trajectory of biomass recovery on burnt plots is lower than that of unburnt plots for some time after the cessation of burning. This is because processes facilitating stand and biomass recovery (e.g., tree recruitment, growth and maturation) after discrete fire events and stand modification in forest systems operate over time frames of decades to centuries [30].
Tree biomass and basal area have been found in a number of cases to be negatively related to fire frequency, or positively related to the length of the interval between fires, across a range of global ecosystems [22,25,27,28]. Reductions in above ground biomass observed in frequently burnt areas of our study (Figure 1a) appear to be largely driven by reduced growth rates (Figure 4) and survivorship of smaller (<15 cm) trees (Figure 3 and 6) compared to unburnt plots. This is consistent with previous studies which have reported increased rates of mortality in frequently burnt areas, with smaller trees often being at greater risk [22,25–27]. Small juvenile trees typically have thinner bark than mature individuals, and may be more susceptible to cambial damage resulting from fire [47]. This is likely to have led to the increased rates of mortality on the frequently burnt plots.
losses due to fire were not possible in our study as DBH measurements were taken 3–6 years post fire (i.e., immediately before the planned burns). However, we do know that the time between measurements would allow for some re-accumulation of bark consumed by fire, which may be in the order of ~0.5 mm–1 mm of bark growth per annum for some eucalypt species (e.g., E. obliqua [38]). While we were unable to precisely quantify the impact bark consumption had on our carbon prediction, analysis suggests that the mortality of overstorey trees and resultant changes to population demography can explain most of the overstorey carbon losses recorded at the conclusion of our study [45].
The higher growth rate of understorey trees in the frequently burnt plots compared to the unburnt plots may in part reflect the thinning of the overstorey species in the frequently burnt stands. Furthermore, understory trees were dominated (>95%) by Allocasuarina torulosa, a nitrogen fixing species. The proportion of nitrogen in fallen leaves has been found to be greater in unburnt plots than the frequently burnt plots of the Bulls Ground experiment [49]. Topsoil soil nitrogen (0–10 cm deep) has also been found to be higher in fire exclusion treatments than quadrennial or biennial burning treatments (only the differences between unburnt and biennial treatment were significant though) in an experiment conducted within E. pilularis forest in southern Queensland, Australia [50]. It is possible that the nitrogen fixing ability of A. torulosa may have allowed this species to overcome nitrogen limitations and exploit the greater space available on the frequently burnt plots.
4.2. Implications of Fire Management and Future Fire Regimes for Carbon
Regenerating forests have been identified as having a high potential for carbon sequestration, though it may take centuries before regenerating forests approach their carbon carrying capacity (CCC) [3]. Our study suggests that very frequently burnt tall open forest stands, over a period of two decades, have on average approximately 25.8 tha−1 (~20%) less above-ground carbon stored in living trees than unburnt stands. Total CCC of above ground living vegetation has been estimated at ~360 tha−1 in tall open forests, similar to those examined in our study [3], though carbon biomass values derived from the harvest and weighing of a 0.5 ha mature forest plot dominated by E. pilularis near our study area are considerably lower (~210 tha−1; [51]). Therefore, our results suggest that frequent burning over a period of about two decades has reduced carbon biomass in the living tree component by somewhere in the order of 7%–12% of CCC in the regenerating stands.
biome. Tall (>30 m canopy height) to medium (10–30 m canopy height) open forests cover ~35 million ha of southern Australia [53], therefore, these relatively modest fire-induced reductions in carbon storage could have significant implications for carbon budgets at broader regional and biome-level scales.
Fire intensity or severity also has a strong effect on plant mortality, growth and live carbon stocks, with more intense fires being associated with increased reductions in stored carbon compared to less intense fires occurring at the same frequency [27,28,46]. The bulk of above-ground carbon (~80%) is contained in the live biomass component [3], consequently above-ground storage of carbon is primarily a function of tree demography. Infrequent high severity fire is known to cause up to ~5% tree mortality in resprouting eucalypts, but such mortality may be halved in response to low-moderate intensity fires [54]. Weather is the dominant driver of fire severity, which may also be positively related to fuel age or time since last fire [52,55,56]. High severity fires also stimulate considerable tree recruitment from seed [54], which has the capacity to fill gaps created by mortality in the medium term. Thus at a site or stand level the outcome of any fire regime will involve complex trade-offs between effects of fire frequency and intensity on demographic processes that require quantification and comprehensive modelling to resolve. For example, use of prescribed fire for fuel reduction involves a trade-off between decreased fire intensity and increased fire frequency due to the nature of interactions between prescribed fire and wildfires [4,57]. Thus reduced tree mortality resulting from an average decrease in fire intensity may be offset to some degree by increased tree mortality due to increased average frequency of fire. Further insights into effects of global change and alterations to future management policies and practices on fire regimes and carbon storage will therefore be dependent on development of a detailed understanding of key demographic processes in tree species and application of appropriate models (e.g., [58]).
Fire behaviour is not spatially homogeneous, with considerable variation in patchiness and intensity being observed within the perimeters of both prescribed burns and wildfires [52,55,56,59]. While prescribed fire may be applied at short rotations, the interval at which a point in the landscape burns may be much greater [59]. The burning plots examined in our study were quite small (1 ha), so internal patchiness would not have been as prevalent as in larger management burns. Furthermore, plots were located on ridges, which are more likely to burn than other topographic locations [59]. The relative reductions of live carbon in burnt compared to unburnt plots reported in our study (~20%) were greater than values derived from open and tall open temperate forests in Victoria, Australia (i.e., ~11% [25]) in which larger burning treatment areas (3–35 ha) were conducted. These differences probably in part reflect the more homogeneous nature of burns conducted in our study, though differences related to forest age and type and methods of carbon estimation may have also contributed. Consequently, our results may represent an upper extreme of the impacts of frequent burning on carbon and forest structure.
5. Conclusions
resprouting capacity, frequent burning may lead to considerable site scale reductions (up to 20%) in the carbon biomass of living trees. These findings will have important implications for the future management of carbon budgets within forests, as fire frequency is expected to increase as a result of both climate change and fire management practices.
Acknowledgments
The Australian Department of the Environment funded the data analysis component of this research project. The Forestry Corporation of NSW and the NSW Department of Primary Industries provided the forest measurement data. A substantial number of staff of the former Forestry Commission of NSW were dedicated to the establishment, maintenance and measurement of this project, most recently Bill Buckler, Roger Heywood and Bill Chapman. Cameron Stewart compiled the final tree measurement database from original records, with Helen Doherty subsequently checking a number of data entries for accuracy.
Author Contributions
Luke Collins conducted the data analysis and prepared the manuscript. Trent Penman and Fabiano de Aquino Ximenes secured funding for the work undertaken by Luke Collins and assisted with data analysis and manuscript preparation. Doug Binns and Alan York facilitated the creation and validation of the Bulls Ground database and provided comments on the manuscript. Ross Bradstock assisted with manuscript preparation, in particular the conceptual direction of the manuscript.
Conflicts of Interest
The authors declare no conflict of interest. References
1. Bonan, G.B. Forests and climate change: Forcings, feedbacks, and the climate benefits of forests. Science 2008, 320, 1444–1449.
2. Luyssaert, S.; Schulze, E.D.; Borner, A.; Knohl, A.; Hessenmoller, D.; Law, B.E.; Ciais, P.; Grace, J. Old-growth forests as global carbon sinks. Nature 2008, 455, 213–215.
3. Roxburgh, S.H.; Wood, S.W.; Mackey, B.G.; Woldendorp, G.; Gibbons, P. Assessing the carbon sequestration potential of managed forests: A case study from temperate Australia. J. Appl. Ecol. 2006, 43, 1149–1159.
4. Williams, R.; Barrett, D.; Beringer, J.; Boer, M.; Bradstock, R.; Cary, G.; Cook, G.; Gill, A.; Hutley, L.; Keith, H.; et al. Fire regimes and carbon in Australian vegetation. In Flammable Australia: Fire Regimes, Biodiversity and Ecosystems in a Changing World; Bradstock, R., Gill, A., Williams, R., Eds.; CSIRO Publishing: Melbourne, Australia, 2012.
6. Bradstock, R.A. A biogeographic model of fire regimes in Australia: Current and future implications. Glob. Ecol. Biogeogr. 2010, 19, 145–158.
7. Archibald, S.; Lehmann, C.E.R.; Gómez-Dans, J.L.; Bradstock, R.A. Defining pyromes and global syndromes of fire regimes. Proc. Natl. Acad. Sci. USA 2013, 110, 6442–6447.
8. Krawchuk, M.A.; Moritz, M.A. Constraints on global fire activity vary across a resource gradient. Ecology 2010, 92, 121–132.
9. Keeley, J.E.; Bond, W.J.; Bradstock, R.A.; Pausas, J.G.; Rundel, P.W. Fire in Mediterranean Ecosystems: Ecology, Evolution and Management; Cambridge University Press: Cambridge, UK, 2012.
10. Bradstock, R.A.; Williams, J.E.; Gill, A.M. Flammable Australia: The Fire Regimes and Biodiversity of a Continent; Cambridge University Press: Cambridge, UK, 2002.
11. Moritz, M.A. Spatiotemporal analysis of controls on shrubland fire regimes: Age dependency and fire hazard. Ecology 2003, 84, 351–361.
12. Gill, A.M.; Catling, P.C. Fire regimes and biodiversity of forested landscapes of southern Australia. In Flammable Australia: Fire Regimes and Biodiversity of a Continent; Bradstock, R.A., Williams, J.E., Gill, A.M., Eds.; Cambridge University Press: Cambridge, UK, 2002; pp. 351–369.
13. Huston, M. Understanding the effects of fire and other mortality-causing disturbances on species diversity. In Fire in Ecosystems of South-west Western Australia: Impacts and Management; Abbott, I., Burrows, N., Eds.; Backhuys Publishers: Leiden, The Netherlands, 2003; pp. 37–70. 14. Cary, G.J.; Bradstock, R.A.; Gill, A.M.; Williams, R.J. Global change and fire regimes in
Australia. In Flammable Australia: Fire Regimes, Biodiversity and Ecosystems in a Changing World; Bradstock, R., Gill, A., Williams, R., Eds.; CSIRO Publishing: Collingwood, VIC, Canada, 2012.
15. King, K.J.; de Ligt, R.M.; Cary, G.J. Fire and carbon dynamics under climate change in south-eastern Australia: Insights from FullCAM and FIRESCAPE modelling. Int. J. Wildland Fire 2011, 20, 563–577.
16. Penman, T.D.; Bradstock, R.A.; Price, O. Modelling the determinants of ignition in the Sydney Basin, Australia: Implications for future management. Int. J. Wildland Fire 2013, 22, 469–478. 17. Esplin, B.; Gill, A.M.; Enright, N.J. Report of the Inquiry into the 2002–2003 Victorian Bushfires;
Department of Premier and Cabinet: Melbourne, Australia, 2003.
18. Teague, B.; Mcleod, R.; Pascoe, S. 2009 Victorian Bushfires Royal Commission Final Report; Parliament of Victoria: Melbourne, Australia, 2010.
19. Price, O.F.; Bradstock, R.A. Quantifying the influence of fuel age and weather on the annual extent of unplanned fires in the Sydney region of Australia. Int. J. Wildland Fire 2011, 20, 142–151. 20. Bradstock, R.A.; Cary, G.J.; Davies, I.; Lindenmayer, D.B.; Price, O.F.; Williams, R.J.
Wildfires, fuel treatment and risk mitigation in Australian eucalypt forests: Insights from landscape-scale simulation. J. Environ. Manag. 2012, 105, 66–75.
21. Keith, D.A. Fire-driven extinction of plant populations: A synthesis of theory and review of evidence from Australian vegetation. Proc. Linn. Soc. N. S. W. 1996, 116, 37–78.
23. Murphy, B.P.; Russell-Smith, J.; Prior, L.D. Frequent fires reduce tree growth in northern Australian savannas: Implications for tree demography and carbon sequestration. Glob. Chang. Biol. 2010, 16, 331–343.
24. Prior, L.D.; Brook, B.W.; Williams, R.J.; Werner, P.A.; Bradshaw, C.J.A.; Bowman, D.M.J.S. Environmental and allometric drivers of tree growth rates in a north Australian savanna. For. Ecol. Manag. 2006, 234, 164–180.
25. Bennett, L.T.; Aponte, C.; Tolhurst, K.G.; Löw, M.; Baker, T.G. Decreases in standing tree-based carbon stocks associated with repeated prescribed fires in a temperate mixed-species eucalypt forest. For. Ecol. Manag. 2013, 306, 243–255.
26. Guinto, D.F.; House, A.P.N.; Xu, Z.H.; Saffigna, P.G. Impacts of repeated fuel reduction burning on tree growth, mortality and recruitment in mixed species eucalypt forests of southeast Queensland, Australia. For. Ecol. Manag. 1999, 115, 13–27.
27. Williams, R.J.; Cook, G.D.; Gill, A.M.; Moore, P.H.R. Fire regime, fire intensity and tree survival in a tropical savanna in northern Australia. Aust. J. Ecol. 1999, 24, 50–59.
28. Ryan, C.M.; Williams, M. How does fire intensity and frequency affect miombo woodland tree populations and biomass? Ecol. Appl. 2010, 21, 48–60.
29. Penman, T.D.; York, A. Climate and recent fire history affect fuel loads in eucalyptus forests: Implications for fire management in a changing climate. For. Ecol. Manag. 2010, 260, 1791–1797. 30. Florence, R.G. Ecology and Silviculture of Eucalypt Forests; CSIRO Publishing: Collingwood,
VIC, Australia, 1996; p. 413.
31. Bradstock, R.A. Effects of large fires on biodiversity in south-eastern Australia: Disaster or template for diversity? Int. J. Wildland Fire 2008, 17, 809–822.
32. Gill, A.M. Bushfires and biodiversity in southern Australian forests. In Flammable Australia: Fire Regimes, Biodiversity and Ecosystems in a Changing World; Bradstock, R., Williams, R., Gill, A., Eds.; CSIRO Publishing: Melbourne, Australia, 2012.
33. Port Macquarie Airport Station No. 060139. Available online: www.bom.gov.au (accessed on 11 March 2014).
34. Christie, F.J.; York, A. No detectable impacts of frequent burning on foliar C and N or insect herbivory in an Australian eucalypt forest. Appl. Veg. Sci. 2009, 12, 376–384.
35. Keith, D. Ocean Shores to Desert Dunes: The Native Vegetation of New South Wales and the ACT; Department of Environment and Conservation: Sydney, Australia, 2004; p. 353.
36. Collins, L. Hawkesbury Institute for the Environment, University of Western Sydney, Richmond, NSW, Australia. Unpublished Work, 2013.
37. Keith, H.; Barrett, D.; Keenan, R. Review of allometric relationships for estimating woody biomass for New South Wales, the Australian Capital Territory, Victoria, Tasmania and South Australia. In National Carbon Accounting System Technical Report No. 5b; Commonwealth of Australia: Canberra, Australia, 2000; p. 111.
38. Chatto, K.; Bell, T.; Kellas, J. Effects of Repeated Low-intensity Fire on Tree Growth and Bark in a Mixed Eucalypt Foothill Forest in South-eastern Australia; Department of Sustainability and Environment: East Melbourne, Australia, 2003; p. 22.
40. Akaike, H. Information Theory as an extension of the maximum likelihood principle. In Proceedings of Second International Symposium on Information Theory; Akademiai Kiado: Budapest, Hungary, 1973; pp. 267–281.
41. Burnham, K.P.; Anderson, D.R. Model Selection and Multimodel Inference: A Practical Information-theoretic Approach; Springer: New York, NY, USA, 2002.
42. Penman, T.D.; Lemckert, F.L.; Mahony, M.J. Meteorological effects on the activity of the giant burrowing frog (Heleioporus australiacus) in south-eastern Australia. Wildlife Res. 2006, 33, 35–40. 43. Venables, W.N.; Ripley, B.D. Modern Applied Statistics with S-Plus; Springer Verlag: New York,
NY, USA, 1994.
44. R Development Core Team. R: A Language and Environment for Statistical Computing; R Foundation for Statistical Computing: Vienna, Austria, 2010.
45. Collins, L. Hawkesbury Institute for the Environment, University of Western Sydney, Richmond, NSW, Australia. Unpublished Work, 2013.
46. Murphy, B.P.; Lehmann, C.E.R.; Russell-Smith, J.; Lawes, M.J. Fire regimes and woody biomass dynamics in Australian savannas. J. Biogeogr. 2014, 41, 133–144.
47. Lawes, M.J.; Midgley, J.J.; Clarke, P.J. Costs and benefits of relative bark thickness in relation to fire damage: A savanna/forest contrast. J. Ecol. 2013, 101, 517–524.
48. Van Loon, A.P. Investigations into the Effects of Prescribed Burning on Young, Even-aged Blackbutt: Establishment and Preliminary Progress Report; Forestry Commission of New South Wales, Central Coast Research Centre: Taree, NSW, Australia, 1969; p. 49.
49. Brennan, K.E.C.; Christie, F.J.; York, A. Global climate change and litter decomposition: More frequent fire slows decomposition and increases the functional importance of invertebrates. Glob. Chang. Biol. 2009, 15, 2958–2971.
50. Bastias, B.A.; Huang, Z.Q.; Blumfield, T.; Xu, Z.; Cairney, J.W.G. Influence of repeated prescribed burning on the soil fungal community in an eastern Australian wet sclerophyll forest. Soil Biol. Biochem. 2006, 38, 3492–3501.
51. Ximenes, F. NSW Department of Primary Industries, North Parramatta, NSW, Australia. Unpublished Work, 2013.
52. Bradstock, R.A.; Hammill, K.A.; Collins, L.; Price, O. Effects of weather, fuel and terrain on fire severity in topographically diverse landscapes of south-eastern Australia. Landsc. Ecol. 2010, 25, 607–619.
53. Montreal Process Implementation Group for Australia. Australia’s State of the Forests Report 2008; Bureau of Rural Sciences: Canberra, Australia, 2008; p. 250.
54. Vivian, L.M.; Cary, G.J.; Bradstock, R.A.; Gill, A.M. Influence of fire severity on the regeneration, recruitment and distribution of eucalypts in the Cotter River Catchment, Australian Capital Territory. Austral Ecol. 2008, 33, 55–67.
55. Collins, L.; Bradstock, R.A.; Penman, T.D. Can precipitation influence landscape controls on wildfire severity? A case study within temperate eucalypt forests of south-eastern Australia. Int. J. Wildland Fire 2014, 23, 9–20.
57. Bradstock, R.A.; Boer, M.M.; Cary, G.J.; Price, O.F.; Williams, R.J.; Barrett, D.; Cook, G.; Gill, A.M.; Hutley, L.B.W.; Keith, H.; et al. Modelling the potential for prescribed burning to mitigate carbon emissions from wildfires in fire-prone forests of Australia. Int. J. Wildland Fire 2012, 21, 629–639.
58. Liedloff, A.C.; Cook, G.D. Modelling the effects of rainfall variability and fire on tree populations in an Australian tropical savanna with the flames simulation model. Ecol. Model. 2007, 201, 269–282.
59. Penman, T.D.; Kavanagh, R.P.; Binns, D.L.; Melick, D.R. Patchiness of prescribed burns in dry sclerophyll eucalypt forests in south-eastern Australia. For. Ecol. Manag. 2007, 252, 24–32.