Gadjah Mada International Journal of Business Vol. 20, No. 1 (January-April): 59-87
Training and Development Policy,
Corporate Governance, and Firm Performance
Rayenda Khresna Brahmana,
1*Ritzky Karina Brahmana,
2and
Theresa Char Fei Ho
31 Faculty of Accountancy, Finance and Business, Universiti Sarawak Malaysia, Malaysia 2 Faculty of Economy and Business, Universitas Kristen Petra Surabaya, Indonesia 3 Faculty of Accountancy, Finance and Business, Tunku Abdul Rahman University College, Malaysia
Abstract: This research investigates the role of corporate governance as a moderator between firms’ performance and their Training and Development Policy (TDP). Research data were taken from the US, Brazil, Russia, India, China and Indonesia from 2007 to 2013. This research found that the TDP is important for enhancing firm performance. Also, the role of the training and development policy im-pacted each firm’s performance differently, according to the level of corporate governance of that firm. The moderating effect of corporate governance reveals that better governance of a firm may have an influence on its TDP policy, which would lead to better firm performance. Overall, the results are consis-tent with the conjecture that corporate governance influences the firm’s performance and training and development policy, suggesting that the training and development policy’s success depends on the corpo-rate governance level of the firm. Hence, this research contributes to two big theories: the knowledge transfer theory and the human capital theory, where the research findings show a confirmation of the two theories application in this research context.
Keywords: corporate governance; finance; firm performance; training
Introduction
An industry report by the International Labour Organization ILO (2006) indicated that organizations in the United States spent a total of $55.8 billion on their Training and Development Policies (hereafter TDP). The net direct training expenditure averaged USD458 per employee and 1.3 percent of the total gross wages and salaries. This number had increased substantially with the com-pounded growth rate being around 5 percent in 2010, since 1996. Although training is only one way for employee learning to occur, the investment made in training requires an analy-sis of the evidence to examine if training pays off in organizational effectiveness. However, there is skepticism about the link between training and the results criteria. Training is often criticised for being faddish, too expen-sive, not transferring to the job, and not im-proving the bottom line (Bowers 2017; Caudron 2002; Kraiger et al. 2004; Wright and Geroy 2001).
However, several scholars argued that the knowledge and skills of an organization’s workforce are significantly important to firm performance, competitiveness, and innova-tion (Dukhan et al. 2017; Madarisa et al. 2017). According to Kraiger (2003), success-ful organizations are thought to invest more in training and development than other orga-nizations, where these training and develop-ment programmes will lead to improvedevelop-ments in the organizational performance and results (Dolezalek 2005; Salas and Cannon-Bowers 2001).
Further, the TDP performance topics focus only on the costs and benefits of TDP to firm performance without taking into con-sideration the corporate governance factors. It is important to examine TDP through the agency cost perspective by taking corporate
governance as an important factor. Studies done by de Kok et al. (2003), Bunch (2007), and Deng et al. (2012) emphasised that the success of any training and development would depend on the governance of the firm. In other words, the ownership concentration, firm’s size, and board structure play impor-tant roles in determining the success of the TDP, which is in line with the alignment theo-rem. Moreover, most of the research con-ducted in this area only evaluates TDP using reaction criteria (Alliger et al. 1997; Kraiger 2003; Kraiger et al. 2004), and surveys (Nguyen et al. 2011; Ganotakis 2012). Hence this research aims to bridge the research gap in this area.
Nevertheless, the research into the ef-fects of training on performance remains de-batable, especially at the organizational level of analysis (Tharenou et al. 2007). Prior re-searchers such as Hsu and Wang (2010) Subramanian and Youndt (2005) found that human resources have an impact on organi-zational performance, as the core of an orga-nization. Thus, it is pertinent for an organi-zation to ensure that all the key success fac-tors of TDP must not be taken lightly. This study aims to investigate the association be-tween TDP and firm performance by using samples taken from the US and the leading emerging countries such as Brazil, Russia, India, China, and Indonesia from 2007 to 2013. This study further investigates the re-lationship by introducing corporate gover-nance into the estimation model as a mod-erator, to examine whether the performance of TDP would depend on the firms’ good corporate governance.
the developed market context. Adding the leading emerging economies such Brazil, Rus-sia, India, China, and Indonesia may result in a better insight into this research area. To make it more robust, this research added one developed economy, the US, into this research for a better comparison. Second, this research aims to compare the effect of TDP on cor-porate performance in two different econo-mies of scale. Brazil, Russia, India, China, and Indonesia are the leading developing economies, with a steady pace of capitaliza-tion of their stock markets. The GDP and HDI improvements may give different per-spectives on the TDP-performance links. Yet, the US, as the representative of the devel-oped markets, might have a different insight on these TDP-performance links. Comparing the results from those countries enriches the generalization of this research. Lastly, each country may have different corporate gover-nance and unique institutional settings. As corporate governance is the moderating vari-able, adding these six countries may give a better view of the role of governance on the TDP-performance link.
In sum, this study aims to examine the role of corporate governance on the relation-ship between TDP and firms’ corporate per-formance. This research uses two perfor-mance measures: Tobin’s Q and the return on assets. Furthermore, this research has ex-tended the common research design in hu-man resource to a new empirical context and modified the model in terms of some mea-sures and definitions. It also followed previ-ous, established studies by controlling for the firms’ characteristics. This research focused on two aspects namely: TDP and corporate governance, and used secondary data for the TDP and the corporate governance index from Asset4, which are all explained in
Sec-tion 3. The knowledge theory is used as the base for this research’s framework.
This study’s contribution is threefold.
First, this research enriched the literature by extending the understanding of this research area for the context of both developed coun-tries and developing councoun-tries. Second, this research documented the empirical findings of training and developments’ effects on cor-porate values in developed and developing countries. Third, this study further established the fact that corporate governance may play a significant role in determining the perfor-mance of a firm in relation to its training and development.
The research paper is organised accord-ing to the followaccord-ing sequence. In the next section, the related literature is briefly re-viewed. Section 3 describes the data, sample selection criteria, and preliminary analysis. Section 4 shows the findings and discussions. Section 5 presents the conclusion and impli-cations of the research.
Literature review
train-ing and development is often viewed as a waste of resources, and are implemented just to comply with legal requirements. Training is also perceived by some organizations as a fad without linking the training to measur-able results (Tharenou et al. 2007; Caudron 2002; Kraiger et al. 2004).
Recent developments in the literature of strategic management realised the impor-tance of human capital/resources (Kamukama and Sulait 2017; Jardon and Dasilva 2017; Narwal and Yadav 2017; Jardon and Martos 2009). Human capital that possesses skilled and knowledgeable employ-ees through an organization’s training and development enables that organization to achieve a competitive advantage over its competitors. Valuable, rare and inimitable resources such as skills and knowledge are considered as resources (Jardon and Dasilva 2017; Narwal and Yadav 2017; Tharenou et al. 2007). Some researchers also equate an organizational learning capability, which in this study is manifested through the training and development of the organization, as a dynamic capability (Ambrosini et al. 2009; Zahra et al. 2006). Dynamic capability can be defined as the capabilities that are geared towards the modification of operational ca-pabilities, such as innovations to the organization’s product or processing systems (Zahra et al. 2006). Learning is an important capability that can be a source of sustainable competitive advantage. Investing in develop-ing learndevelop-ing capabilities is crucial in the cur-rent competitive environment.
This research uses two theories as the base of the research’s framework: the knowl-edge transfer theory and human capital theory. Knowledge transfer theory means the trans-ferring of knowledge from one organization to other. Using this theory, Hajidimitriou et al. (2012) showed empirical evidence of how
well-trained employees would benefit their organization through its knowledge diffusion. Besides that, Deardorff and Djankov (2000) in their study found that knowledge transfer through subcontracting arrangements will in-directly increase a firm’s performance when the knowledge transfer theory is properly ap-plied to the organization; it will increase the human capital of the employees and enable the organization to operate efficiently as the human capital of the organization increases. The notion was further supported by Hsiao et al (2017), Tsai (2001) who postulated that when knowledge is being transferred effi-ciently through an organization, it would be a sustainable competitive advantage for that firm.
Meanwhile, the human capital theory is a theory derived from the classical econom-ics stream. It shows that employees’ personal incomes will be different, as they are based on the amount of investment in the human capital of the employees. The investment in employees’ human capital means the educa-tional level as well as the training taken by the employees. Marimuthu et al. (2009) stated that human capital is the process of enhanc-ing people by improvenhanc-ing their educational level and professionalism, in order to improve their knowledge, skills, values and social as-sets that may help in improving their organization’s performance. This means that when the level of knowledge and ability has been upgraded, this may cause the organiza-tion to perform better. Furthermore, Ketchen et al. (2017) and Lepak and Snell (1999) de-fined human capital as the main component for increasing a business venture’s assets and workforce, to increase its efficiency and com-petitive advantage.
important information during the decision-making process and investment in the strate-gic assets. Ahmad et al. (2016) also agreed that the human capital theory means a higher educational level is needed to increase the capability of people, as different levels of education and skills can influence the level of wages. Vomberg et al. (2015) mentioned that there is a positive relationship between human capital and the firm value. This means that when the human capital of the worker or employee is high, the performance of the organization will be better and more efficient. How training may improve firm perfor-mance is debatable. From the perspective of the knowledge theory and resource based view, trained employees should benefit the organization. For instance, Khan et al (2011) showed that training and development have significant effects on organizational perfor-mance in Pakistan. They used 100 different samples and revealed that TDP is an impor-tant factor for an organization to deliver its vision, mission, and goals and enhance its employees’ abilities. Amstrong (2000) argued that TDP is very necessary for an organiza-tion, and it must be designed with the needs of the employees in mind. Those organiza-tions which develop a good training design, in accordance with the needs of their employ-ees as well as the organization, always get good results (Boudreau 2006). It seems that the design of the proposed training plays a very vital role in both the employees’ and the organization’s performance. Badly designed training is nothing but a waste of time and money (Tsaur and Lin 2004).
Methods
Firm Performance
Firm performance is calculated by two measurements, namely, the Return on Assets (ROA), and Tobin’s Q. In calculating the ROA, this research uses Earnings before In-terest, Taxes, and Depreciation (EBITDA) instead of net income as the numerator. The reason is that some industries might have a relative advantage or disadvantage from de-preciation and amortization which may lead to biased results. Meanwhile, the denomina-tor of ROA is the book value of assets. The formula is as follows:
Assets Total
EBITDA ROA
This research uses Tobin’s Q because it is relatively better at capturing the effective-ness of management (Westerfield et al, 2005). Tobin’s Q is the market value of total assets divided by their replacement costs, which can be written as follows:
Cost placement
Assets Total of MV Q s Tobin
Re
'
Control Variables
Value= f(Size, Growth Opportunities, Prof-itability, Leverage)
In measuring a firm’s size, this research uses the log of total assets (LTA). Meanwhile, other control variables were developed by fol-lowing previous research into corporate gov-ernance (Black et al. 2006; Bhagat and Bolton 2008; Masulis et al. 2012), where the growth opportunities ratio is capital expenditure di-vided by sales (CES). The profitability is taken from the ratio of operating income – sales ratio (OIS), and ratio of debt to com-mon share equity measures leverage (LEV). Hence, the empirical regression model is shown as Equation 1.
Value= + 1LTAi,t + 2LEVi,t +
3CESi,t + 4LEVi,t + i,t ...(1)
Training and Development
Policy (TDP)
This study uses Asset4 data to retrieve the Training and Development Policy (TDP). The category is a binary dummy variable, which equals 1 for firms which apply a train-ing and development policy.
Value= + 1LTAi,t + 2LEVi,t +
3CESi,t + 4LEVi,t + 5TRAINi,t
+ i,t ...(1)
Corporate Governance
As the objective of this study is to in-vestigate the role of corporate governance (represented by GOV in the following for-mulae) in explaining the performance of a training and development policy, this study employed the corporate governance score to represent the level of corporate governance
of a firm. The score is calculated from four important dimensions, which are the board’s structure, function, compenzation policy, and shareholder rights. Furthermore, it measures a firm’s systems and processes, which ensure that its board members and executive act in the best interest of its long term sharehold-ers through its best management practices. Note that the higher the corporate governance score is, the better a firm performs its corpo-rate governance. The data is retrieve from the Asset4 database.
Firstly, this research investigates the role of corporate governance on the firms’ per-formance. The model is as Equation 3.
Value= + 1LTAi,t + 2OISi,t +
3CESi,t + 4LEVi,t +
5GOVi,t + i,t ...(3) Then, it proceeds to the investigation of the moderating role of corporate gover-nance on the relationship between TDP and firm performance. The model is as equation 4.
Value= + 1LTAi,t + 2OISi,t +
3CESi,t + 4LEVi,t +
5TRAIN*GOVi,t
+ i,t ...(4)
Data
panel data set. Firms with missing data throughout the six year period were excluded too. At the end, the final data covered around 2,436 firms derived from the 6 countries.
The dummy variable is the measurement of TDP, where 1 is for a firm which imple-mented TDP and 0 otherwise. In fact, the database provides the TDP in Yes-No codes to classify and distinguish the firms with TDP and without TDP. Meanwhile, corpo-rate governance’s score is obtained from As-set4, it is calculated based on the 4 main cor-porate governance functions listed earlier. The higher the score, the better the corpo-rate governance is.
This research runs the models by pool-ing the data set country by country. This re-search does not combine it all, or control for the country effect, for two reasons. First, each country has different institutional settings. Pooling the data and adding the country vari-able as controls causes estimation bias. Sec-ond, this research aims to compare the role of TDP on firm performance in each coun-try.
The estimation model is run under a panel regression for each country. The panel data approach allows for assessing changes
in the training and development policy and corporate governance over time, albeit not any significant changes in both the levels over time, and thus produces more reliable esti-mates (see Baltagi 2008). Panel regression controls the correlation between the cross-sectional error term and the predictor vari-ables. It also allows the effect of those time-invariant characteristics to be removed, so it will give a best prediction compared to a cross-sectional analysis or time series analy-sis (Petersen 2009).
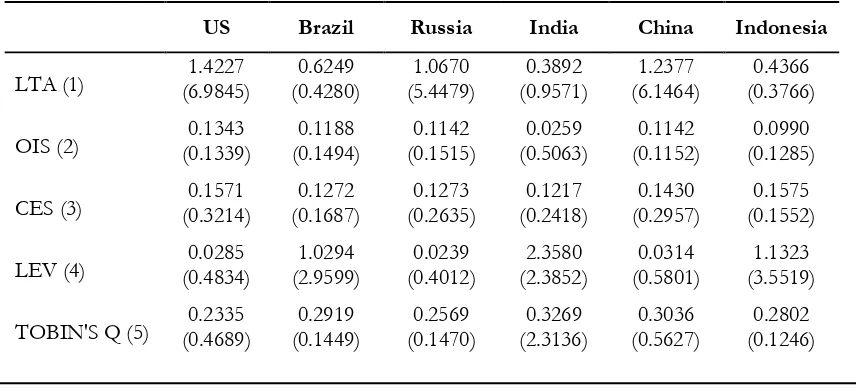
Next, this research ran the full set of diagnostic tests for the panel data following Arrelano and Bond (1991) and Pedroni (2008). It starts with the Wald test for indi-vidual effects, the Breusch Pagan LM test for random effects, the Hausman test for fixed effects, and a full set of dynamic settings of for the panel regression (from AR(1), AR(2), Sargan test, and Hansen test). Indeed, the Classical Linear Regression Model (CLRM ) procedure was estimated preceding those pro-cesses. The diagnostic tests show that the model proposed in this research falls into a fixed effect panel regression. Based on the result of AR(1), AR(2), Sargan test, and Hansen test, it does not have endogeneity, even in lag 1. A two-way fixed effect panel Table 1. Descriptive Statistic Results
US Brazil Russia India China Indonesia
LTA (1) (6.9845) 1.4227 (0.4280) 0.6249 (5.4479) 1.0670 (0.9571) 0.3892 (6.1464) 1.2377 (0.3766) 0.4366
OIS (2) (0.1339) 0.1343 (0.1494) 0.1188 (0.1515) 0.1142 (0.5063) 0.0259 (0.1152) 0.1142 (0.1285) 0.0990
CES (3) (0.3214) 0.1571 (0.1687) 0.1272 (0.2635) 0.1273 (0.2418) 0.1217 (0.2957) 0.1430 (0.1552) 0.1575
LEV (4) (0.4834) 0.0285 (2.9599) 1.0294 (0.4012) 0.0239 (2.3852) 2.3580 (0.5801) 0.0314 (3.5519) 1.1323
US Brazil Russia India China Indonesia
ROA (6) (0.3571) 0.1982 (0.2152) 0.2378 (0.2632 ) 0.2220 (0.8518) 0.2180 (0.3352) 0.2676 (1.0078) 0.2478
Satterthwaite–Welch's t-test
(1)-(2) (0.7890) 0.0804 0.5949(0.0010) *** 0.8740(0.0000) *** (0.0230) 0.231** (0.0620) 0.7100* 0.4176(0.0061) ***
(1)-(3) 0.8857(0.0000) *** 0.3844(0.0150) ** (0.0380) 0.2986** (0.5080) 0.0716 1.22610.0000 *** 1.29770.0000 ***
(1)-(4) (0.0110) 0.0769** 0.0275(0.0450) ** 0.1578(0.0080) *** 0.1407(0.0103) ** 0.0693(0.0135) ** 0.0477(0.0358) **
(1)-(5) 0.0334(0.0429) ** (0.1660) 0.0590 (0.0686) 0.0265 * (0.0940) 0.0737 * 0.0501(0.0253) ** (0.0575) 0.0208 *
(1)-(6) (0.0545)1.0579 * (0.0776) 0.7686 * (0.0738) 1.3286 * (0.0592) 0.2894 * (0.2380) (2.3865) (2.0972) (0.2994)
(2)-(3) 2.4254(0.0030) *** (4.6514) (0.4240) 6.2868(0.0160) ** 0.2044(0.0400) ** (0.0520) 3.1969 * 5.7192(0.0050) ***
(2)-(4) (0.7890) 0.0804 0.5949(0.0010) *** 0.8740(0.0000) *** 0.2311(0.0230) ** (0.0620) 0.7100 * 0.4176(0.0061) ***
(2)-(5) 0.9034(0.0002) *** 0.3959(0.0225) ** 0.3105(0.0002) *** (0.5080) 0.0737 1.2874(0.0030) *** 1.3496(0.0000) ***
(2)-(6) 0.0723(0.0220) ** 0.0267(0.0285) ** 0.1468(0.0050) *** 0.1351(0.0104) ** 0.0658(0.0194) ** 0.0448(0.0000) ***
(3)-(4) 0.0354(0.0429) ** (0.0575) 0.0608 * (0.0904) 0.0270 * (0.0528) 0.0789 * 0.0521(0.0400) ** 0.0218(0.0133) **
(3)-(5) (0.1012) 1.0674 (0.0520) 0.7747 * (0.0821) 1.3406 * (0.0738) 0.2923 * 2.6252(0.0000) *** 2.2650(0.0000) ***
(3)-(6) (0.1301) 1.0516 (0.0766) 0.7486 * 1.3073(0.0000) *** (0.0776) 0.2790 * (0.4230) 2.2767 1.9798(0.0150) **
(4)-(5) 2.6437(0.0000) *** (0.3392) 5.0235 6.7269(0.0400) ** (0.1664) 0.2228 (0.2664) 3.4527 6.1195(0.0381) **
(4)-(6)
2.4375
*** 4.6793*** 6.3308 ** 0.2060 3.2257 6.2911***
(0.0000) (0.0000) (0.0170) (0.2380) (0.2994) (0.0070)
Table 1. Continued
regression is employed to make the model more robust.
Results and Discussion
Descriptive Results
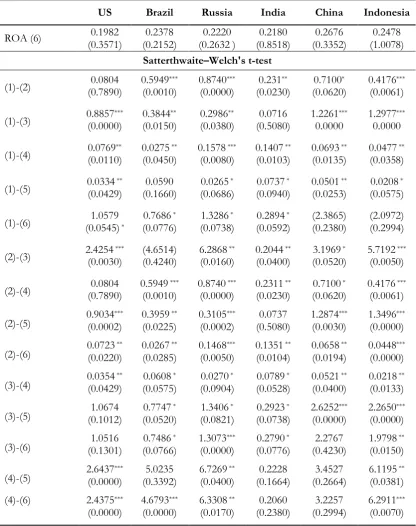
Table 1 describes the summary of sta-tistic for this research’s sample of 2,346 firms across the six countries (US, Brazil, Russia, India, China, and Indonesia) and seven peri-ods (2007-2013). The mean values were cal-culated for each variable to facilitate com-parison among the variables. These mean values are provided, including their standard deviation values, which are depicted in pa-renthesis. This research also provides the sta-tistical test for the difference in the mean value for each variable across the six vari-ables. As expected, firms in the US have the best financial ratios among all six countries. Then comes Russia. This reveals that devel-oped countries such the US and Russia (mem-bers of the D-8) have relatively better per-formance as compared to those emerging markets such as Brazil, India, China, and In-donesia.
Even though the panel data does not strongly pre-requisite normality, it reports low values for the standard deviation and good values for the mean, which implies that there is no such type-1 error in this data. Further-more, the t-test indicates that there are sig-nificant differences among the variables, meaning each value of each variable has a different indicator. This illustrates that each financial ratio has a different financial mea-sure. This is also important as it differenti-ates the performance measures between Tobin’s Q and ROA. The findings in Table 1 imply that there is no such cross-measure from each variable (multicollinearity) and also there is no such autocorrelation.
Baseline Results
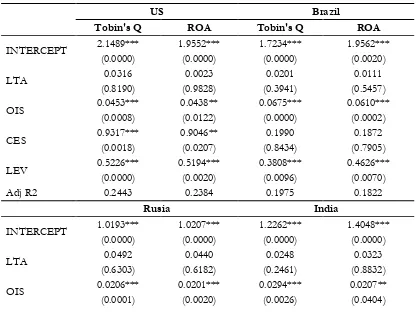
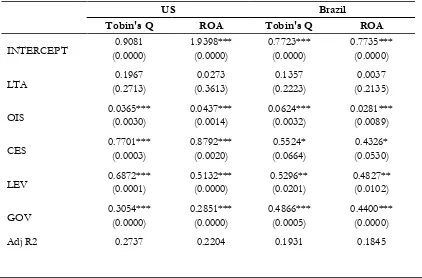
Table 2 presents the panel regression results for the baseline model (Model 1). With short panel data (the number of firms is sig-nificantly larger than the number of years), it reports the probability values based on White robust standard errors that control for heteroscedasticity errors, as well as firm clus-tering, year clusclus-tering, and the period effect which will induce the within-firm serial cor-relation error structure. Basically the coeffi-cient estimated for all the variables is consis-tent in sign and magnitude across the various specifications, except for the significance level of several control variables in certain countries, due to country characteristics (e.g. developed vs developing or labor-intensive vs technology-intensive). This research starts with the US, which is the largest and most developed market in this sample. As ex-pected, all the four control variables basically contribute positively to the firms’ perfor-mance and they are statistically significant except for the size (LTA). Meanwhile, the adjusted R2 of the model is 24.43 percent (Tobin’s Q model) and 23.84 percent (ROA model) which is the largest compared to the other markets. The baseline model estimation for US shows there is no different conclusion between Tobin’s Q model and the ROA model. It then continues to Brazil’s results where the adjusted R2 is good enough, 19.75 percent for Tobin’s Q model and 18.22 per-cent for the ROA model. The control vari-ables of Brazil were slightly different from the US results. Only profitability (OIS) and leverage (LEV) contributed significantly to Brazilian firms’ performance.
variable contributed significantly to the firms’ performance, which is profitability. The rest, such as size, leverage, and growth, failed to influence the performance of the listed firms in Russia. In the Indian context, the adjusted R2 also indicates the model is good enough in terms of the predictors’ variance. The val-ues are 16.61 percent and 18.26 percent for Tobin’s Q model and the ROA model, respec-tively. The control variables contribute posi-tively to the performance. However, similar to the US model’s results, it is only size that does not influence the performance signifi-cantly. Profitability, growth, and leverage are statistically significant at the 5 percent level for the firms’ performance. This is the same conclusion with China and Indonesia. In
China’s context, all the control variables ex-cept size contributed significantly to the firms’ performance. It is noteworthy that those models are good enough where the ad-justed R2s are 20.19 percent and 17.83 per-cent for the Tobin’s Q and ROA respectively. In the Indonesian context, where the adjusted R2s are also good enough (17.11% for Tobin’s Q and 16.93 for ROA), profitability, growth, and leverage have also influenced the performance of the firms significantly, at the 5 percent level. Size, on other hand, fails to have a statistically significant role in the firms’ performance. The baseline model re-sults are consistent with previous research, such as that by Black et al (2006) and Masulis et al (2012)
Table 2. Estimates of Baseline Model
US Brazil
Tobin's Q ROA Tobin's Q ROA
INTERCEPT 2.1489*** (0.0000) 1.9552*** (0.0000) 1.7234*** (0.0000) 1.9562*** (0.0020)
LTA (0.8190) 0.0316 (0.9828) 0.0023 (0.3941) 0.0201 (0.5457) 0.0111
OIS 0.0453*** (0.0008) 0.0438** (0.0122) 0.0675*** (0.0000) 0.0610*** (0.0002)
CES 0.9317*** (0.0018) 0.9046** (0.0207) (0.8434) 0.1990 (0.7905) 0.1872
LEV 0.5226*** 0.5194*** 0.3808*** 0.4626***
(0.0000) (0.0020) (0.0096) (0.0070)
Adj R2 0.2443 0.2384 0.1975 0.1822
Rusia India
INTERCEPT 1.0193*** 1.0207*** 1.2262*** 1.4048***
(0.0000) (0.0000) (0.0000) (0.0000)
LTA 0.0492 0.0440 0.0248 0.0323
(0.6303) (0.6182) (0.2461) (0.8832)
The Role of Training and
Development
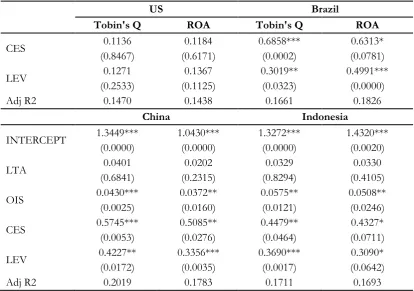
This research further estimated Model (2) to examine the role of the Training and Development Policy (TDP) on the firms’ per-formance. Table 3 contains the model’s re-sults for the performance of TDP from the six countries. Those estimations with two dif-ferent performance measurements have the estimation of R2, which range from 12 per-cent to 28 perper-cent.
The estimation of Model (2) shows that both Tobin’s Q and ROA are positively re-lated to TDP. In the context of the US, this
research finds the TDP contributed positively to the firms’ performance. The coefficient values are 0.5527 and 0.4278 for Tobin’s Q and ROA, respectively. TDP is also statisti-cally significant for the firms’ performance. This means imposing TDP might help firms in the US to improve their performance, not only based on their accounting performance, such as ROA, but also their market-based performance, such as Tobin’s Q. It arrived at the same conclusion for the Brazilian con-text. TDP contributed positively and signifi-cantly to the performance of Brazilian firms. The coefficient values are 0.5314 and 0.4919 for Tobin’s Q and ROA. Again, this indicates
US Brazil
Tobin's Q ROA Tobin's Q ROA
CES (0.8467) 0.1136 (0.6171) 0.1184 0.6858*** (0.0002) (0.0781) 0.6313*
LEV (0.2533) 0.1271 (0.1125) 0.1367 0.3019** (0.0323) 0.4991*** (0.0000)
Adj R2 0.1470 0.1438 0.1661 0.1826
China Indonesia
INTERCEPT 1.3449*** 1.0430*** 1.3272*** 1.4320***
(0.0000) (0.0000) (0.0000) (0.0020)
LTA 0.0401 0.0202 0.0329 0.0330
(0.6841) (0.2315) (0.8294) (0.4105)
OIS 0.0430*** 0.0372** 0.0575** 0.0508**
(0.0025) (0.0160) (0.0121) (0.0246)
CES 0.5745*** (0.0053) 0.5085** (0.0276) 0.4479** (0.0464) (0.0711) 0.4327*
LEV 0.4227** (0.0172) 0.3356*** (0.0035) 0.3690*** (0.0017) (0.0642) 0.3090*
Adj R2 0.2019 0.1783 0.1711 0.1693
The regression is performed using two different measures of performance: Tobin’s Q and ROA. The figure stated are the coefficient values, except numbers in parentheses which are p-value. The dependent variable is firm performance. The control variables are relative size (RLTA), relative profitability (ROIS), relative growth (RCES), and relative leverage (RLEV). The model is as follow: Value1LTAi,t 2OISi,t 3CESi,t 4LEVi,t i,t
that TDP might improve the firms’ perfor-mance in Brazil.
This research then looked at the other countries such as Russia, India, China, and Indonesia. The conclusion remains the same; TDP has played an important role in firm performance. In Russia, TDP has a good magnitude of influence on the firms’ perfor-mance where the coefficients estimated are 0.4497 and 0.4250 for the Tobin’s Q model and ROA model, respectively. However, firms in India are not significantly associated with TDP. This is the same conclusion with firms in China. Lastly, firms in Indonesia show the TDP’s contribution to the firms’ performance is statistically significant, with coefficient values of 0.4026 and 0.4840 for Tobin’s Q model and the ROA model, respec-tively.
Interestingly, the coefficients estimated for the control variables changed their sig-nificant role in performance after TDP was introduced into the model, except in the con-text of the US. This research finds that the estimated coefficients of size, profitability, growth, and leverage has lost its contribution in association with firm performance. For instance, the leverage does not play a signifi-cant role on firm performance in Brazil in the research sample. Only profitability has a sig-nificant contribution to both Tobin’s Q and ROA. This is also the same for Indonesia. The growth and leverage have lost their signifi-cant contribution to firm performance, so only profitability plays an important role in Indonesian firms’ performance. Interesting findings are found in the context of Russia, India, and China. All the control variables that once made significant contributions to firm performance have turned out to not be sig-nificant when TDP was introduced in the model. For example Russia, where the baseline model’s results show a significant
contribution by profitability. Yet, Table 3 re-ports profitability is not a significant predic-tor of firm performance in Russia when TDP is introduced. The same conclusion goes for India and China. Profitability, growth, and leverage contributed significantly to firm per-formance in those 2 countries. However, af-ter TDP was introduced, there was no con-trol variable that had a significant influence on firm performance. In the context of the US, the role of control variables towards firm performance is a stronghold where all the control variables contribute positively and significantly to firm performance, except for size.
Note that this research finds another interesting result. The coefficients estimated for size and growth in all the countries ex-cept for the US have changed their sign; which is inconsistent with the baseline model. The coefficients of LTA (size) and CES (growth) change from positive to negative. This means that TDP may positively contributed to per-formance, however, the economy of scale such as size, profitability, growth, and lever-age have new conclusion.
It is possible, however, that these changes are caused by the cost of the TDP, or good cor-porate governance. Therefore, the research was extended to explore the role of corpo-rate governance in this matter.
The Role of Corporate
Governance
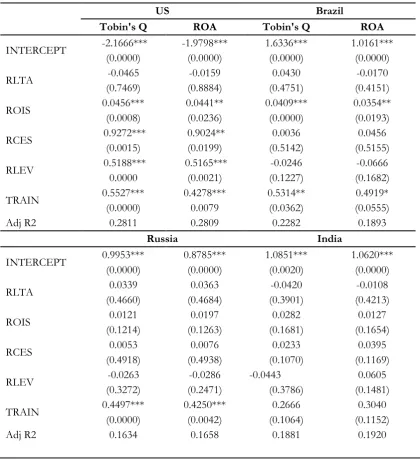
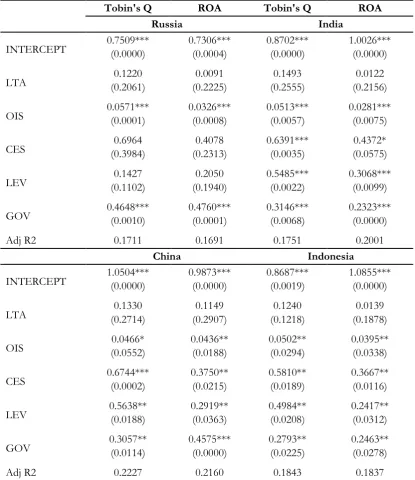
The regression results for the role of corporate governance (GOV) in each of the
six countries using Model (3) estimations are reported in Table 4. For the US firms, this research finds a corporate governance role of 0.3054 on the firms’ Tobin’s Q score and 0.2851 for their ROA. This role is statisti-cally significant at the 5 percent level. This means the result is in line with the literature addressing the role of corporate governance on better firm performance in the context of the US (e.g. Shleifer and Vishny 1997; Brown and Caylor 2006; Bhagat and Bolton 2008).
US Brazil
Tobin's Q ROA Tobin's Q ROA
INTERCEPT -2.1666*** -1.9798*** 1.6336*** 1.0161***
(0.0000) (0.0000) (0.0000) (0.0000)
RLTA -0.0465 -0.0159 0.0430 -0.0170
(0.7469) (0.8884) (0.4751) (0.4151)
ROIS 0.0456*** (0.0008) 0.0441** (0.0236) 0.0409*** (0.0000) 0.0354** (0.0193)
RCES 0.9272*** (0.0015) 0.9024** (0.0199) (0.5142) 0.0036 (0.5155) 0.0456
RLEV 0.5188*** 0.0000 0.5165*** (0.0021) (0.1227) -0.0246 (0.1682) -0.0666
TRAIN 0.5527*** (0.0000) 0.4278*** 0.0079 0.5314** (0.0362) (0.0555) 0.4919*
Adj R2 0.2811 0.2809 0.2282 0.1893
Russia India
INTERCEPT 0.9953*** (0.0000) 0.8785*** (0.0000) 1.0851*** (0.0020) 1.0620*** (0.0000)
RLTA (0.4660) 0.0339 (0.4684) 0.0363 (0.3901) -0.0420 (0.4213) -0.0108
ROIS (0.1214) 0.0121 (0.1263) 0.0197 (0.1681) 0.0282 (0.1654) 0.0127
RCES 0.0053 0.0076 0.0233 0.0395
(0.4918) (0.4938) (0.1070) (0.1169)
RLEV -0.0263 -0.0286 -0.0443 0.0605
(0.3272) (0.2471) (0.3786) (0.1481)
TRAIN 0.4497*** 0.4250*** 0.2666 0.3040
(0.0000) (0.0042) (0.1064) (0.1152)
Adj R2 0.1634 0.1658 0.1881 0.1920
Table 3. Continued
The regression is performed using two different measures of performance: Tobin’s Q and ROA. The figure stated are the coefficient values, except numbers in parentheses which are p-value. The dependent variable is firm performance. The control variables are relative size (RLTA), relative profitability (ROIS), relative growth (RCES), and relative leverage (RLEV). The main independent variables are Training and Development Policy. The model is as follow:
t i t i t
i t
i t
i t
i OIS CES LEV TRAIN
LTA
Value1 , 2 , 3 , 4 , 5 ,, ,
Table 4. Estimates of Corporate Governance and Firm Performance
US Brazil
Tobin's Q ROA Tobin's Q ROA
INTERCEPT (0.0000) 0.9081 1.9398*** (0.0000) 0.7723*** (0.0000) 0.7735*** (0.0000)
LTA (0.2713) 0.1967 (0.3613) 0.0273 (0.2223) 0.1357 (0.2135) 0.0037
OIS 0.0365*** (0.0030) 0.0437*** (0.0014) 0.0624*** (0.0032) 0.0281*** (0.0089)
CES 0.7701*** (0.0003) 0.8792*** (0.0020) (0.0664) 0.5524* (0.0530) 0.4326*
LEV 0.6872*** (0.0001) 0.5132*** (0.0000) 0.5296** (0.0201) 0.4827** (0.0102)
GOV 0.3054*** (0.0000) 0.2851*** (0.0000) 0.4866*** (0.0005) 0.4400*** (0.0000)
Adj R2 0.2737 0.2204 0.1931 0.1845
Tobin's Q ROA Tobin's Q ROA
China Indonesia
INTERCEPT 1.2478*** 1.0106*** 1.7356*** 1.8095***
(0.0000) (0.0000) (0.0000) (0.0000)
RLTA -0.0480 -0.0186 0.0345 -0.0287
(0.3841) (0.4135) (0.4666) (0.4034)
ROIS 0.0274 0.0143 0.0291** 0.0310*
(0.1224) (0.1811) (0.0470) (0.0846)
RCES 0.0194 0.0472 0.0058 0.0574
(0.1221) (0.1337) (0.1268) (0.1248)
RLEV (0.1471) -0.0404 (0.1017) 0.0682 (0.1429) -0.0268 (0.1327) 0.0784
TRAIN (0.1261) 0.3140 (0.1567) 0.3048 0.4026** (0.0275) 0.4840** (0.0146)
Tobin's Q ROA Tobin's Q ROA
Russia India
INTERCEPT 0.7509*** (0.0000) 0.7306*** (0.0004) 0.8702*** (0.0000) 1.0026*** (0.0000)
LTA (0.2061) 0.1220 (0.2225) 0.0091 (0.2555) 0.1493 (0.2156) 0.0122
OIS 0.0571*** (0.0001) 0.0326*** (0.0008) 0.0513*** (0.0057) 0.0281*** (0.0075)
CES (0.3984) 0.6964 (0.2313) 0.4078 0.6391*** (0.0035) (0.0575) 0.4372*
LEV (0.1102) 0.1427 (0.1940) 0.2050 0.5485*** (0.0022) 0.3068*** (0.0099)
GOV 0.4648*** (0.0010) 0.4760*** (0.0001) 0.3146*** (0.0068) 0.2323*** (0.0000)
Adj R2 0.1711 0.1691 0.1751 0.2001
China Indonesia
INTERCEPT 1.0504*** (0.0000) 0.9873*** (0.0000) 0.8687*** (0.0019) 1.0855*** (0.0000)
LTA (0.2714) 0.1330 (0.2907) 0.1149 (0.1218) 0.1240 (0.1878) 0.0139
OIS (0.0552) 0.0466* 0.0436** (0.0188) 0.0502** (0.0294) 0.0395** (0.0338)
CES 0.6744*** (0.0002) 0.3750** (0.0215) 0.5810** (0.0189) 0.3667** (0.0116)
LEV 0.5638** (0.0188) 0.2919** (0.0363) 0.4984** (0.0208) 0.2417** (0.0312)
GOV 0.3057** (0.0114) 0.4575*** (0.0000) 0.2793** (0.0225) 0.2463** (0.0278)
Adj R2 0.2227 0.2160 0.1843 0.1837
Table 4. Continued
The regression is performed using two different measures of performance: Tobin’s Q and ROA. The figure stated are the coefficient values, except numbers in parentheses which are p-value. The dependent variable is firm performance. The control variables are relative size (RLTA), relative profitability (ROIS), relative growth (RCES), and relative leverage (RLEV). The main independent variables are Corporate Governance. The model is as follow
t i t i t
i t
i t
i t
i OIS CES LEV GOV
LTA
This research’s estimation also finds a signifi-cant role by corporate governance in Brazil-ian firms’ performance. Corporate governance has contributed positively, with scores up to 0.4866 and 0.4400 for the Tobin’s Q and ROA of the firms in Brazil. This is consis-tent with the previous works of Klapper and Love (2004), da Silva and Leal (2005), and Estrin and Prevezer (2011) who addressed the important of corporate governance in in-ducing firm performance in Brazil.
This research continued its investigation into Russia, India, China and Indonesia. Firms in Russia indicated a significant role for corporate governance on firm perfor-mance. The estimated coefficient values are 0.4648 for Tobin’s Q and 0.4760 for ROA. This is in line with prior research in Russia, such as that undertaken by Black (2001), Klapper and Love (2004), Renders et al. (2010) and Estrin and Prevezer (2011). In the Indian context, it also found a significant con-tribution by corporate governance on firm performance, where the values are 0.3146 and 0.2323 for Tobin’s Q model and ROA model, respectively. Jackling and Johl (2009), and Balasubramanian et al. (2010), and Estrin and Prevezer (2011) arrived at the same conclu-sion with their research findings, in which they addressed the importance of corporate gov-ernance on Indian firms’ performance. The positive and significant role of corporate gov-ernance in firms’ performance is also found in China. The listed firms in China showed a correlation between corporate governance and the firms’ performance, where the esti-mated coefficient values are 0.3057 and 0.4575 for Tobin’s Q model and ROA model, respectively. This is consistent with the pre-vious results of Hu et al. (2010), Sami et al. (2011), Estrin and Prevezer (2011), and
Masulis et al. (2012). Lastly, there is also a positive and significant contribution by cor-porate governance to firm performance in Indonesia. The magnitude of this influence is also strong, because the estimated coeffi-cient values are 0.2793 for Tobin’s Q and 0.2463 for ROA. This is in line with the pre-vious research of Mitton (2002), Klapper and Love (2004), Ramdani and Wittenloostuijn (2010), and Prabowo and Simpson (2011) which concluded that there is a significant relationship between corporate governance and Indonesian firms’ performance.
The Moderating Effect of
Corporate Governance
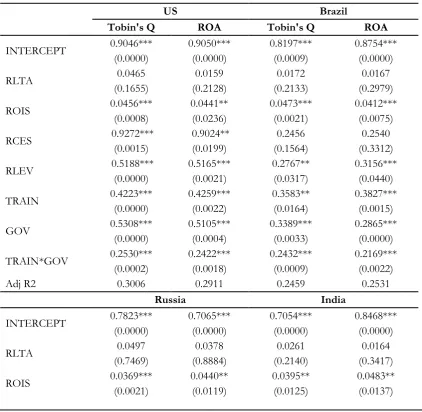
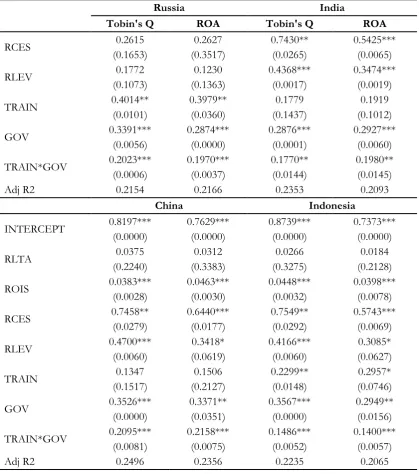
Table 5 reports the estimates of firm performance with TDP, considering the cor-porate governance of the firms. In Model (1), only the baseline model of firm performance is addressed. Then this research modifies it into Model (2), where TDP is introduced, and Model (3), where corporate governance is introduced. Both models of Tobin’s Q and ROA conclude that the main predictors, ei-ther TDP or corporate governance, of firm performance in the six-countries are statisti-cally significant. However, a negative sign and/or an insignificant role for the baseline variables are found in certain countries. This intriguing finding makes us want to investi-gate the interaction between those two main predictors further. This research then hypoth-esized that there is a moderating role by cor-porate governance on the relationship be-tween TDP and firm performance. This re-search believes that a firm with better corpo-rate governance might have different results for its TDP-firm performance association, as compared to a firm with poor corporate gov-ernance.
This research proceeded to add an in-teraction term between TDP and corporate governance to investigate whether the impact of TDP on firm performance differs across different corporate governance levels. This research also controls for the firms’ unobserv-able characteristics, such as differences in their managerial characteristics and corporate cultures by adding a 2-way firm-period fixed effect and reporting the results of Model (4) in Table 5. Note that the adjusted R2 sur-mises the model has a good goodness of fit. The estimates of the baseline variables are the same as the conclusion reported in Table 2. This does not reflect any
inconsis-tencies with Model (1), Model (2), Model (3) and Model (4) because with the added inter-active terms, this coefficient now represents different conclusions. It is measuring the ef-fect of TDP for the different levels of cor-porate governance of the firms. The significances of the estimates for TDP (5TRAINi,t) in Model (4) revealed that in the
performance of those firms which have a training and development policy. Moreover, the significance of the estimates for corpo-rate governance (6GOVi,t) in Model (4) also
reveals that for the performance of firms which have conducted corporate governance. On the other hand, the interactive terms ex-plain the moderating effect of the model.
After the interactive term is introduced, the baseline variables have a consistent sign and significance with Model (1). The size of the firm is still not significant in associating it with the firms’ performance. However, the profitability has regained a significant role in the firms’ performance. These remarks are found in all the countries in our study. The growth of firms has also contributed posi-tively and is statistically significant for the firms’ performance in 4 countries, which are the US, India, China, and Indonesia. This is totally different to the findings from the esti-mations of Model (2), where some countries even suffered discounted performance in their growth. Another positive and significant con-tribution comes from profitability on the firms’ performance in all the countries, ex-cept Russia.
0.4223, 0.3583, 0.4014 and 0.2299 in the context of the US, Brazil, Russia and Indo-nesia, respectively. Meanwhile, the estimated coefficient values of TDP (5TRAINi,t)
to-wards ROA are 0.4259, 0.3827, 0.3979 and 0.2957 in the context of US, Brazil, Russia and Indonesia, respectively. Furthermore, corporate governance reveals the same con-clusion, thus, India and China have been in-cluded as their firms have strong and signifi-cant associations with corporate governance. The estimated coefficient values of corpo-rate governance () are 0.5308, 0.3389, 0.3391, 0.2876, 0.3526 and 0.3567 in the context of Tobin’s Q for the US, Brazil, Russia, India, China and Indonesia, respectively. Mean-while, the estimated coefficient values of corporate governance (6GOVit) are 0.5105,
0.2865, 0.2874, 0.2927, 0.3371 and 0.2949 in the context of ROA in the US, Brazil, Rus-sia, India, China and IndoneRus-sia, respectively. The results use the interactive term (7Train*GOVit) indicating that different
lev-els of corporate governance may result with the different impacts of TDP on the firms’ performance. The research’s explanation starts with the US firms, where the interac-tive term is posiinterac-tive and significant. The es-timated coefficient values are 0.2530 and 0.2422 for Tobin’s Q and ROA, respectively. Similar to the US context, firms in Brazil also showed a significant association between the interactive terms and the firms’ performance, where the estimated coefficient values are 0.2432 and 0.2169 for Tobin’s Q and ROA, respectively. This conclusion about the inter-active terms and firms’ performance is also found in Russia, India, China, and Indonesia, with different magnitudes of the estimated coefficient. In Russia, the association is esti-mated with coefficient values of 0.2023 (Tobin’s Q model) and 0.1970 (ROA model).
Meanwhile, firms in India have the estimated coefficient values of 0.1770 and 0.1980 for Tobin’s Q and ROA, respectively. The esti-mated coefficient values of the interactive terms are 0.2095 (Tobin’s Q model) and 0.2158 (ROA model) in China. Lastly, Indo-nesian firms’ performance is significantly in-duced by the interactive terms with values of 0.1486 (Tobin’s Q model) and 0.1400 (ROA model). In short, the interactive terms of TDP and corporate governance have sig-nificant influence on both firm performance, Tobin’s Q and ROA, in the six countries over a six year period.
Therefore, this research surmised that there is a moderating role of corporate gov-ernance on the relationship between TDP and firm performance. The positive sign and in-creasing R2 from the interactive terms indi-cated the moderating role has a good effect on the relationship. The changes of the sign of the baseline variables from negative to positive or from not-significant to significant implied another role for corporate governance in the relationship. This means firms with good corporate governance might manage their TDP well and will have relatively bet-ter performance compared to firms with poor corporate governance. Another implication of this research is that good corporate gover-nance not only strengthens the TDP-firm performance relationship, but may also use training and development in a positive man-ner by not having an inverse relationship be-tween the size of the firm and the firm’s performance, or the firm’s growth and its performance.
the firms there. Firms in India and China will see no effect; no matter how much these firms spend on their employees’ training and de-velopment or no matter how intense the in-vestment of the firms in training and devel-opment is. Yet, firms with good corporate governance may produce different results. The significance of the sign of the interac-tive terms indicates that firms in India and China may put the reason for their firms’ per-formance down to their TDP if the firms have good levels of corporate governance.
Robustness Test: Using a Dummy
Variable of Corporate
Governance
The results reported in the previous sec-tion suggested that corporate governance may influence TDP in obtaining good performance among firms. So far, it has not been explicitly controlled for good levels of corporate gov-ernance. To the extent that good or bad cor-porate governance may also affect the esti-mated value of Model (4), this research
in-Table 5. Estimates of Training and Development Policy, Corporate Governance, and Firm Performance
US Brazil
Tobin's Q ROA Tobin's Q ROA
INTERCEPT 0.9046*** 0.9050*** 0.8197*** 0.8754***
(0.0000) (0.0000) (0.0009) (0.0000)
RLTA 0.0465 0.0159 0.0172 0.0167
(0.1655) (0.2128) (0.2133) (0.2979)
ROIS 0.0456*** (0.0008) 0.0441** (0.0236) 0.0473*** (0.0021) 0.0412*** (0.0075)
RCES 0.9272*** (0.0015) 0.9024** (0.0199) (0.1564) 0.2456 (0.3312) 0.2540
RLEV 0.5188*** (0.0000) 0.5165*** (0.0021) 0.2767** (0.0317) 0.3156*** (0.0440)
TRAIN 0.4223*** (0.0000) 0.4259*** (0.0022) 0.3583** (0.0164) 0.3827*** (0.0015)
GOV 0.5308*** (0.0000) 0.5105*** (0.0004) 0.3389*** (0.0033) 0.2865*** (0.0000)
TRAIN*GOV 0.2530*** (0.0002) 0.2422*** (0.0018) 0.2432*** (0.0009) 0.2169*** (0.0022)
Adj R2 0.3006 0.2911 0.2459 0.2531
Russia India
INTERCEPT 0.7823*** (0.0000) 0.7065*** (0.0000) 0.7054*** (0.0000) 0.8468*** (0.0000)
RLTA (0.7469) 0.0497 (0.8884) 0.0378 (0.2140) 0.0261 (0.3417) 0.0164
ROIS 0.0369*** 0.0440** 0.0395** 0.0483**
Table 5. Continued
The regression is performed using two different measures of performance: Tobin’s Q and ROA. The figure stated are the coefficient values, except numbers in parentheses which are p-value. The dependent variable is firm performance. The control variables are relative size (RLTA), relative profitability (ROIS), relative growth (RCES), and relative leverage (RLEV). The main independent variables are Training and Development Policy (TDP), and Corporate Governance. The innovation in this research is the interactive terms between TDP and corporate governance as this research aims to investigate the moderating role of corporate governance on the relationship between TDP and Firm performance. The model is as follow: Value1LTAi,t2OISi,t3CESi,t4LEVi,t5Traini,t6GOVi,t7Train*GOVi,ti,t
Russia India
Tobin's Q ROA Tobin's Q ROA
RCES (0.1653) 0.2615 (0.3517) 0.2627 0.7430** (0.0265) 0.5425*** (0.0065)
RLEV (0.1073) 0.1772 (0.1363) 0.1230 0.4368*** (0.0017) 0.3474*** (0.0019)
TRAIN 0.4014** 0.3979** 0.1779 0.1919
(0.0101) (0.0360) (0.1437) (0.1012)
GOV 0.3391*** 0.2874*** 0.2876*** 0.2927***
(0.0056) (0.0000) (0.0001) (0.0060)
TRAIN*GOV 0.2023*** 0.1970*** 0.1770** 0.1980**
(0.0006) (0.0037) (0.0144) (0.0145)
Adj R2 0.2154 0.2166 0.2353 0.2093
China Indonesia
INTERCEPT 0.8197*** (0.0000) 0.7629*** (0.0000) 0.8739*** (0.0000) 0.7373*** (0.0000)
RLTA (0.2240) 0.0375 (0.3383) 0.0312 (0.3275) 0.0266 (0.2128) 0.0184
ROIS 0.0383*** (0.0028) 0.0463*** (0.0030) 0.0448*** (0.0032) 0.0398*** (0.0078)
RCES 0.7458** (0.0279) 0.6440*** (0.0177) 0.7549** (0.0292) 0.5743*** (0.0069)
RLEV 0.4700*** (0.0060) (0.0619) 0.3418* 0.4166*** (0.0060) (0.0627) 0.3085*
TRAIN (0.1517) 0.1347 (0.2127) 0.1506 0.2299** (0.0148) (0.0746) 0.2957*
GOV 0.3526*** (0.0000) 0.3371** (0.0351) 0.3567*** (0.0000) 0.2949** (0.0156)
TRAIN*GOV 0.2095*** (0.0081) 0.2158*** (0.0075) 0.1486*** (0.0052) 0.1400*** (0.0057)
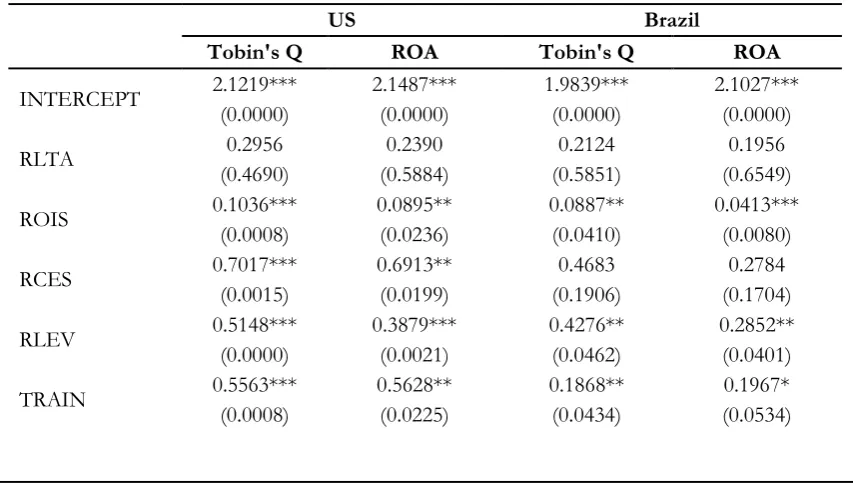
vestigates further by establishing a dummy variable for the level of corporate gover-nance. Table 6 depicts different estimates of Model (4) where the corporate governance index is modified into a binary dummy vari-able.
The dummy variable is created by us-ing the followus-ing procedure. First, the mean is taken after sorting out the governance in-dex from the highest to the lowest in each year, according to each country. Then, those firms with a corporate governance index higher than the average value are given 1 and 0 otherwise. The data set of the corporate governance index is replaced by this new dummy variable data. After that, it proceeded by re-employing Model (4).
The results showed the indifferent con-clusions except for the control variables. Prof-itability and leverage contributed positively and were statistically significant to the firms’ performance in all countries, including Bra-zil and Russia. Meanwhile, India, China, and Indonesia lost the growth effect on the firms’
performance. Size still does not have any sig-nificant effect on the firms’ performance.
The interactive terms for new corporate governance arrived at the same conclusion; there is a moderating role by corporate gov-ernance on the relationship between TDP and the firms’ performance, as reported in Table 6.This study also found that within each country, the role of corporate governance differed. Based on the estimated coefficient, the moderating role of corporate governance is significantly higher for US firms. Interest-ingly, there are no consistent results between Tobin’s Q and ROA when this research used these new interactive terms. This research believes this is due to the variance of the in-dexation of the corporate governance’s level, or in other words, a statistical problem. An-other issue that may arise in this research is that there are no exact corporate governance items that may enhance the TDP-firm per-formance link. For instance, board structure and compenzation policy may have different impacts on the relationship. The researchers leave this issue for future research.
Table 6. Robustness Test by Using Binary Variable of Corporate Governance
US Brazil
Tobin's Q ROA Tobin's Q ROA
INTERCEPT 2.1219*** (0.0000) 2.1487*** (0.0000) 1.9839*** (0.0000) 2.1027*** (0.0000)
RLTA (0.4690) 0.2956 (0.5884) 0.2390 (0.5851) 0.2124 (0.6549) 0.1956
ROIS 0.1036*** 0.0895** 0.0887** 0.0413***
(0.0008) (0.0236) (0.0410) (0.0080)
RCES 0.7017*** 0.6913** 0.4683 0.2784
(0.0015) (0.0199) (0.1906) (0.1704)
RLEV 0.5148*** 0.3879*** 0.4276** 0.2852**
(0.0000) (0.0021) (0.0462) (0.0401)
TRAIN 0.5563*** 0.5628** 0.1868** 0.1967*
US Brazil
Tobin's Q ROA Tobin's Q ROA
GOV 0.0558*** 0.0627*** 0.0120*** 0.0175***
(0.0000) (0.0001) (0.0005) (0.0000)
TRAIN*GOV 0.0734*** 0.0403*** 0.0474*** 0.0478***
(0.0000) (0.0002) (0.0002) (0.0000)
Adj R2 0.1530 0.1244 0.0774 0.0922
Russia India
INTERCEPT 2.0397*** (0.0000) 1.8928*** (0.0020) 2.0047*** (0.0000) 1.7772*** (0.0000)
RLTA (0.7084) 0.2088 (0.7126) 0.2083 (0.5704) 0.1864 (0.6656) 0.1808
ROIS (0.0585) 0.0175* 0.0511** (0.0120) (0.0635) 0.0704* 0.0701*** (0.0078)
RCES (0.1813) 0.1811 (0.1676) 0.3107 (0.1641) 0.5906 (0.1116) 0.3175
RLEV (0.0733) 0.4804* (0.0882) 0.3329* 0.3966** (0.0468) 0.2868*** (0.0031)
TRAIN 0.2364** 0.2616** 0.1751 0.1824
(0.0471) (0.0485) (0.1061) (0.1452)
GOV 0.0196*** 0.0331*** 0.0473*** 0.0496***
(0.0000) (0.0034) (0.0044) (0.0000)
TRAIN*GOV 0.0281*** 0.0187*** 0.0392** 0.0214***
(0.0071) (0.0000) (0.0169) (0.0000)
Adj R2 0.0812 0.0655 0.0945 0.1009
China Indonesia
INTERCEPT 1.8752*** (0.0000) 1.7968*** (0.0000) 1.8948*** (0.0000) 1.9997*** (0.0000)
RLTA (0.5711) 0.2228 (0.6979) 0.2035 (0.5374) 0.1706 (0.5899) 0.2344
ROIS (0.0684) 0.0931* 0.0390** (0.0366) 0.0920** (0.0125) 0.0193** (0.0109)
RCES (0.1476) 0.3211 (0.1106) 0.2754 (0.1629) 0.3462 (0.1082) 0.3466
RLEV 0.3949** (0.0478) 0.3311*** (0.0044) 0.2687** (0.0329) 0.2589** (0.0104)
Results Discussion
This study revealed that a Training and Development Policy (TDP) plays an impor-tant role in firms’ performance, which is con-sistent with previous empirical papers such as those by Storey (2002), Storey (2004), and Kwon and Rupp (2013). Even so, the role of TDP on firm performance is not always true. Particularly, this research discovered that the significant effect of TDP on firm performance is very weak in India and China. Moreover, the literature showed that a firm with good corporate governance may have a better policy-performance association (e.g. Shleifer and Vishny 1997; Kwon and Rupp 2013). Hence, this research continued to investigate further by exploring the mediating role of corporate governance on the TDP and firm performance.
This research followed up on this un-justified explanation by using a corporate governance index. This index consisted of four important dimensions namely, board
structure, board function, compenzation policy, and shareholder rights. Of course, using this index does not explain which di-mension, or dimensions, have an effect on the relationship between TDP and firm per-formance. But at least, this is the best data available and also the best method to reduce the excessive variance, which is a result of having too many predictors, especially the multicollinearity, heteroscedasticity, and autocorrelation issues.
The results demonstrated interesting findings, where corporate governance might enhance the relationship between TDP and firm performance. The negative signs of the variables in the TDP model are also chang-ing to positive, and the magnitude of the es-timated coefficient is bigger. India and China, where TDP does not have an effect on firm performance, showed an inverse relationship. This implied that corporate governance rela-tively fixes the firms’ performance through imposing TDP.
Tobin's Q ROA Tobin's Q ROA
China Indonesia
TRAIN 0.1262 0.1488 0.2330** 0.1062**
(0.1613) (0.1655) (0.0408) (0.0420)
GOV 0.0351*** 0.0100*** 0.0710*** 0.0123***
(0.0000) (0.0060) (0.0000) (0.0001)
TRAIN*GOV 0.0322*** 0.0292*** 0.0308** 0.0344***
(0.0085) (0.0000) (0.0351) (0.0000)
Adj R2 0.2446 0.1101 0.0824 0.0963
Table 6. Continued
The regression is performed using two different measures of performance: Tobin’s Q and ROA. The figure stated are the coefficient values, except numbers in parentheses which are p-value. The dependent variable is firm performance. The control variables are relative size (RLTA), relative profitability (ROIS), relative growth (RCES), and relative leverage (RLEV). The main independent variables are Training and Development Policy (TDP), and Corporate Governance. The innovation in this research is the interactive terms between TDP and corporate governance. This is robustness check of the moderating role by creating a dummy variable of corporate governance. The model is as follow:
t i t i t
i t
i t
i t
i t
i t
i OIS CES LEV Train GOV Train GOV
LTA
In other words, successful training and development relies on the corporate gover-nance of the firms. Firms without good cor-porate governance ended up with low growth and probably also grow smaller. The substan-tial outlay that organizations spend each year on formal training and development programs is made with the expectation that their train-ing investments will lead to improvements in their organizational performance, but this is hugely based on the corporate governance performance of the firm. This is consistent with studies by Bunch (2007), and Deng et al. (2012), which addressed the success rate of training and development and found it depends on the governance of the firm. Us-ing Shleifer and Vishny (1997) to postulate the conclusion, TDP, which is an investment for better firm performance, will be success-ful if the firm has good corporate governance. A better level of corporate governance might prohibit the managers from personally prof-iting from business operations such as train-ing and development. This implied that firms with good levels of corporate governance may perform relatively better from their training and development programmes as compared to those firms without good levels of corpo-rate governance. Moreover, this research also showed that without a good level of corpo-rate governance, a firm might suffer from the incurred cost of its training and development. Besides that, training and development poli-cies without good corporate governance may reduce the size and growth of firms, as can be illustrated from cases in India and China.
Research Implications for
Companies
Does a Training and Development Policy (TDP) affect firm performance? Indus-try and policy makers may benefit in their policymaking processes from the answer.
Often, training and development is treated as cost center, hence, companies will ignore it. The thought that trained staff will leave the company after achieving better capabili-ties pushes companies to have bad policies regarding this matter. Yet, the results of this study show differently. They show that TDP is important for firm performance, meaning that TDP is a good investment for a com-pany. Second, to ensure the return of TDP by improved performance, a company has to have good corporate governance.
Hence, the findings from this research have two main implications for companies. First, it is empirically proven that employing TDP in an organization is good for the per-formance. This implies companies should invest in their human resources, especially training and development, to induce improved performance. Second, there is a moderating role by corporate governance on the TDP-performance link, indicating the need for good corporate governance to ensure the re-turn from TDP. This implies that companies should have better monitoring or governance to make sure their TDP is working. In other words, corporate governance is essential for companies to obtain a good return from their TDP outlays.
Conclusions
sales), growth (capital expenditure to sales), leverage (debt to equity), and size (natural logarithm of the total assets). Firm perfor-mance is measured more comprehensively than in prior studies in the area, where the return on assets and Tobin’s Q are used. The TDP is a dummy variable which is 1 if the firm imposes TDP, and 0 otherwise. The cor-porate governance is measured by a well-es-tablished index called the corporate gover-nance performance index. This index is more robust than the exclusive ownership variables, because it also includes board structure, board function, compenzation policy, and shareholder rights. Another reason for using this index is to avoid the statistical issues if there are too many independent variables, such as type 1 or type 2 errors. As a robust-ness test, corporate governance’s performance is further clustered into the dummy variable of good corporate governance and poor cor-porate governance, and then re-run again in the model by using this governance dummy variable.
The results documented three interest-ing findinterest-ings. Once this research accounted for the impact of corporate governance on firm value, the researchers found a positive and significant relationship between corporate governance and firm performance. This means a company with good corporate gov-ernance tends to have good performance. This research continued by introducing only TDP into the baseline mode. The research-ers found that TDP contributed positively and significantly to the firm performance, con-firming the postulate of the link between TDP and performance. For example, firms imposing TDP may have increased efficiency at work, leading to better productivity by the firms and better performance as compared to firms without TDP. Interestingly, the baseline model (profitability, growth, size, and
leverage) lost its contribution to performance when this research introduced TDP into the model. This indicated that imposing TDP in a firm is more important than the financial factor in relation to improving the firm’s per-formance. Lastly, this research tested whether corporate governance plays an important role in the relationship between TDP and firm performance. Using the corporate governance index, this research found that there is a sig-nificant effect by corporate governance on the relationship between TDP and firm perfor-mance. This research then continued to the robustness test by using the governance dummy variable and found the same results. This means that TDP will influence a firm’s performance if it has good corporate gover-nance. In a nutshell, this research concluded that corporate governance plays an important role in the relationship between TDP and firm performance. This implies that firms with TDP and good corporate governance will outperform those firms with TDP but poor corporate governance and firms with-out TDP.