The Impact of Financial, Non-Financial, and
Corporate Governance Attributes on
The Practice of Global Reporting Initiative (GRI)
Based Environmental Disclosure*
Frendy
Faculty of Economics and Business, Universitas Gadjah Mada
Indra Wijaya Kusuma
Faculty of Economics and Business, Universitas Gadjah Mada
Abstract: Business entities are able to exert their influence on particular stakeholders for the benefit of their interest by managing the information they disseminate to the public, particularly if there is no regu-lation on such issue in place. Accordingly, the extent of accounting information disclosed to the public, specifically voluntary environmental information, is determined by the internal characteristics of the busi-ness entities. The objective of this research is to test the financial, non-financial, and corporate governance attributes of Indonesian public companies which contribute to the extent of environmental information disclosure in Indonesia.
This research measured the extent of Indonesian public companies’ environmental disclosure using Envi-ronmental Disclosure Index (EDI) as a dependent variable. The index is developed from the parameters under environmental protocols of the Global Reporting Initiative (GRI) G3 framework. Samples of 35 Indonesian public companies are purposively chosen for each of the year from 2005-2008 to form a total of 140 observations.
The testing results conclude that size of company, economic performance, and industry sensitivity positively affect environmental disclosure. This research is limited by an assumption that Indonesian public companies employ annual report as the primary means to publicize financial and non-financial information to public.
Abstrak: Entitas bisnis dapat menggunakan pengaruh mereka pada pihak tertentu untuk kepentingan mereka dengan mengelola informasi yang mereka sebar-luaskan kepada publik, terutama jika tidak ada peraturan mengenai masalah tersebut. Dengan demikian, sejauh mana informasi akuntansi diungkapkan kepada lingkungan masyarakat, khususnya informasi lingkungan sukarela, ditentukan oleh karakteristik internal dari badan usaha. Tujuan dari penelitian ini adalah untuk menguji atribut tata kelola keuangan, non-keuangan, dan perusahaan perusahaan publik Indonesia yang berkontribusi pada tingkat pengungkapan informasi lingkungan di Indonesia.
Gadjah Mada International Journal of Business
Vol. 13, No. 2 (May - August 2011): 143 - 159
* This paper has been presented in the 14th National Accounting Symposium at Syiah Kuala University, Banda
Penelitian ini mengukur tingkat pengungkapan lingkungan perusahaan publik menggunakan Environmental Disclosure Index (EDI) sebagai variabel dependen. Indeks ini dikembangkan dari parameter di bawah protokol lingkungan dari kerangka Global Reporting Initiative (GRI) G3. Contoh dari 35 perusahaan publik terpilih di Indonesia untuk setiap tahun dari 2005-2008 untuk membentuk total 140 observasi.
Hasil pengujian menyimpulkan bahwa ukuran perusahaan, kinerja ekonomi, industri dan sensitivitas positif mempengaruhi pengungkapan lingkungan. Penelitian ini dibatasi oleh asumsi bahwa perusahaan-perusahaan publik Indonesia menggunakan laporan tahunan sebagai sarana utama untuk mempublikasikan informasi keuangan dan non-keuangan kepada publik.
Introduction
Accountability is defined as the respon-sibility of management to report the achieve-ment of cozmpany’s objectives for the utili-zation of company’s resources in an effec-tive and efficient way (Ijiri 1983). One ap-proach to improve the accountability of fi-nancial information is the inclusion of social and environment elements into the practice of financial accounting disclosure (Gray et al. 1996).
In recent years, public companies world-wide have increasingly associated themselves as socially and environmentally sustainable entities, as half of Global Fortune 250 was both registered in the stock market and so-cially responsible indices, such as FTSE4GOOD or Dow Jones Sustainability Index (KPMG 2008). In order to further en-courage the inclusion of social and environ-mental elements in the presentation of ac-counting information, the preparer and user of financial reports will need to have better understanding of the management motivation to disclose non-financial information in the annual report and its relationship with the internal characteristics of the company itself. The financial information disclosed to the public, which is presented in the annual financial report, has inherent limitations re-garding the types of information that can be communicated. For example, environmental issue has been regarded as an ‘externality’ which is irrelevant in the financial report. Such notion exists since it is difficult; to quan-tify all social and environmental consequences resulted from the operational activities of the company into monetary values. However, companies can reap the reward for disclosing the above mentioned non-financial informa-tion, as shown in the research by Cohen and
Fenn (1997), who demonstrated positive cor-relation between the investments of environ-mentally friendly technology and the perfor-mance of the company’s stock. Therefore, this research is concerned in investigating the influence of various dimensions of Indone-sian public companies on the degree of envi-ronmental sensitive information released to public.
In the context of Indonesia, the Indo-nesian Institute of Accountants (IAI) has not published any Statement of Financial Ac-counting Standards for publicly traded com-panies which mandated public comcom-panies to disclose information concerning the impact of their business operation to the environ-ment in the financial report. Moreover, the Capital Market Supervisory Agency (Bapepam) did not require the listed compa-nies in Indonesia Stock Exchange (IDX) to provide any environment related information to the investor. Consequently, the practice of disclosing environment related information in the financial report or annual report for public companies in Indonesia is performed voluntarily (Nurhayati et al. 2006). In order to measure the degree of environmentally sensitive information disclosed by the Indo-nesian public companies, this research utilizes Environmental Disclosure Index (EDI) that is developed from the environmental proto-col section of the GRI (Global Reporting Sustainability) G3 framework.
extent of environmental disclosure. How-ever; financial leverage, business complex-ity, and stock-block holders exhibit substan-tial inverse relationships with the observed variable.
Literature Review and
Hypotheses Development
Stakeholders are defined as all human agents who can affect or be affected by the activity of an entity (Gray et al. 1996). This definition implies that the entity and its en-vironment form a complex system which can influence each other. In relevance with the practice non-financial disclosure, stakeholder theory describes that the extent of social in-formation voluntarily disclosed by an entity can be utilized to identify the principal stake-holder for the entity as being the subject for being influenced by the entity (Gray et al. 1996). In other words, the act of an organi-zation to disclose information is seen as a form of ‘proactive’ action by the entity in managing the relationship with the intended stakeholders.
Environmental disclosure, as a subset of social disclosure, plays a significant part in influencing the decisions of investors. This conclusion is obtained by Spicer (1978), whose research confirmed that there is a sig-nificant relationship between the value of investment (economy and financial indica-tor from the investment such as: profitabil-ity, the size of company, systematic and to-tal risk, and price earnings ratio) and the en-vironmental management performance of the company. In addition, research done by Cohen and Fenn (1997) conclude that com-panies with additional investment in environ-mentally friendly technology exhibits posi-tive and neutral stock return performance.
The expanded research done by Shane and Spicer (1983) indicate that the movement of stock price is consistent with the change of investor perception after the information con-cerning the environmental performance of the company is released to the market. Thus, this research postulates that the effort to dis-close environmental information represent an attempt by management to manage the holders’ expectation as affirmed by the stake-holder theory.
Statement of Financial Accounting Standards (SFAS) No. 1 on Presentation of Financial Report issued by the Indonesian Institute of Accountants (IAI) does not man-date public companies in Indonesia to dis-close environmental information. The pro-nouncement allowed the companies to choose whether or not to disclose such in-formation based on their judgment. As the nature of environmental disclosure practice in Indonesia is voluntarily based, the stake-holder theory is appropriate in describing the motivation and driving force behind the de-cision of Indonesian public listed companies to disclose such information. This is regarded as one of the evidence in which the entity can proactively assert its influence to the in-tended stakeholders. Business entities are therefore able to exercise their control on certain stakeholders for the benefit of their interest by overseeing the information they disseminate to public, as there is no regula-tion in place to standardize their activities in disclosing environmental information. Ac-cordingly, the extent of accounting informa-tion disclosed to public, specifically volun-tary environmental information, is deter-mined by the internal characteristics of the business entities.
ba-will increase the level of voluntarily infor-mation disclosure in order to avert excessive government scrutiny.
Previous research concludes the exist-ence of a positive relationship between the size of the company with the extent of so-cial and environmental disclosure (Spicer 1978; Cooke 1989; Meek et al. 1995; Brammer and Pavelin 2004; Nurhayati et al. 2006; Cahaya et al. 2008; Gurdip and Joshi 2009). Accordingly, this study proposes the following hypothesis:
H1: There is a positive association between company size and the extent of GRI based environmen-tal disclosure in Indonesian publicly listed com-panies’ annual reports.
Financial Leverage
Cornell and Shapiro (1987) argue that the financing policy of corporate (the extent of leverage) is influenced by non-investing and investing shareholders in its relation with the explicit and implicit claims from the man-agement. Explicit claims from the manage-ment in the form of financial disclosure are affected by capital investors and creditors. The accounting information disclosure can in-crease the value of such claims by the man-agement (Watts and Zimmerman 1990).
Results of the research on the associa-tion between financial leverage and the ex-tent of disclosure show negative and signifi-cant relationships (Meek et al. 1995). Differ-ent findings are obtained by Craig and Diga (1998), who argue that there is no significant relationship between leverage and the extent of disclosure. Accordingly, this study pro-poses the following hypothesis:
H2: There is a negative association between finan-cial leverage and the extent of GRI based envi-ronmental disclosure in Indonesian publicly listed companies’ annual reports.
sis to measure the degree of environmental information disclosed by public companies in Indonesia. The GRI framework is a volun-tary based international sustainability report-ing framework developed by a large multi-stakeholder network of thousands of experts and hundreds of organizations (GRI 2009). Based on the GRI G3 framework of the en-vironment protocol, the Enen-vironmental Dis-closure Index (EDI) is developed to measure the extent of environmental information dis-closure released by public companies.
Previous research which investigated the relationship between the characteristics of public companies with the extent of closures reveals that the level of social dis-closure of sampled public companies in Brit-ain is positively correlated with the level of the companies’ activity (Brammer and Pavelin 2004). Research done in developing countries has led to various conclusions. Cahaya et al. (2008) infer that company size and the ex-tent of international operation are significant predictors for social disclosure. While Nurhayati et al. (2006) conclude that the size of company and the industry type of the en-tity have positive and significant relationships with the extent of environmental disclosure.
Company Size
Economic Performance
Companies with more than average eco-nomic performance (profitability) have more incentives to differentiate themselves with companies with lower profitability, with the intention to access lower cost capital (Meek et al. 1995). One way in which the differen-tiation can be achieved is by disclosing more information voluntarily (Foster 1986). Singhvi and Desai (1971) who examined the quality of financial information disclosure and Rob-erts (1992) who analyzed the determinant of corporate social responsibility information disclosure conclude that profitability has a positive and significant relationship with the level of disclosure.
Accordingly, this study proposes the fol-lowing hypothesis:
H3: There is a positive association between economic performance and the extent of GRI based envi-ronmental disclosure in Indonesian publicly listed companies’ annual reports.
Business Complexity
The increase of business complexity re-quires the management of business entity to establish a sophisticated and efficient infor-mation system to gather inforinfor-mation needed for the purpose of decision making (Cooke 1989). In line with the growing business com-plexity, the number of stakeholders (suppli-ers, custom(suppli-ers, analysts, and the public) linked with the business will increase as well. This research defines the complexity of business as the existence of subsidiary within the structure of the business entity (Cahaya et al. 2008).
A company with subsidiary tends to have a more sophisticated and efficient ness information system to support their busi-ness operation as well as the increased de-mand of information from the stakeholders.
This condition may encourage the company to voluntarily disclose more information. However, the increased complexity also al-lows the company to engage in various envi-ronmentally sensitive matters indirectly with the use of the subsidiary. Previous research shows an insignificant relationship between the business complexities with the extent of financial report disclosure (Cooke 1989; Haniffa and Cooke 2000).
Accordingly, this study proposes the fol-lowing hypothesis:
H4: There is a negative association between business complexity and the extent of GRI based envi-ronmental disclosure in Indonesian publicly listed companies’ annual reports.
Extent of International
Operation
The expansion of business operation into international market will bring increased interest from foreign stakeholders. As a re-sult the demand for more diverse informa-tion will induce the company to disclose more information (Meek et al. 1995). Research done by Zarzeski (1996) concludes that com-panies with higher international sales tend to disclose more information.
Accordingly, this study proposes the fol-lowing hypothesis:
H5: There is a positive association between the ex-tent of international operation and the exex-tent of GRI based environmental disclosure in In-donesian publicly listed companies’ annual re-ports.
Industry Sensitivity
di-rect impact of their business operations to the environment. Therefore, the type of in-dustry in which the company operates signifi-cantly affects the extent of company’s vol-untarily disclosure (Meek et al. 1995). For the purpose of this research, nine categories of JASICA (Jakarta Industrial Classification) are classified into two groups: environmentally insensitive industries (Property and Real Es-tate, Infrastructure, Finance, Trade, Services and Investment industries) and environmen-tally sensitive industries (Agriculture, Mining, Chemical, Consumer Goods and Miscella-neous industries).
A number of researchers who investi-gate the influence of industry sector to the extent of financial report disclosure exhibit significant relationships (Craig and Diga 1998; Nurhayati et al. 2006; Gurdip and Joshi 2009).
Accordingly, this study proposes the fol-lowing hypothesis:
H6: There is a positive association between industry sensitivity and the extent of GRI based envi-ronmental disclosure in Indonesian publicly listed companies’ annual reports.
Stock Block-Holder Structure
Stock block-holder is defined as the per-centage of common stock owned by the ma-jority stockholder, which is used to measure the power of majority stockholders in the company’s equity structure (Nurhayati et al. 2006). The management of company in which the stockholder equity is possessed by diversified and more widely dispersed own-ers will have greater incentive to voluntarily disclose information (McKinnon and Dalimunthe 1993).
Schadewitz and Blevins (1998) demon-strate the inverse relationship between the size institutional investor stock ownership and the
extent of interim disclosure. However, Nurhayati et al. (2006) did not find signifi-cant relationship between the sizes of stock block-holders with the level of environmen-tal disclosure. Accordingly, this study proposes the following hypothesis:
H7: There is a negative association between stock block-holder structure and the extent of GRI based environmental disclosure in Indonesian publicly listed companies’ annual reports.
Board of Commissioners’
Structure
Board of Commissioners’ structure in this research is defined as the proportion of independent (non-executive) commissioners from the total number of commissioners (Nurhayati et al. 2006). The argument that the existence of independent commissioners can increase the extent of voluntarily disclo-sure is based on agency and resource depen-dency theory, in which independent commis-sioners have more power to drive the man-agement to disclose more voluntary informa-tion compared to non-independent commis-sioners (Haniffa and Cooke 2000).
Previous research which investigated the relationship between the proportion of independent commissioners with the extent of financial disclosure, exhibit a positive and significant relationship (Chen and Jaggi 2000; Haniffa and Cooke 2000). A different con-clusion obtained by Nurhayati et al. (2006) shows an insignificant relationship between the Board of Commissioners’ structures with the extent of environmental disclosure. Ac-cordingly, this study proposes the following hypothesis:
Methodology
This research utilized the annual report of all publicly listed companies in Indonesia Stock Exchange (IDX) for the period of 2005-2008. The sampling method used is purpo-sive sampling, in which the samples had to be listed in IDX since 2005 and the annual reports had to be published continuously for the period of observation. In addition to pub-lished annual reports, this research also con-siders the information from sustainability re-ports published separately from the annual reports to measure the Environmental Dis-closure Index (EDI). Data panel model which consists of constant cross-sectional units ob-served for a specific period of time is applied in this research (Gujarati and Porter 2009).
The Environmental Disclosure Index used in this research is based on the Global Reporting Initiative (GRI) G3 environment performance indicators. The EDI score is unweighted to maintain objective and con-sistent results across samples. The use of an unweighted index is more suitable in the con-text of disclosure practice in developing countries considering the generally lower quality and quantity of information disclosed (Nurhayati et al. 2006) and distinct social, economic, and political conditions compared to developed economies (Cahaya et al. 2008). Dichotomous procedure is implemented to measure the total disclosure score for each company’s sample, in which disclosed EDI attribute is rated with one (1) point and un-disclosed EDI attribute is rated with zero (0) point. The Total Environmental Disclosure (TED) score for each sample is measured as follows (Cooke 1989):
where,
d = 1 if EDI disclosure attribute is disclosed d = 0 if EDI disclosure attribute is undis-closed, where m n (discussed below).
The Maximum Environmental Disclo-sure (MED) score for each sample is then computed by comparing the TED score with the expected maximum environmental score to be disclosed by considering the industry sector background of each sample, whether the industry is environmentally sensitive or not. This treatment is done to prevent the company for being penalized for irrelevant environmental disclosure attributes not rel-evant to the industry sector (Cooke 1989). Accordingly, the Maximum Environmental Disclosure (MED) score for each sample is measured as follows:
where,
d = expected EDI disclosure attributes to be disclosed;
Measurement techniques used to calcu-late the independent variables are based on previous studies (Craig and Diga 1998; Haniffa and Cooke 2000; Nurhayati et al. 2006; Cahaya et al. 2008).
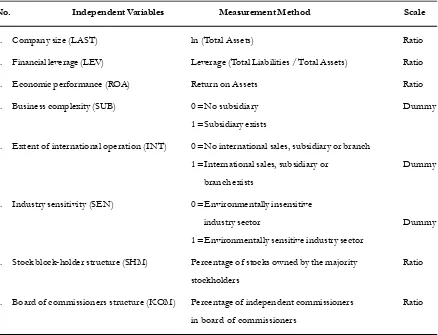
The industry sensitivity (SEN) variable is measured by classifying nine industry sec-tors of the samples into two groups in accor-dance to their impacts of their business op-eration on the environment (Nurhayati et al. 2006). The first group is assigned a SEN value of 0 (environmentally insensitive in-dustry sector) and is comprised of samples from Property, Real Estate and Building Con-struction; Infrastructure; Utilities and Trans-portation; Finance and Trade, Services and
Investment industry sectors. Accordingly, samples from Agriculture; Mining; Basic In-dustry and Chemicals; Miscellaneous Indus-try and Consumer Goods IndusIndus-try sectors are designated with a SEN value of 1 (environ-mentally sensitive industry sector). Table sum-marizes the measurement procedures for in-dependent variables used in this research.
The following multiple linear regression equation applies a panel data fixed effect es-timation model:
Table 1. Independent Variables Measurement Method
No. Independent Variables Measurement Method Scale
1. Company size (LAST) ln (Total Assets) Ratio
2. Financial leverage (LEV) Leverage (Total Liabilities / Total Assets) Ratio
3. Economic performance (ROA) Return on Assets Ratio
4. Business complexity (SUB) 0 =No subsidiary Dummy 1 =Subsidiary exists
5. Extent of international operation (INT) 0 =No international sales, subsidiary or branch
1 =International sales, subsidiary or Dummy branch exists
6. Industry sensitivity (SEN) 0 =Environmentally insensitive
industry sector Dummy 1 =Environmentally sensitive industry sector
7. Stock block-holder structure (SHM) Percentage of stocks owned by the majority Ratio stockholders
8. Board of commissioners structure (KOM) Percentage of independent commissioners Ratio in board of commissioners
EDIit=0 + 1LASTit + 2LEVit + 4SUBit
+ 5INTit + 6SENit + 7SHMit
Where,
EDI =environmental disclosure index score
LAST =company size
LEV =financial leverage
ROA =economic performance SUB = business complexity (dummy) INT = international operation (dummy) SEN = industry sensitivity (dummy) SHM = stock block-holder structure KOM = board of commissioners structure
u = residual error
it =i-th observation on t period
= constants
Results
From the total of 316 companies regis-tered in the Indonesia Stock Exchange for the year 2008 (IDX 2008), 35 companies are obtained as samples for each period of ob-servation (see Appendix 3). Consequently, the total number of observations for this research is 140 firm-years. The summary of descrip-tive statistics results for independent variables used in this research is depicted in Table 2 and Table 3 respectively.
From the descriptive statistics results, the mean value of 58.19 percent for LEV indicates that the majority of sampled com-panies are highly leveraged. This high value is caused by the inclusion of financial
insti-No. Non-Dummy Minimum Maximum Mean Std. Deviation
Variable
1 Total Assets 118 358,439 27,255 60,290
(in billion IDR)
2 LEV 0.1706 0.9807 0.5819 0.2111
3 ROA -0.1972 0.6216 0.0627 0.0937
4 SHM 0.13.08 0.9900 0.5085 0.2013
5 KOM 0.1667 0.8000 0.4243 0.1179
Table 2. Descriptive Statistics Summary of Non-Dummy Independent Variables
No Dummy Variable Observed Frequency Percentage
1 SUB: - No subsidiary 18 12.86
- Subsidiary exist 122 87.14
2 INT: - No international operation 59 42.14
- International operation 81 57.86
3 SEN: - Environmentally insentive 80 57.14
- Environmentally sensitive 60 42.86
tutions (banks) as sampled in this research, which is characterized by their high levels of leverage. Furthermore, it can be inferred that the mean value of 50.85 percent for SHM variable suggests that the ownership of pub-lic companies in Indonesia is still dominated by a single majority stakeholder.
The result of the above table for SUB variable suggests that the majority (87.14%) of sampled public companies had at least one subsidiary. Meanwhile, more than half of the companies (57.86%) engaged in international business operations. In addition, 57.14 per-cent of the sampled companies operated in business with no direct impact to environ-ment.
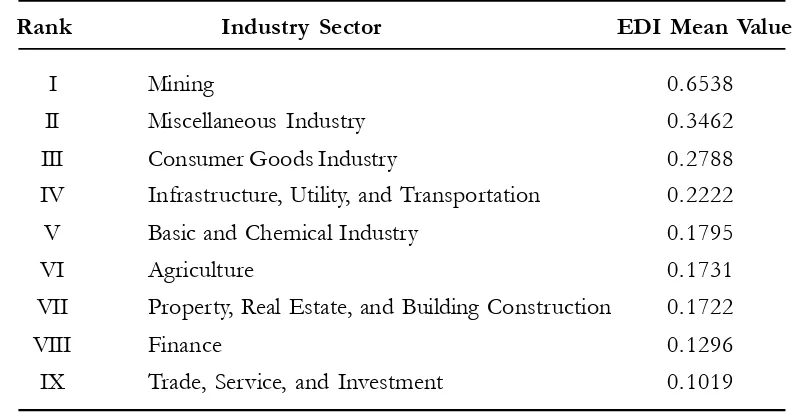
The results of the dependent variable (EDI/Environmental Disclosure Index) mean value ranked by industry sectors are illus-trated at the Table 4.
Indonesian public companies operating in the mining sector exhibit the highest level
of environmental disclosure, with a mean value of 0.6538. The second and third in-dustries with a high EDI mean value are mis-cellaneous and consumer goods industries with an EDI mean value of 0.3462 and 0.2788 respectively. It should be noted that the difference of EDI mean value between the first and second rank is significant (88.9%). This result indicates a significant dif-ference of environmental disclosure level for samples across different industries.
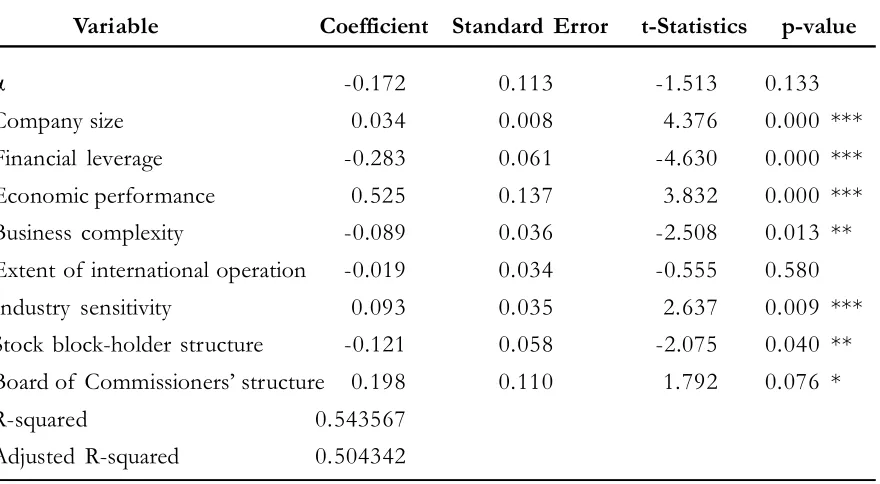
In order to ensure that the panel data equation estimation results faithfully repre-sent the tested samples; assumption tests such as normality, multicollinearity, and heterocedasticity tests have been done and satisfied before conducting the multiple lin-ear regression. The estimation results of mul-tiple liner regression for the hypotheses which apply the panel data fixed effect estimation model are exhibited in Table 5.
Table 4. Dependent Variable Mean Value Ranking based on Industry Sector
Rank Industry Sector EDI Mean Value
I Mining 0.6538
II Miscellaneous Industry 0.3462
III Consumer Goods Industry 0.2788
IV Infrastructure, Utility, and Transportation 0.2222
V Basic and Chemical Industry 0.1795
VI Agriculture 0.1731
VII Property, Real Estate, and Building Construction 0.1722
VIII Finance 0.1296
Discussion and Conclusion
The internal characteristics of observed Indonesian public companies are categorized into three dimensions, namely financial, non-financial and corporate governance attributes. Financial attributes are represented by com-pany size, financial leverage, and economic performance (profitability). The company size has a linear relationship with the extent of voluntary GRI based environmental disclo-sure of Indonesian public companies. Larger companies are more vulnerable to high po-litical cost (Watts and Zimmerman 1978), which in turn compels them to provide greater voluntarily disclosure to the public in order to evade excessive oversight and regulations from the public and government. This con-clusion is consistent with previous research
performed by Spicer (1978), Cooke (1989), Meek et al. (1995), Brammer and Pavelin (2004), Nurhayati et al. (2006), Cahaya et al. (2008), and Gurdip and Joshi (2009).
Economic performance has in-line re-lationship with the extent of voluntary GRI based environmental disclosure of Indone-sian public companies. Singhvi and Desai (1971) argue that if the company has better rate of return (profitability), the management will have more incentives to disclose more complete information in order to support the sustainability of their station and compensa-tion. This result corresponds with the find-ings obtained in Singhvi and Desai (1971) and Roberts (1992) research.
The estimation result for financial le-verage shows an inverse relationship with the Table 5. Multiple Linear Regression Estimation Result with Panel Data Fixed Effect Model
Variable Coefficient Standard Error t-Statistics p-value
-0.172 0.113 -1.513 0.133
Company size 0.034 0.008 4.376 0.000 ***
Financial leverage -0.283 0.061 -4.630 0.000 ***
Economic performance 0.525 0.137 3.832 0.000 ***
Business complexity -0.089 0.036 -2.508 0.013 **
Extent of international operation -0.019 0.034 -0.555 0.580
Industry sensitivity 0.093 0.035 2.637 0.009 ***
Stock block-holder structure -0.121 0.058 -2.075 0.040 **
Board of Commissioners’ structure 0.198 0.110 1.792 0.076 *
R-squared 0.543567
Adjusted R-squared 0.504342
extent of environmental disclosure; which is consistent with the proposed hypothesis. This result can be interpreted as the indifference of creditors of public companies in Indone-sia in responding of the additional environ-mental information disclosed by the manage-ment. This conclusion corresponds with the result obtained by Meek et al. (1995).
Non-financial attributes are represented by business complexity, the extent of inter-national operation, and industry sensitivity. The industry sensitivity has a positive rela-tionship with the extent of voluntary GRI based environmental disclosure of Indone-sian publicly listed companies, in which com-panies operating in more ecologically sensi-tive industry sectors tend to disclose more environmentally related information. This is consistent with the findings obtained by Craig and Diga (1998), Nurhayati et al. (2006), and Gurdip and Joshi (2009).
Inverse relationships exist between busi-ness complexity and the extent of environmen-tal disclosure. One line of reasoning for such finding is that there is a tendency for Indone-sian publicly listed companies that operate the business through their subsidiaries to conceal information through the use of aggregation/ consolidation of annual reports.
In addition, this research cannot iden-tify the association between the extent of international operation and the extent of en-vironmental disclosure. This lack of relation-ship is caused by a minor contribution of the international operation (sales) for Indonesian public companies compared to the overall business operation. As a result, there is a lack of incentives for the management to provide additional and better quality disclosure infor-mation for foreign stakeholders. This finding is consistent with the result obtained by Meek et al. (1995) and Craig and Diga (1998).
Corporate governance attributes are rep-resented by the stock block-holder structure and the Board of Commissioners’ structure. An inverse relationship exists between the stock block-holder structure and the extent of voluntary GRI based environmental dis-closure. This finding reveals that a more cen-tralized ownership of stock by institutional ownership will negatively impact the amount of disclosed information. The already low equity cost of agency, which is expected in entity with highly centralized stock owner-ship (McKinnon and Dalimunthe 1993), will discourage the motivation of management to provide additional non-financial disclosure to the public.
The moderate association which exists between the proportions of independent com-missioners with the degree of disclosed en-vironmental information. This finding is con-sistent with the studies of Chen and Jaggi (2000) and Haniffa and Cooke (2000). This result is caused by the Bapepam (Capital Market Supervisory Agency) Regulation No. SE-03/PM/2000 and the Indonesia Stock Exchange Regulation No. I-A, which man-dated that a minimum of 30 percent of the board of commissioners’ members to be in-dependent. In addition, this research includes samples from publicly listed banks, which are subjected to Bank of Indonesia Regulation No. 8/4/PBI/2006. The law mandated that a minimum 50 percent of the members of the Board of Commissioners must be inde-pendent. Thus, the weak relationship between the proportion of independent commission-ers and the extent of environmental disclo-sure in this research is significantly influenced by the legal regulations on corporate gover-nance in Indonesian jurisdiction.
pe-riod only covers five years (2005-2008), as environmental information were not monly disclosed in Indonesian public com-panies annual reports prior to 2005. Secondly, this research only includes published environ-mental information in annual reports and ac-companying supplemental reports. Alterna-tive information channels used by companies to inform environmental information to stakeholders such as web pages and social networks are not covered in this paper.
For future research, there are two points for further consideration. Firstly, the inclusion of the composition of the independent board of commissioners as an explanatory variable in future research which covers different in-dustries and jurisdictions should be carefully considered, since certain corporate gover-nance legal statutes require public companies to maintain a certain number of independent commissioners. Secondly, considering the wide disparity of EDI mean value across indus-tries as presented in Table 4, future research
could choose to focus on the unique charac-teristics of certain industries which influence the disclosure of environmental information. This paper concluded that certain char-acteristics of public companies in Indonesia highly influence the extent of environmental information disclosed. Investors in capital markets are increasingly aware on the impor-tance of sustainable development and will accordingly reward public companies who actively disclose environmental information (Cohen and Fenn 1997). By taking the results of this research into consideration, Indone-sian Capital Market Supervisory Agency and stock market authority may consider to man-date a certain degree of obligatory environ-mental information disclosure to public com-panies which satisfies specific requirements. This effort will further enhance the capital market information transparency and fulfill investors’ demands of availability of relevant information for the purpose of making long-term investment decisions.
References
Brammer, S., and S. Pavelin. 2004. Voluntary social disclosures by large UK companies. Business Ethics: A European Review 13 (July): 86-99.
Cahaya, F. R., S. A. Porter, and A. M. Brown. 2008. Social disclosure practices by Jakarta Stock Exchange listed entities. Journal of the Asia-Pacific Centre for Environmental Accountability 14 (1): 2-11.
Chen, C. J., and B, Jaggi. 2000. Association between independent non-executive directors, family control and financial disclosures in Hong Kong. Journal of Accounting and Public Policy 19 (4/5): 285-310. Cohen, M. A., S. A. Fenn, and S. Konar. 1997. Environmental and Financial Performance: Are They Related?:
1-40.
Cooke, T. E. 1989. Disclosure in the corporate annual reports of Swedish companies. Accounting and Business Research 19 (74): 113-124.
Cornell, B., and A. C. Shapiro. 1987. Corporate stakeholders and corporate finance. Financial Management
(Spring): 5-14.
Foster, G., 1986. Financial Statement Analysis. Englewood Cliffs, N. J.: Prentice-Hall.
Gray R., D. Owen, and C. Adams. 1996. Accounting and Accountability.Englewood Cliffs, NJ: Prentice-Hall. Global Reporting Initiative (GRI). 2009. Year in review. Annual Report.
Gujarati, D. N., and D. C. Porter. 2009. Basic Econometrics (5th ed.). Singapore: McGraw-Hill.
Gurdip, S., and M. Joshi. 2009. Environment management and disclosure practices of Indian companies.
International Journal of Business Research 9 (2): 116-128.
Haniffa, R., and T. Cooke. 2000. Culture, Corporate Governance and Disclosure in Malaysian Corporations. Singapore: Asian AAA World Conference.
Ijiri, Y. 1983. On the accountability-based conceptual framework of accounting. Journal of Accounting and Public Policy: 75-81.
Indonesia Stock Exchange (IDX). 2008. IDX Fact Book 2008. Research and Product Development Divi-sion.
KPMG. 2008. KPMG International Survey of Corporate Responsibility Reporting 2008.
McKinnon, J. L., and L. Dalimunthe. 1993. Voluntary disclosure of segment information by australian diversified companies. Accounting and Finance 33 (1): 33-50.
Meek, G. K., C. B. Roberts, and S. J. Gray. 1995. Factors influencing voluntary annual report disclosures by U.S., U.K. and Continental European multinational corporations. Journal of International Business Studies 26 (3): 555-572.
Nurhayati, R., A. Brown, A. and G. Tower. 2006. A Developing Country’s Natural Environment Disclosure Index. Wellington, New Zealand: AFAANZ Conference.
Roberts, R. W. 1992. Determinants of corporate social responsibility disclosure: An application of stake-holder theory. Accounting, Organizations and Society 17 (6): 595-612.
Schadewitz, H. J., and D. R. Blevins. 1998. Major determinants of interim disclosures in an emerging market. American Business Review 16 (11): 41-55.
Shane, P. B., and B. H. Spicer. 1983. Market response to environmental information produced outside the firm. The Accounting Review LVIII (3): 521-538.
Singhvi, S. S., and H. B. Desai. 1971. An empirical analysis of the quality of corporate financial disclosure.
The Accounting Review 46 (1): 129-138.
Spicer, B. H. 1978. Investors, corporate social performance and information disclosure: An empirical study. The Accounting Review LIII (1): 94-111.
Watts, R. L., and J. L. Zimmerman. 1978. Towards a positive theory of the determination of accounting standards. The Accounting Review LIII (1): 112-134.
Watts, R. L., and J. L. Zimmerman. 1990. Positive accounting theory: A ten year perspective. The Account-ing Review 65 (1): 131-156.
Appendices
Appendix 1. Disclosure Indicators for Environmentally Insensitive Industry Sector (SEN= 0)
No. Disclosure Indicators
1 Initiatives for saving resources consumption (recycling). 2 Amount of energy consumption
3 Initiatives to provide energy-efficient, renewable energy-based or environmentally friendly prod-ucts or services.
4 Strategies or descriptions of waste/emission processing.
5 Initiatives to reduce energy consumption and reductions in energy requirements as a result of these initiatives.
6 Strategies, current actions and future plans for managing company’s operation impacts on biodiversity.
7 Initiatives to reduce air emissions or greenhouse gas. 8 Initiatives to improve quality of environment.
9 Descriptions of violation of environmental laws and regulations.
Appendix 2. Disclosure Indicators for Environmentally Sensitive Industry Sector (SEN= 1)
No. Disclosure Indicators
1 Descriptions of materials used in company’s operation.
2 Descriptions of recycled or reprocessed materials used in company’s operation. 3 Amount of energy consumption
4 Reductions in energy requirements as a result of conservation initiatives.
5 Initiatives to provide energy-efficient, renewable energy-based or environmentally friendly prod-ucts or services.
6 Initiatives to reduce energy consumption.
7 Conservation and recycling efforts to process effluent.
8 Strategies, current actions and future plans for managing company’s operation impacts on biodiversity.
9 Initiatives to reduce air emissions or greenhouse gas.
10 Descriptions of air emissions resulting from company’s operation. 11 Strategies or descriptions of solid waste processing.
Appendix 3. List of Samples
No. Stock Name of Company Industry Sector
Code Classification
1 UNSP PT Bakrie Sumatra Plantations Tbk. Agriculture 2 MBAI PT Multibreeder Adirama Indonesia Tbk.
3 INCO PT International Nickel Indonesia Tbk. Mining
4 SOBI PT Sorini Agro Asia Corporindo (Sorbitol) Tbk. Basic Industry and Chemicals 5 AMFG PT Asahimas Flat Glass Tbk.
6 JPFA PT Japfa Comfeed Indonesia Tbk 7 BRPT PT Barito Pacific Timber Tbk. 8 INTP PT Indocement Tunggal Prakarsa Tbk. 9 UNIC PT Unggul Indah Cahaya Tbk.
10 GJTL PT Gajah Tunggal Tbk. Miscellaneous Industry 11 ASII PT Astra International Tbk.
12 SMAR PT Sinar Mas Agro Resources and Technology Tbk. Consumer Goods Industry 13 RMBA PT Bentoel International Investama Tbk.
14 KAEF PT Kimia Farma (Persero) Tbk. 15 UNVR PT Unilever Indonesia Tbk.
16 LPKR PT Lippo Karawaci Tbk. Property, Real Estate and Building Construction 17 CTRA PT Ciputra Development Tbk.
18 JIHD PT Jakarta International Hotel Tbk.
19 GMTD PT Gowa Makassar Tourism Development Tbk. 20 ADHI PT Adhi Karya (Persero) Tbk.
21 PGAS PT Perusahaan Gas Negara (Persero) Tbk. Infrastructure, Utilities and Transportation 22 CMNP PT Citra Marga Nusaphala Persada Tbk.
23 TLKM PT Telekomunikasi Indonesia (Persero) Tbk.
24 BDMN PT Bank Danamon Tbk. Finance
25 BNLI PT Bank Permata Tbk.
26 PNBN PT Pan Indonesia (Panin) Bank Tbk. 27 BBRI PT Bank Rakyat Indonesia (Persero) Tbk. 28 BBIA PT Bank UOB Buana Tbk.
29 BMRI PT Bank Mandiri (Persero) Tbk.
30 MAPI PT Mitra Adiperkasa Tbk. Trade, Services and Investment 31 HERO PT Hero Supermarket Tbk.