ACQUISITION AND PROCESSING OF HIGH RESOLUTION HYPERSPECTRAL
IMAGERIES FOR THE 3D MAPPING OF URBAN HEAT ISLANDS AND
MICROPARTICLES OF MONTREAL
R. Mongeau¹, Y. Baudouin², and F. Cavayas³
¹ Geomatics Division, Infrastructure Department, Ville de Montreal (VdM), Montreal (Qc) – ([email protected]) ² Geographic Department, Universite du Quebec a Montreal (UQAM), Montreal (Qc) – ([email protected])
³ Geographic Department, Universite de Montreal (UdeM), Montreal (Qc) – ([email protected])
KEY WORDS: 3D data acquisition and processing, heat islands, microparticles, air pollution, environmental problems
ABSTRACT:
Ville de Montreal wanted to develop a system to identify heat islands and microparticles at the urban scale and to study their formation. UQAM and UdeM universities have joined their expertise under the framework "Observatoire Spatial Urbain" to create a representative geospatial database of thermal and atmospheric parameters collected during the summer months. They innovated in the development of a methodology for processing high resolution hyperspectral images (1-2 m). In partnership with Ville de Montreal, they integrated 3D geospatial data (topography, transportation and meteorology) in the process. The 3D mapping of intra-urban heat islands as well as air micro-particles makes it possible, initially, to identify the problematic situations for future civil protection interventions during extreme heat. Moreover, it will be used as a reference for the Ville de Montreal to establish a strategy for public domain tree planting and in the analysis of urban development projects.
1. INTRODUCTION
Major cities are facing many environmental problems that have an impact on the health and well-being of the population and Montreal is not an exception (Reeves, 2014). Physical phenomena such as global warming and air pollution call on local governments to address these problems, find mitigation solutions and evaluate mitigation measures. The estimation of the air temperatures at the “urban canopy” level and their diurnal variations is crucial in urban heat islands studies. Remote sensing offers the possibility for mapping surface temperatures which are closely related to the air temperatures and can be used as an input to simulate air temperature spatial and temporal variations over an urban area. (Unger et al., 2009)
Satellite imagery of medium resolution of about 100 m (such as Landsat or ASTER) is often used for surface temperature mapping. However at such resolutions the sensors capture a blend of roofs and roads, gardens and parking lots, often expressing an average rather than the reality. This is not well adapted to the complexity of urban environments. Furthermore, satellite imagery acquired at night required for studies of surface temperature diurnal variations is very difficult to obtain.
Airborne high-resolution imagery offers the possibility for mapping surface temperatures at a detailed level both day and night. Following a bench test performed in 2012 with airborne technology and proven results, it is now possible (because of the notable increase of the resolution ≈ 1m) to evaluate the impact of management measures at the “Building and its components” level, which was impossible before (Cavayas et al. ,2013). Air microparticles concentration (PM 2.5) near the ground is currently measured with a high temporal resolution at
15 ground stations located throughout the city of Montreal.
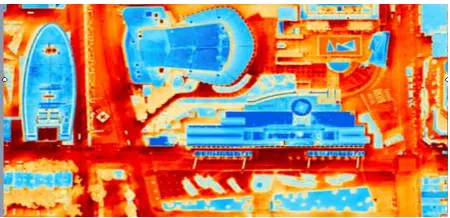
Figure 1. At the first phase of this project in 2012, nocturnal temperature measurement at 80 cm resolution demonstrated the
thermal behaviour of various surface cover materials, Place des festivals (QdS)
However, epidemiological and medical studies clearly demonstrate that the exposure to these micro-particles (and thus the possible impact on cardiovascular and pulmonary health) of individuals vary widely within cities. This variability is difficult to detect by measuring PM 2.5 at only a few stations. Remote sensing imagery in the solar spectrum offers the possibility for mapping the aerosol optical depth (AOD) variations over a city. This optical parameter is, in principle, closely related to PM 2.5 concentrations near the ground. Exact estimation of the AOD from satellite imagery over the highly heterogeneous urban areas is however a difficult task. High spatial resolution airborne imagery can be used to better locate areas where exact estimation of the AOD could be carried out at various scales. Such areas could be used as “pseudo-stations” for PM 2.5 measurements and thus, together with “real” stations, for a more representative mapping of PM 2.5 concentrations at the local scale.
2. ACQUISITION OF AIRBORNE HYPERSPECTRAL IMAGERY
In the summer of 2016, Ville de Montreal ordered a complete coverage of the agglomeration of Montreal with high spatial The International Archives of the Photogrammetry, Remote Sensing and Spatial Information Sciences, Volume XLII-4/W7, 2017
12th 3D Geoinfo Conference 2017, 26–27 October 2017, Melbourne, Australia
This contribution has been peer-reviewed.
https://doi.org/10.5194/isprs-archives-XLII-4-W7-27-2017 | © Authors 2017. CC BY 4.0 License.
resolution airborne hyperspectral images in the solar and thermal spectrum. ITRES Research Ltd (Calgary, Canada) acquired: 1) daylight CASI-1500 images covering the 0.37 to 1.04 micrometers spectrum (near UV, visible and near-infrared) in 96 contiguous bands at 1 m ground resolution; 2) day and night TASI-600 images covering the 8.0 to 11.5 micrometers spectrum (thermal infrared) in 32 contiguous bands at respectively 1 m and 2 m resolution. The choice of the acquisition parameters was a compromise between scanning speed, spatial resolution, data volume and aircraft speed. CASI hyperspectral data is to be used for a better estimation of the aerosol optical depth (AOD) as well as to support mapping of surface cover materials, while hyperspectral TASI data for a better estimation of the surface temperatures at a detailed level by eliminating the surface emissivity effects on radiance measurements.
49 lines were flown during the day, and 76 at night. A minimal of 10% overlap between the lines was required to allow for the creation of image mosaics. Weather data (pressure, air temperature and relative humidity) during flights, including on board the aircraft, was also recorded. The acquisitions were made under ideal conditions of flight in a no cloudy sky with dry soil. The overflights were carried out in the time zones during which the inert materials reached a peak temperature between 13:00 - 16:00 and a minimum temperature just before sunrise 01:00 – 04:00.
Figure 2. Flights lines over the Montreal’s island; acquired data have to normalized because, due to adverse atmospheric conditions, 6 different days in one month were needed to cover
the whole area
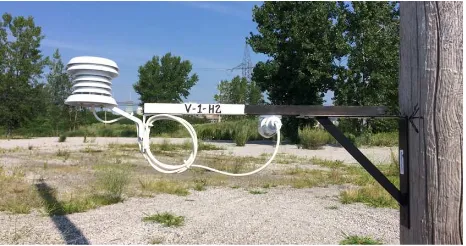
Figure 3. Combination of sensors for synchronous measurements of surface temperature (iButton) and air temperature (Hobo) to establish their relationship for various
surface cover materials
Various field controls were distibuted over the 500 km² of the island of Montreal. 30 "iButtons" thermal sensors were located on different types of soil, and even on building rooftops. The air above the surfaces follows a pattern of heating-cooling which differs according to the type of underlying surface. Thus, most often, a "Hobo" type air temperature sensor was paired at 3 m height.
Measurements were also taken with infrared guns to complete the calibration of the thermographs. 11 radiometric and geometric validation panels (3m X 3m) were installed on the ground or on roofs of buildings. These panels were made of white paint marking or "Tyvek" type construction material. In addition, at all times, 15 permanent air quality monitoring stations were continuously recording concentrations of fine particles.
3. GEOSPATIAL DATA PROCESSING
ITRES proceeded with the geometric corrections of both CASI and TASI images to eliminate the distortions due to linear scanning and atmospheric disturbances during overflights (gale, turbulence, etc.). Both CASI and TASI data were calibrated in radiance units.
Figure 4. ITRES produced orthorectified images based on high resolution Digital Surface Model provided by the Ville de Montréal (DSM generated from high-density aerial LiDAR)
Subsequently the university teams converted the TASI radiances to ground temperatures by applying atmospheric corrections (MODTRAN code) and a TES (temperature-emissivity separation) algorithm (Bouroubi, 2009). The actual R&D project represents a remote sensing challenge at high resolution levels. Preliminary tests showed a good correspondence between estimated temperatures and measured ground surface temperatures (RMS error less than 20 C) except for some roof covering materials. Research is continued to improve the TES algorithm by better exploiting the thermal signature characteristics. The results are analysed in relation to land use/cover.Concerning the CASI imagery, processing algorithms are under development for the 1) the estimation of the AOD over dark surfaces based on the 6S atmospheric code; 2) conversion of the radiance measurements into ground reflectances based on the same atmospheric code for a better estimation of the material spectral signatures; and 3) mapping of the surface materials based on their spectral signatures.
The microparticles results are improved by introducing correlation with data on land use/covery, density of the road network, road traffic, direction and wind speed.
The International Archives of the Photogrammetry, Remote Sensing and Spatial Information Sciences, Volume XLII-4/W7, 2017 12th 3D Geoinfo Conference 2017, 26–27 October 2017, Melbourne, Australia
This contribution has been peer-reviewed.
https://doi.org/10.5194/isprs-archives-XLII-4-W7-27-2017 | © Authors 2017. CC BY 4.0 License.
Figure 5. Environment Canada models atmospheric dispersion (CUDM, 2007) using VdM 3D city models
Figure 6. VdM’s Transportation Department is modeling 3D road traffic using the VISSIM software from DYNAMEQ
database (Volet et al., 2008)
4. 3D CITY MODEL & GIS
The mapping of surface temperatures and their diurnal variations provides the basis of work for the different departments of the Ville de Montreal.
Figure 7. Map shows thermal behavior for different sites covered with asphalt, grass, or woodlands
Variability is observed in relation to the exposure of the sites (shadowlit versus sunlit). The contribution of 3D geospatial data from Ville de Montreal also allows the visualization of thermal data on the ground surface and the roofs of buildings.
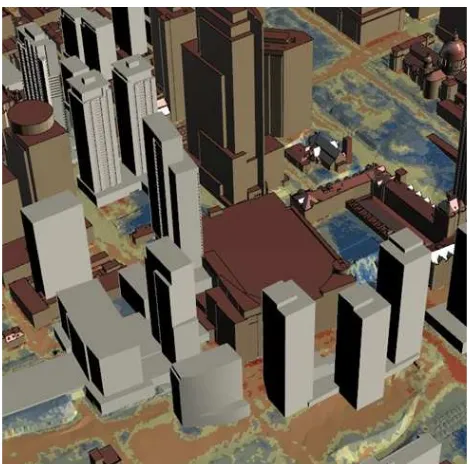
Figure 8. The 3D map well represents measurements results, and particularly the mitigation by trees vegetation to surface
temperatures during day time in downtown
But the contribution of 3D representation is not limited to drapping the orthorectified temperature map on 3D city model. Ville de Montreal’s departments benefited from data produced by this project (surface temperature (day-night), emmissity, permeability, concentration of microparticles) as descriptive data integrated in their respective 3D GIS (ArcGlobe, Bentley Map, Rhinoceros). These informations completed the informational framework of the real estate assessment role.
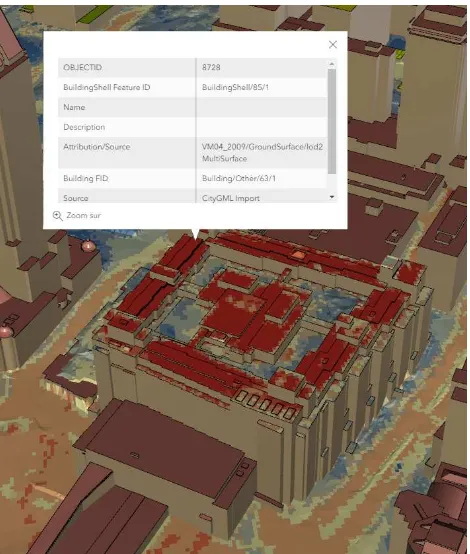
Figure 9. In 3D GIS, building surface data are linked to LoD2-roof and land surface are linked to the cadastre (properties
limits) in LoD0
As examples of 3D applications,, specialists in charge for emergency services want to map heat vulnerability (Lareau and Baudouin, 2015) by data crossing from heat island surface with deprivation and people aged 65 living alone. They also taking into account the 3D buildings in their analysis and to plan interventions. In practice, the surface urban heat island (SUHI) is defined as an urban area characterized by higher summer temperatures than the immediate environment, with differences ranging from 5 à 10˚C. (Champagne, 2002). As part of the The International Archives of the Photogrammetry, Remote Sensing and Spatial Information Sciences, Volume XLII-4/W7, 2017
12th 3D Geoinfo Conference 2017, 26–27 October 2017, Melbourne, Australia
This contribution has been peer-reviewed.
https://doi.org/10.5194/isprs-archives-XLII-4-W7-27-2017 | © Authors 2017. CC BY 4.0 License.
Canopy Action Plan (PAC), VdM Parks Department wants to prevent formation of SUHI (Ville de Montreal, 2012). The knowledge in 3D of SUHIs, shadows of constructions, surface imperviousness and tree vegetation help their forestry specialists to plan tree planting for mitigation of urban heat islands and air pollution . In urban development projects, mitigation solutions come from green or white roofs, coating materials, number and arrangement of trees and building height.
Figure 10. Quartier des gares project is an example where urban planning could improve the current situation of SUHIs
The next phase of the project will result in the development of a computerized decision support system allowing the simulation of these environmental conditions in Montreal, applicable also to other major cities. 3D modeling of different scenarios will be valuable in forecasting critical situations in highly densified areas (ex.: Place des festivals site (QdS), Hippodrome project).
Figure 11. Thermal measurements of buildings facades with an infrared camera (Inf-Rec R300-Z) can be carried out at certain
sites for validation purposes 5. CONCLUSION
The results of this research act as a practical laboratory in the framework of the municipal activities, allowing a continuous validation of the researchers' approach. One of the objectives is to collect the same data for the entire territory of the city and
resample the same area in 7 to 10 years, to measure the effectiveness of mitigation measures applied.
REFERENCES
Bouroubi M.Y., 2009, REFLECT :logiciel des restitution des réflectances au sol pour l’amélioration de la qualité de l’information extraite des images satellitaires à haute résolution spatiale, Ph.D. thesis, Geographic Department, Universite de Montreal.
https://papyrus.bib.umontreal.ca/xmlui/bitstream/handle/1866/3 264/Bouroubi_Yacine_M_2009_these.pdf (2 july 2017).
Cavayas F., Pau-Corfa E., Suprenant J., 2013, Etude de cas de l’environnement thermique du campus de la Montagne de
l’Universite de Montreal, research project, Geographic
Department, Universite de Montreal.
Champagne, A.L., 2002, Environnement Canada, RNC.
CUDM, 2007, Developing canadian capabilities for CBRN hazard dispersion in urban areas, Canadian Meteorological Centre, Meteorological Service of Canada.
http://eer.cmc.ec.gc.ca/s_activites/s_crti/s_crti-02-0093rd/s_publications/CUDMsystem_v8_1nov2007.pdf (2 july 2017).
Lareau F. and Baudouin Y,, 2015, Évaluation et cartographie de la vulnérabilité à la chaleur dans l’agglomération de Montréal, The Canadian Geographer, Volume 59, Issue 2, Summer 2015, pp. 234-245.
Reeves F., Planet heart : how an unheathly environment leads to heart disease, Amazon.ca
https://www.amazon.com/Planet-Heart-Unhealthy-Environment-Disease/dp/1771000813 (2 july 2017).
Unger J., Thamas T., Rakonczai J., Mucsi L., Szatmari J. Tobakv Z., Van Leeuewn B., Fiala K., 2009, Air temperature versus
surface temperature in urban environment, The seventh
International Conference on Urban Climate, Yokohama, Japan, 29 june – 3 july 2009.
Ville de Montreal, 2012, Plan d’action canopée 2012-2021. http://ville.montreal.qc.ca/pls/portal/docs/PAGE/GRANDS_PA RCS_FR/MEDIA/DOCUMENTS/PAC_JUIN_2012_FINAL.P DF (2 july 2017).
Volet P., Letarte C., Leduc F., 2008, Dynameq à la Ville de Montreal: Le lien entre les modeles de planification regionale et la microsimulation, Ville de Montreal, Conference des usagers EMME, Ottawa-Gatineau (23 oct. 2008).
https://www.inrosoftware.com/assets/pres-pap/ottawa-gatineau/Dynameq_a_Montreal_Em2-Ottv2.pdf (2 july 2017). The International Archives of the Photogrammetry, Remote Sensing and Spatial Information Sciences, Volume XLII-4/W7, 2017
12th 3D Geoinfo Conference 2017, 26–27 October 2017, Melbourne, Australia
This contribution has been peer-reviewed.
https://doi.org/10.5194/isprs-archives-XLII-4-W7-27-2017 | © Authors 2017. CC BY 4.0 License.