Upper Saddle River, New Jersey Columbus, Ohio
Introduction to Materials
Management
S I X T H E D I T I O N
Editorial Assistant:Nancy Kesterson
Production Editor:Louise N. Sette
Production Supervision:GGS Book Services
Design Coordinator:Diane Ernsberger
Cover Designer:Jeff Vanik
Production Manager:Deidra M. Schwartz
Director of Marketing:David Gesell
Marketing Manager:Jimmy Stephens
Marketing Assistant:Alicia Dysert
This book was set by GGS Book Services. It was printed and bound by R. R. Donnelley & Sons Company. The cover was printed by Phoenix Color Corp.
Copyright © 2008, 2004, 2001, 1998, 1996, 1991 by Pearson Education, Inc., Upper Saddle River,
New Jersey 07458.Pearson Prentice Hall. All rights reserved. Printed in the United States of America. This publication is protected by Copyright and permission should be obtained from the publisher prior to any prohibited reproduction, storage in a retrieval system, or transmission in any form or by any means, electronic, mechanical, photocopying, recording, or likewise. For information regarding permission(s), write to: Rights and Permissions Department.
Pearson Prentice Hall™is a trademark of Pearson Education, Inc.
Pearson®is a registered trademark of Pearson plc.
Pearson Hall®is a registered trademark of Pearson Education, Inc.
Pearson Education Ltd. Pearson Education Australia Pty. Limited Pearson Education Singapore Pte. Ltd. Pearson Education North Asia Ltd. Pearson Education Canada, Ltd. Pearson Educación de Mexico, S.A. de C.V. Pearson Education—Japan Pearson Education Malaysia Pte. Ltd.
Introduction to Materials Managementis an introductory text written for students in community colleges and universities. It is used in technical programs, such as indus-trial engineering and manufacturing engineering; in business programs; and by those already in industry, whether or not they are working in materials management.
This text has been widely adopted by colleges and universities not only in North America but also in other parts of the world. APICS—The Association for Operations Management recommends this text as the reference for certification preparation for various CPIM examinations. In addition, the text is used by produc-tion and inventory control societies around the world, including South Africa, Australia, New Zealand, Germany, France, and Brazil, and by consultants who pre-sent in-house courses to their customers.
Introduction to Materials Managementcovers all the basics of supply chain man-agement, manufacturing planning and control systems, purchasing, and physical dis-tribution. The material, examples, questions, and problems lead the student logically through the text. The writing style is simple and user-friendly—both instructors and students who have used the book attest to this.
In the sixth edition, we have added the following:
• More content on Theory of Constraints (Chapter 6) • More content on supply chains (Chapter 7)
• More content on lean production (Chapter 15)
• Content on the use of technology in purchasing and warehousing (Chapters 7, 12)
• The effect of global logistics and reverse logistics (Chapter 13) • Six Sigma and QFD (Chapter 16)
• Small case studies at the end of several chapters
• PowerPoint slides to accompany all the chapters (an online resource for instructors)
In addition, we have retained several features from previous editions:
• Margin icons to note key concepts
• Key terms listed at the end of each chapter • Example problems within the chapters • Chapter summaries
• Questions and problems at the end of each chapter
APPROACH AND ORGANIZATION
Materials management means different things to different people. In this textbook, materials management includes all activities in the flow of materials from the supplier to the consumer. Such activities include physical supply, operations planning and con-trol, and physical distribution. Other terms sometimes used in this area are business logisticsandsupply chain management. Often, the emphasis in business logistics is on transportation and distribution systems with little concern for what occurs in the fac-tory. Whereas some chapters in this text are devoted to transportation and distribu-tion, emphasis is placed on operations planning and control.
Distribution and operations are managed by planning and controlling the flow of materials through them and by using the system’s resources to achieve a desired customer service level. These activities are the responsibility of materials manage-ment and affect every departmanage-ment in a manufacturing business. If the materials management system is not well designed and managed, the distribution and manufac-turing system will be less effective and more costly. Anyone working in manufacmanufac-turing or distribution should have a good basic understanding of the factors influencing materials flow. This text aims to provide that understanding.
ONLINE INSTRUCTOR RESOURCES
To access supplementary materials online, instructors need to request an instructor access code. Go to www.prenhall.com, click the Instructor Resource Centerlink, and then click Register Todayfor an instructor access code. Within 48 hours after regis-tering you will receive a confirming e-mail including an instructor access code. Once you have received your code, go to the site and log on for full instructions on down-loading the materials you wish to use.
ACKNOWLEDGMENTS
Help and encouragement have come from a number of valued sources, among them friends, colleagues, and students. We thank the faculty of other colleges and the many members of APICS chapters who continue to offer their support and helpful advice. Many thanks to those who reviewed the fifth edition and provided suggestions for the sixth edition, including members of the APICS Basics of Supply Chain Management Certification Committee: Jim Caruso (Chair) of Tyco Healthcare; Carol Bulfer, Parker Hanninfin Corp.; William Leedale, IFS; and Angel Sosa, University of Puerto Rico at Bayamon. Academic reviewers included Sheila E. Rowe, North Carolina A&T State University; David Lucero, Greenville Technical College; Floyd Olson, Utah Valley State College; Ralph G. Kauffman, University of Houston—Downtown; Ronald J. Baker, Shoreline Community College; and Richard E. Crandall, Appalachian State University.
Tony Arnold thanks his wife, Vicky Arnold, for her assistance throughout the years of writing and revising this text, and Steve Chapman thanks his wife, Jeannine, for her support as well. Lloyd Clive thanks his wife, Kathleen, for her continued support.
Overall, this book is dedicated to those who have taught us the most—our students.
J. R. Tony Arnold, Professor Emeritus, CFPIM, CIRM Fleming College
Peterborough, Ontario
Stephen N. Chapman, Ph.D., CFPIM, Associate Professor Department of Business Management, College of Management North Carolina State University
Raleigh, North Carolina
Lloyd M. Clive, CFPIM
Coordinator Materials Management and Distribution School of Business
CHAPTER 1 Introduction to Materials Management 1
Introduction 1
Operating Environment 2 The Supply Chain Concept 5 What Is Materials Management? 10 Supply Chain Metrics 15
Summary 17 Key Terms 17 Questions 17 Problems 18
CHAPTER 2 Production Planning System 20
Introduction 20
Manufacturing Planning and Control System 21 Sales and Operations Planning 26
Manufacturing Resource Planning 28 Enterprise Resource Planning 29 Making the Production Plan 30 Summary 42
Key Terms 42 Questions 43 Problems 44
CHAPTER 3 Master Scheduling 49
Introduction 49
Relationship to Production Plan 50
Developing a Master Production Schedule 53
Production Planning, Master Scheduling, and Sales 60 Summary 67
Key Terms 67 Questions 68 Problems 68
Case Study: Acme Water Pumps 76
CHAPTER 4 Material Requirements Planning 77
Introduction 77 Bills of Material 81
Material Requirements Planning Process 89 Using the Material Requirements Plan 102 Summary 107
Key Terms 108 Questions 108 Problems 109
Case Study: Apix Polybob Company 123
CHAPTER 5 Capacity Management 125
Introduction 125
Definition of Capacity 125 Capacity Planning 127
Capacity Requirements Planning (CRP) 128 Capacity Available 130
Capacity Required (Load) 135 Scheduling Orders 138 Making the Plan 141 Summary 142 Key Terms 143 Questions 144 Problems 144
Case Study: Wescott Products 149
CHAPTER 6 Production Activity Control 153
Introduction 153 Data Requirements 157 Order Preparation 159 Scheduling 159 Load Leveling 166
Theory of Constraints and Drum-Buffer-Rope 170 Implementation 172
Control 174
Production Reporting 180 Summary 181
Key Terms 181 Questions 181 Problems 183
Case Study: Johnston Products 189
CHAPTER 7 Purchasing 191
Introduction 191
Establishing Specifications 195
Functional Specification Description 198 Selecting Suppliers 200
Price Determination 204
Impact of Material Requirements Planning on Purchasing 207 Expansion of Purchasing Into Supply Chain
Management 209
Some Organizational Implications of Supply Chain Management 211
Key Terms 212 Questions 212 Problems 213
Case Study: Let’s Party! 214
CHAPTER 8 Forecasting 216
Introduction 216
Demand Management 217 Demand Forecasting 218 Characteristics of Demand 218 Principles of Forecasting 221
Collection and Preparation of Data 222 Forecasting Techniques 223
Some Important Intrinsic Techniques 224 Seasonality 229
Tracking the Forecast 233 Summary 241
Key Terms 241 Questions 242 Problems 242
CHAPTER 9 Inventory Fundamentals 254
Introduction 254
Aggregate Inventory Management 255 Item Inventory Management 255 Inventory and the Flow of Material 256 Supply and Demand Patterns 257 Functions of Inventories 257
Objectives of Inventory Management 259 Inventory Costs 261
Financial Statements and Inventory 265 ABC Inventory Control 270
Summary 274 Key Terms 275 Questions 275 Problems 276
CHAPTER 10 Order Quantities 281
Introduction 281
Economic-Order Quantity (EOQ) 282 Variations of the EOQ Model 288 Quantity Discounts 290
Order Quantities for Families of Product When Costs Are Not Known 291
Period-Order Quantity (POQ) 293 Summary 295
Key Terms 296 Questions 296 Problems 297
Case Study: Carl’s Computers 301
CHAPTER 11 Independent Demand Ordering Systems 304
Introduction 304 Order Point System 305 Determining Safety Stock 307 Determining Service Levels 315
Different Forecast and Lead-Time Intervals 316 Determining When the Order Point Is Reached 318 Periodic Review System 320
Distribution Inventory 322 Key Terms 326
CHAPTER 12 Physical Inventory and Warehouse Management 335
Introduction 335
Warehousing Management 336 Physical Control and Security 342 Inventory Record Accuracy 343 Technology Applications 350 Key Terms 351
Questions 351 Problems 352
Case Study: CostMart Warehouse 356
CHAPTER 13 Physical Distribution 360
Introduction 360
Physical Distribution System 364 Interfaces 367
Transportation 368
Legal Types of Carriage 371 Transportation Cost Elements 372 Warehousing 376
Packaging 383
Materials Handling 384 Multi-Warehouse Systems 386 Key Terms 389
Questions 389 Problems 391
Case Study: Metal Specialists, Inc. 393
CHAPTER 14 Products and Processes 394
Introduction 394
Need for New Products 394
Product Development Principles 396 Product Specification and Design 398 Process Design 401
Factors Influencing Process Design 402 Processing Equipment 403
Process Systems 404 Selecting the Process 407
Continuous Process Improvement (CPI) 410 Key Terms 423
CHAPTER 15 Just-in-Time Manufacturing and Lean Production 429
Introduction 429
Just-in-Time Philosophy 430 Waste 431
Just-in-Time Environment 434
Manufacturing Planning and Control in a JIT Environment 443 Lean Production 454
Which to Choose—MRP (ERP), Kanban, or Theory of Constraints? 456 Summary 458
Key Terms 459 Questions 459 Problems 460
Case Study: Murphy Manufacturing 462
CHAPTER 16 Total Quality Management 465
What Is Quality? 465
Total Quality Management (TQM) 468 Quality Cost Concepts 472
Variation as a Way of Life 473 Process Capability 476 Process Control 480 Sample Inspection 484 ISO 9000:2000 486 Benchmarking 489
Quality Function Deployment 491 JIT, TQM, and MRP II 493 Key Terms 494
Questions 495 Problems 495
Case Study: Accent Oak Furniture Company 498
Readings 503
INTRODUCTION
The wealth of a country is measured by its gross national product—the output of goods and services produced by the nation in a given time. Goods are physical objects, something we can touch, feel, or see. Services are the performance of some useful function such as banking, medical care, restaurants, clothing stores, or social services.
But what is the source of wealth? It is measured by the amount of goods and services produced, but where does it come from? Although we may have rich natural resources in our economy such as mineral deposits, farmland, and forests, these are only potential sources of wealth. A production function is needed to transform our resources into useful goods. Production takes place in all forms of transformation— extracting minerals from the earth, farming, lumbering, fishing, and using these resources to manufacture useful products.
There are many stages between the extraction of resource material and the final consumer product. At each stage in the development of the final product, value is added, thus creating more wealth. If ore is extracted from the earth and sold, wealth is gained from our efforts, but those who continue to transform the raw material will gain more and usually far greater wealth. Japan is a prime example of this. It has very few natural resources and buys most of the raw materials it needs. However, the Japanese have developed one of the wealthiest economies in the world by transform-ing the raw materials they purchase and addtransform-ing value to them through manufacturtransform-ing.
1
1
Manufacturing companies are in the business of converting raw materials to a form that is of far more value and use to the consumer than the original raw materi-als. Logs are converted into tables and chairs, iron ore into steel, and steel into cars and refrigerators. This conversion process, called manufacturingorproduction, makes a society wealthier and creates a better standard of living.
To get the most value out of our resources, we must design production processes that make products most efficiently. Once the processes exist, we need to manage their operation so they produce goods most economically. Managing the operation means planning for and controlling the resources used in the process: labor, capital, and material. All are important, but the major way in which manage-ment plans and controls is through the flow of materials. The flow of materials con-trols the performance of the process. If the right materials in the right quantities are not available at the right time, the process cannot produce what it should. Labor and machinery will be poorly utilized. The profitability, and even the existence, of the company will be threatened.
OPERATING ENVIRONMENT
Operations management works in a complex environment affected by many factors. Among the most important are government regulation, the economy, competition, customer expectations, and quality.
Government. Regulation of business by the various levels of government is exten-sive. Regulation applies to such areas as the environment, safety, product liability, and taxation. Government, or the lack of it, affects the way business is conducted.
Economy. General economic conditions influence the demand for a company’s products or services and the availability of inputs. During economic recession the demand for many products decreases while others may increase. Materials and labor shortages or surpluses influence the decisions management makes. Shifts in the age of the population, needs of ethnic groups, low population growth, freer trade between countries, and increased global competition all contribute to changes in the marketplace.
Competition. Competition is severe today.
• Manufacturing companies face competition from throughout the world. They find foreign competitors selling in their markets even though they themselves may not be selling in foreign markets. Companies also are resorting more to worldwide sourcing.
• Worldwide communications are fast, effective, and cheap. Information and data can be moved almost instantly halfway around the globe. The Internet allows buyers to search out new sources of supply from anywhere in the world as easily as they can from local sources.
Customers. Both consumers and industrial customers have become much more demanding, and suppliers have responded by improving the range of characteristics they offer. Some of the characteristics and selection customers expect in the products and services they buy are:
• A fair price.
• Higher-(right) quality products and services. • Delivery lead time.
• Better presale and after-sale service. • Product and volume flexibility.
Quality. Since competition is international and aggressive, successful companies provide quality that not only meets customers’ high expectations but exceeds them. Chapter 16 discusses quality in detail.
Order qualifiers and order winners. Generally a supplier must meet set mini-mum requirements to be considered a viable competitor in the marketplace. Customer requirements may be based on price, quality, delivery, and so forth and are calledorder qualifiers. For example, the price for a certain type of product must fall within a range for the supplier to be considered. But being considered does not mean winning the order. To win orders a supplier must have characteristics that encourage customers to choose its products and services over competitors’. Those competitive characteristics, or combination of characteristics, that persuade a company’s cus-tomers to choose its products or services are called order winners. They provide a competitive advantage for the firm. Order winners change over time and may well be different for different markets. For example, fast delivery may be vital in one market but not in another. Characteristics that are order winners today probably will not remain so, because competition will try to copy winning characteristics, and the needs of customers will change.
It is very important that a firm understands the order winners and order quali-fiers for each of their products and in each of their markets because they should drive the manufacturing strategy. Since it is virtually impossible to be the best in every dimension of competition, firms should in general strive to provide at least a minimal level of acceptance for each of the order qualifiers but should try to be the bestin the market for the order winner(s).
Delivery Lead Time
Delivery Lead Time
DESIGN PURCHASE MANUFACTURE ASSEMBLE SHIP
MANUFACTURE ASSEMBLE SHIP INVENTORY
Delivery Lead Time
MANUFACTURE INVENTORY ASSEMBLE SHIP
Delivery Lead Time
MANUFACTURE ASSEMBLE INVENTORY SHIP
ENGINEER-TO-ORDER
MAKE-TO-ORDER
ASSEMBLE-TO-ORDER
MAKE-TO-STOCK
Figure 1.1 Manufacturing strategy and lead time.
implies that most products go through a life cycle, including introduction, growth, maturity, and decline. For example, in the introduction phase, design and availability are often much more important than price. Quality and delivery tend to have increased importance during growth, while price and delivery are often the order winners for mature products. This life cycle approach is complicated in that the dura-tion of the life cycle will be very different for different products. Although some prod-ucts have life cycles many years long, other prodprod-ucts (certain toys or electronics, for example) can be measured in months or even weeks.
Manufacturing Strategy
A highly market-oriented company will focus on meeting or exceeding customer expectations and on order winners. In such a company all functions must contribute toward a winning strategy. Thus, operations must have a strategy that allows it to supply the needs of the marketplace and provide fast on-time delivery.
Delivery lead time. From the supplier’s perspective, this is the time from receipt of an order to the delivery of the product. From the customer’s perspective it may also include time for order preparation and transmittal. Customers want delivery lead time to be as short as possible, and manufacturing must design a strategy to achieve this. There are four basic strategies: engineer-to-order, make-to-order, assemble-to-order, and make-to-stock. Customer involvement in the product design, delivery lead time, and inventory state are influenced by each strategy. Figure 1.1 shows the effect of each strategy.
MANUFACTURER DISTRIBUTION
DOMINANT FLOW OF PRODUCTS AND SERVICES
DOMINANT FLOW OF DEMAND AND DESIGN INFORMATION S
involved in the product design. Inventory will not normally be purchased until needed by manufacturing. Delivery lead time is long because it includes not only purchase lead time but design lead time as well.
Make-to-ordermeans that the manufacturer does not start to make the product until a customer’s order is received. The final product is usually made from standard items but may include custom-designed components as well. Delivery lead time is reduced because there is little design time required and inventory is held as raw material.
Assemble-to-ordermeans that the product is made from standard components that the manufacturer can inventory and assemble according to a customer order. Delivery lead time is reduced further because there is no design time needed and inventory is held ready for assembly. Customer involvement in the design of the prod-uct is limited to selecting the component part options needed.
Make-to-stockmeans that the supplier manufactures the goods and sells from finished goods inventory. Delivery lead time is shortest. The customer has little direct involvement in the product design.
THE SUPPLY CHAIN CONCEPT
customer may have several suppliers and may in turn supply several customers. As long as there is a chain of supplier/customer relationships, they are all members of the same supply chain.
There are a number of important factors in supply chains:
• The supply chain includes all activities and processes to supply a product or service to a final customer.
• Any number of companies can be linked in the supply chain.
• A customer can be a supplier to another customer so the total chain can have a number of supplier/customer relationships.
• Although the distribution system can be direct from supplier to customer, depending on the products and markets, it can contain a number of intermedi-aries (distributors) such as wholesalers, warehouses, and retailers.
• Product or services usually flow from supplier to customer and design, and demand information usually flows from customer to supplier. Rarely is this not so.
Although these systems vary from industry to industry and company to company, the basic elements are the same: supply, production, and distribution. The relative importance of each depends on the costs of the three elements.
Supply Chain Concepts
In recent years there has been a great deal of attention to the concept of supply chain management (SCM). It is important to understand the fundamental issues behind this movement, as well as the impact on materials management.
Historical perspective. In the past, many company managers placed most of their attention on the issues that were internal to their companies. Of course they were aware of the impact of suppliers, customers, and distributors, but those entities were often viewed as business entities only. Specialists in purchasing, sales, and logistics were assigned to “deal” with those outside entities, often through formal legal con-tracts that were negotiated regularly and represented short-term agreements. For example, suppliers were often viewed as business adversaries. A key responsibility of a purchasing agent was to negotiate the best financial and delivery conditions from a supplier, whose job was to maximize his company’s profit. Organization theorists often called the functions that dealt with outside entities boundary spanners, indicat-ing that for most people in the organization there were well-defined and rigid bound-aries between their organization and the rest of the world.
linked destinies, in that the success of each was linked to the success of the other. Great emphasis was put on trust between the partners, and many of the formal boundary mechanisms, such as the receiving/inspection activity of incoming parts, were changed or eliminated altogether. As the partnership concept grew, there were many other changes in the relationship including:
• Mutual analysis for cost reduction. Both parties examined the process used to transmit information and deliver parts, with the idea that cost reductions would be shared between the two parties.
• Mutual product design. In the past the customer often submitted complete designs to the supplier who was obligated to produce according to design. With partnering, both companies worked together. Often the supplier would know more about how to make a specific product, whereas the customer would know more about the application for which the design was intended. Together, they could probably produce a superior design compared to what either could do alone.
• With JIT, the concept of greatly reduced inventory in the process and the need for rapid delivery according to need, the speed of accurate information flow became critical. Formal paper-based systems gave way to electronic data inter-change and informal communication methods.
The growth of the supply chain concept. As the 1980s gave way to the 1990s, the world continued to change, forcing additional modifications to the trend:
• There has been explosive growth in computer capability and associated soft-ware applications. Highly effective and integrated systems such as enterprise resource planning (ERP) and the ability to link companies electronically (through the Internet, for example) have allowed companies to share large amounts of information quickly and easily. The ability to have the information rapidly has become a competitive necessity for many companies.
• There has been a large growth in global competition. Very few companies can still say they have only local competition, and many of the global competi-tors are forcing existing companies to find new ways to be successful in the marketplace.
• There has been a growth in technological capabilities for products and processes. Product life cycles for many products are shrinking rapidly, forcing companies to not only become more flexible in design but also to communicate changes and needs to suppliers and distributors.
• The changes prompted by JIT in the 1980s have continued to mature, so that by now many companies have new approaches to interorganizational relationships as a normal form of business.
SILICON PRODUCTION
COMPUTER PRODUCTION PRINTED CIRCUIT
BOARD PRODUCTION INTEGRATED
CIRCUIT (CHIP) PRODUCTION
DISTRIBUTOR RETAILER CUSTOMER DISPOSAL
What is the current supply chain concept? Companies currently adopting the supply chain concept view the entire set of activities from raw material production to final customer purchase to final disposal as a linked chain of activities. To result in optimal performance for customer service and cost, it is felt that the supply chain of activities should be managed as an extension of the partnership. This implies many issues, but three critical ones include:
1. Flow of materials.
2. Flow of information and sharing of information, mostly through the Internet. 3. Fund transfers.
In addition, a new trend is to manage the recovery, recycling, and reuse of material. The primary supply chain management approach is a conceptual one. All por-tions of the material production, from raw materials to final customer, are considered to be a linked chain. The most efficient and effective way to manage the activities along the chain is to view each separate organization in the chain as an extension of one’s own organization. There can be many organizations in a supply chain. Take as an example the chain of organizations that represent the flow from raw silicon used to make computer chips to the delivery and disposal of the computer itself:
What is illustrated here is but one chain of a set of different component chains that represent a network of suppliers and distributors for a product.
To manage a supply chain, one must not only understand the network of suppli-ers and customsuppli-ers along the chain but must also try to efficiently plan material and information flows along each chain to maximize cost efficiency, effectiveness, delivery, and flexibility. This clearly not only implies taking a different conceptual approach to suppliers and customers but also implies a highly integrated information system and a different set of performance measures. Overall, the key to managing such a concept is with rapid flows of accurate information and increased organizational flexibility.
Conflicts in Traditional Systems
considering the effect they would have on other parts of the system. Because the three systems are interrelated, conflicts often occurred. Although each system made decisions that were best for itself, overall company objectives suffered. For example, the transportation department would ship in the largest quantities possible so it could minimize per-unit shipping costs. However, this increased inventory and resulted in higher inventory-carrying costs.
To get the most profit, a company must have at least four main objectives:
1. Provide best customer service. 2. Provide lowest production costs. 3. Provide lowest inventory investment. 4. Provide lowest distribution costs.
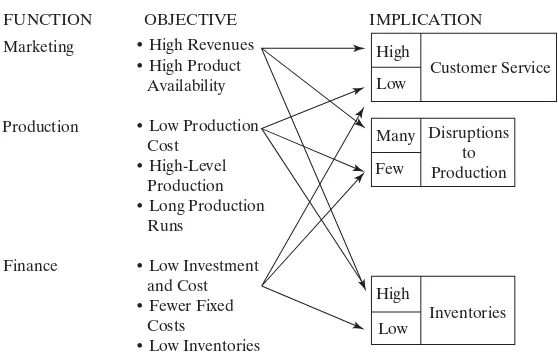
These objectives create conflict among the marketing, production, and finance departments because each has different responsibilities in these areas.
Marketing’s objective is to maintain and increase revenue; therefore, it must provide the best customer service possible. There are several ways of doing this:
• Maintain high inventories so goods are always available for the customer. • Interrupt production runs so that a noninventoried item can be manufactured
quickly.
• Create an extensive and costly distribution system so goods can be shipped to the customer rapidly.
Finance must keep investment and costs low. This can be done in the following ways:
• Reduce inventory so inventory investment is at a minimum. • Decrease the number of plants and warehouses.
• Produce large quantities using long production runs. • Manufacture only to customer order.
Production must keep its operating costs as low as possible. This can be done in the following ways:
• Make long production runs of relatively few products. Fewer changeovers will be needed and specialized equipment can be used, thus reducing the cost of making the product.
• Maintain high inventories of raw materials and work-in-process so production is not disrupted by shortages.
FUNCTION OBJECTIVE IMPLICATION
Today the concepts of JIT manufacturing stress the need to supply customers with what they want when they want it and to keep inventories at a minimum. These objectives put further stress on the relationship among production, marketing, and finance. Chapter 15 will discuss the concepts of JIT manufacturing and how it influ-ences materials management.
One important way to resolve these conflicting objectives is to provide close coordination of the supply, production, and distribution functions. The problem is to balance conflicting objectives to minimize the total of all the costs involved and max-imize customer service consistent with the goals of the organization. This requires some type of integrated materials management or logistics organization that is responsible for supply, production, and distribution. Rather than having the planning and control of these functions spread among marketing, production, and distribution, they should occur in a single area of responsibility.
WHAT IS MATERIALS MANAGEMENT?
The concept of having one department responsible for the flow of materials, from supplier through production to consumer, is relatively new. Although many compa-nies have adopted this type of organization, there are still a number that have not. If companies wish to minimize total costs in this area and provide a better level of customer service, they will move in this direction.
Materials management is a coordinating function responsible for planning and controlling materials flow. Its objectives are as follows:
• Maximize the use of the firm’s resources. • Provide the required level of customer service.
Materials management can do much to improve a company’s profit. An income (profit and loss) statement for a manufacturing company might look something like the following:
Dollars Percent of Sales
Revenue (sales) $1,000,000 100
Cost of Goods Sold
Direct Material $500,000 50
Direct Labor $200,000 20
Factory Overhead $200,000 20
Total Cost of Goods Sold $900,000 90
Gross Profit $100,000 10
Direct labor and direct material are costs that increase or decrease with the quantity sold. Overhead (all other costs) does not vary directly with sales. For sim-plicity this section assumes overhead is constant, even though it is initially expressed as a percentage of sales.
If, through a well-organized materials management department, direct mate-rials can be reduced by 10% and direct labor by 5%, the improvement in profit would be:
Dollars Percent of Sales
Revenue (sales) $1,000,000 100
Cost of Goods Sold
Direct Material $450,000 45
Direct Labor $190,000 19
Overhead $200,000 20
Total Cost of Goods Sold $840,000 84
Gross Profit $160,000 16
Profit has been increased by 60%. To get the same increase in profit ($60,000) by increasing revenue, sales would have to increase to $1.2 million.
Dollars Percent of Sales
Revenue (sales) $1,200,000 100
Cost of Goods Sold
Direct Material $600,000 50
Direct Labor $240,000 20
Overhead $200,000 17
Total Cost of Goods Sold $1,040,000 87
EXAMPLE PROBLEM
a.If the cost of direct material is 60%, direct labor is 10%, and overhead is 25% of sales, what will be the improvement in profit if direct material is reduced to 55%?
b.How much will sales have to increase to give the same increase in profit? (Remember, overhead cost is constant.)
Answer
a. Before Improvement After improvement
Revenue (sales) 100% 100%
Cost of Goods Sold
Direct Material 60% 55%
Direct Labor 10% 10%
Overhead 25% 25%
Total Cost of Goods Sold 95% 90%
Gross Profit 5% 10%
b.
Sales must increase 17% to give the same increase in profit.
Work-in-Process
Inventory not only makes up a portion of the cost of goods sold but has to be purchased at the beginning of production to be processed into finished goods. This type of inventory is called work-in-process (WIP). WIP is a major investment for many companies, and reducing the amount of time that inventory spends in production is a good way to reduce the costs associated with this investment. Labor, materials and overhead are applied to goods continuously throughout production and the value of the WIP is estimated to be one half the final value. Further discus-sion on WIP and reducing it is covered in Chapters 9 and 15.
EXAMPLE PROBLEM
On the average, a company has 12 weeks of WIP inventory and annual cost of goods sold of $36 million. Assuming the company works 50 weeks per year:
a.What is the dollar value of the WIP?
b.If the WIP could be reduced to 5 weeks, and the annual cost of carrying inven-tory was 20% of the inveninven-tory value, what would be the annual savings?
Sales = 0.350.3 = 1.17 0.3 Sales = 0.35
.1 = 0.3 sales - 0.25
= sales - 0.7 sales - 0.25
= sales - 10.6 sales + 0.1 sales + 0.252
Answer
Reducing cost contributes directly to profit. Increasing sales increases direct costs of labor and materials so profit does not increase directly. Materials manage-ment can reduce costs by being sure that the right materials are in the right place at the right time and the resources of the company are properly used.
There are several ways of classifying this flow of material. A very useful classifi-cation, and the one used in this text, is manufacturing planning and control and phys-ical supply/distribution.
Manufacturing Planning and Control
Manufacturing planning and control are responsible for the planning and control of the flow of materials through the manufacturing process. The primary activities car-ried out are as follows:
1. Production planning.Production must be able to meet the demand of the mar-ketplace. Finding the most productive way of doing so is the responsibility of pro-duction planning. It must establish correct priorities (what is needed and when) and make certain that capacity is available to meet those priorities. It will involve:
a. Forecasting. b. Master planning.
c. Material requirements planning. d. Capacity planning.
2. Implementation and control.These are responsible for putting into action and achieving the plans made by production planning. These responsibilities are accomplished through production activity control (often called shop floor con-trol) and purchasing.
3. Inventory management.Inventories are materials and supplies carried on hand either for sale or to provide material or supplies to the production process. They are part of the planning process and provide a buffer against the differ-ences in demand rates and production rates.
Production planning, implementation, control, and inventory management work together. Inventories in manufacturing are used to support production or are the result of production. Only if items are purchased and resold without further
Annual Savings = $2,520,000 * 20% = $504,000 Reduction in WIP = $4,320,000 - $1,800,000 = $2,520,000 Value of 5 Weeks WIP = 5 weeks * $720,000>week * 1>2 = $1,800,000
Value of 12 Weeks WIP = 12 weeks * $720,000>week * 1>2 = $4,320,000 = $720,000/week
processing can inventory management operate separately from production planning and control. Even then, it cannot operate apart from purchasing.
Inputs to the manufacturing planning and control system. There are five basic inputs to the manufacturing planning and control system:
1. Theproduct descriptionshows how the product will appear at some stage of production.Engineering drawingsandspecificationsare methods of describing the product. Another method, and the most important for manufacturing plan-ning and control, is the bill of material. As used in materials management, this document does two things:
• Describes the components used to make the product.
• Describes the subassemblies at various stages of manufacture.
2. Process specificationsdescribe the steps necessary to make the end product. They are a step-by-step set of instructions describing how the product is made. This information is usually recorded on a route sheet or in a routing file. These are documents or computer files that give information such as the following on the manufacture of a product:
• Operations required to make the product. • Sequence of operations.
• Equipment and accessories required.
• Standard time required to perform each operation.
3. Thetime needed to perform operationsis usually expressed in standard time which is the time taken by an average operator, working at a normal pace, to perform a task. It is needed to schedule work through the plant, load the plant, make delivery promises, and cost the product. Usually, standard times for oper-ations are obtained from the routing file.
4. Available facilities.Manufacturing planning and control must know what plant, equipment, and labor will be available to process work. This information is usu-ally found in the work center file.
5. Quantities required.This information will come from forecasts, customer orders, orders to replace finished-goods inventory, and the material requirements plan.
Physical Supply/Distribution
Physical supply/distribution includes all the activities involved in moving goods, from the supplier to the beginning of the production process, and from the end of the pro-duction process to the consumer.
The activities involved are as follows:
• Packaging.
• Materials handling. • Order entry.
Materials management is a balancing act. The objective is to be able to deliver what customers want, when and where they want it, and do so at minimum cost. To achieve this objective, materials management must make trade-offs between the level of customer service and the cost of providing that service. As a rule, costs rise as the ser-vice level increases, and materials management must find that combination of inputs to maximize service and minimize cost. For example, customer service can be improved by establishing warehouses in major markets. However, that causes extra cost in operating the warehouse and in the extra inventory carried. To some extent, these costs will be off-set by potential savings in transportation costs if lower cost transportation can be used. By grouping all those activities involved in the movement and storage of goods into one department, the firm has a better opportunity to provide maximum service at minimum cost and to increase profit. The overall concern of materials manage-ment is the balance between priority and capacity. The marketplace sets demand. Materials management must plan the firm’s priorities (what goods to make and when) to meet that demand. Capacity is the ability of the system to produce or deliver goods. Priority and capacity must be planned and controlled to meet customer demand at minimum cost. Materials management is responsible for doing this.
SUPPLY CHAIN METRICS
Ametricis a verifiable measure stated in either quantitative or qualitative terms defined with respect to a reference point. Without metrics, no firm could expect to function effectively or efficiently on a daily basis. Metrics give us:
1. Control by superiors.
2. Reporting of data to superiors and external groups. 3. Communication.
4. Learning. 5. Improvement.
Metrics communicate expectations, identify problems, direct a course of action, and motivate people. Building the right metrics is vital to a company. Problems must be anticipated and corrective action taken before they become severe. Thus, compa-nies cannot risk waiting to react until the order cycle is completed and feedback from customers is received.
Today production control works in a demanding environment shaped by six major challenges:
1. Customers that are never satisfied.
Strategic Metrics
Strategy Focus
Operational
Customer Standard
Figure 1.4 Metrics context.
3. A product life cycle that is getting shorter and shorter. 4. A vast amount of data.
5. An emphasis on profit margins that are more squeezed. 6. An increasing number of alternatives.
A firm has a corporate strategy that states how it will treat its customers and what services it will supply. This identifies how a firm will compete in the market-place. It is the customer who assesses the firm’s offering by its decision to buy or not to buy. Metrics link strategy to operations. Finally, the two are brought together by metrics. Figure 1.4 shows this graphically.
The right-hand side of the figure deals with operations and with the implemen-tation and use of metrics. Focus describes the particular activity that is to be measured. Standards are the yardstick that is the basis of comparison on which performance is judged.
There is a difference between measurement and standards. A performance measuremust be both quantified and objective and contain at least two parameters. For example, the number of orders per day consists of both a quantity and a time measurement.
Transforming company policies into objectives and specific goals creates performance standards. Each goal should have target values. An example of this would be to improve order fill rate to 98% measured by number of lines. Performance standards set the goal, while performance measures say how close you came.
Many companies do not realize the potential benefits of performance measure-ment, nor do they know how to measure performance. It can be used without perfor-mance standards. This might occur when the concept of perforperfor-mance measurement and standards is new. When standards are put into use, management can begin to monitor the company. The old saying, “What you do not measure, you cannot control,” is as valid today as it was when first stated.
The necessary steps in implementing such a program are:
1. Establish company goals and objectives. 2. Define performance.
3. State the measurement to be used. 4. Set performance standards. 5. Educate the user.
6. Make sure the program is consistently applied.
increase in standards. Emphasis should not be placed on a “one-shot” improvement but on such things as the rate of improvement in quality, cost, reliability, innovation, effectiveness, and productivity.
SUMMARY
Manufacturing creates wealth by adding value to goods. To improve productivity and wealth, a company must first design efficient and effective systems for manufacturing. It must then manage these systems to make the best use of labor, capital, and mate-rial. One of the most effective ways of doing this is through the planning and control of the flow of materials into, through, and out of manufacturing. There are three elements to a material flow system: supply, manufacturing planning and control, and physical distribution. They are connected, and what happens in one system affects the others.
Traditionally, there are conflicts in the objectives of a company and in the objec-tives of marketing, finance, and production. The role of materials management is to balance these conflicting objectives by coordinating the flow of materials so customer service is maintained and the resources of the company are properly used.
This text will examine some of the theory and practice considered to be part of the “body of knowledge” as presented by the Association for Operations Management (APICS). Chapter 15 will study the concepts of Just-in-Time manufacturing to see how they affect the practice of materials management.
KEY TERMS
1. What is wealth, and how is it created?
2. What is value added, and how is it achieved?
3. Name and describe four major factors affecting operations management.
5. Describe the four primary manufacturing strategies. How does each affect delivery lead time?
6. What is a supply chain? Describe five important factors in supply chains.
7. What must manufacturing management do to manage a process or operation? What is the major way in which management plans and controls?
8. Name and describe the three main divisions of supply, production, and distribution systems.
9. What are the four objectives of a firm wishing to maximize profit?
10. What is the objective of marketing? What three ways will help it achieve this objective?
11. What are the objectives of finance? How can these objectives be met?
12. What are the objectives of production? How can these objectives be met?
13. Describe how the objectives of marketing, production, and finance are in conflict over customer service, disruption to production, and inventories.
14. What is the purpose of materials management?
15. Name and describe the three primary activities of manufacturing planning and control.
16. Name and describe the inputs to a manufacturing planning and control system.
17. What are the six activities involved in the physical supply/distribution system?
18. Why can materials management be considered a balancing act?
19. What are metrics? What are their uses?
20. A computer carrying case and a backpack are familiar items to a student of manufactur-ing plannmanufactur-ing and control. Discuss the manufacturmanufactur-ing plannmanufactur-ing and control activities involved in producing a variety of these products. What information from other depart-ments is necessary for manufacturing planning and control to perform its function?
PROBLEMS
1.1 If the cost of manufacturing (direct material and direct labor) is 60% of sales and profit is 10% of sales, what would be the improvement in profit if, through better planning and control, the cost of manufacturing was reduced from 60% of sales to 50% of sales?
Answer. Profits would improve by 100%.
1.2 In problem 1.1, how much would sales have to increase to provide the same increase in profits?
Answer. Sales would have to increase 25%.
1.3 On the average, a firm has 10 weeks of work-in-process, and annual cost of goods sold is $15 million. Assuming that the company works 50 weeks a year:
a. What is the dollar value of the work-in-process?
b. If the work-in-process could be reduced to 7 weeks and the annual cost of carrying inventory was 20% of the inventory value, what would be the annual saving? Answer. a. $1,500,000
1.4 On the average, a company has 12 weeks of work-in-process and annual cost of goods sold of $40 million. Assuming that the company works 50 weeks a year:
a. What is the dollar value of the work-in-process?
b. If the work-in-process could be reduced to 5 weeks and the annual cost of carrying inventory was 20% of the inventory value, what would be the annual saving?
1.5 Amalgamated Fenderdenter’s sales are $10 million. The company spends $3.5 million for purchase of direct materials and $2.5 million for direct labor; overhead is $3.5 million and profit is $500,000. Direct labor and direct material vary directly with the cost of goods sold, but overhead does not. The company wants to double its profit.
a. By how much should the firm increase sales?
b. By how much should the firm decrease material costs?
20
INTRODUCTION
This chapter introduces the manufacturing planning and control system. First, it deals with the total system and then with some details involved in production planning. Subsequent chapters discuss master scheduling, material requirements planning, capacity management, production activity control, purchasing, and forecasting.
Manufacturing is complex. Some firms make a few different products, whereas others make many products. However, each uses a variety of processes, machinery, equip-ment, labor skills, and material. To be profitable, a firm must organize all these factors to make the right goods at the right time at top quality and do so as economically as possible. It is a complex problem, and it is essential to have a good planning and control system.
A good planning system must answer four questions:
1. What are we going to make? 2. What does it take to make it? 3. What do we have?
4. What do we need?
These are questions of priority and capacity.
Priorityrelates to what products are needed, how many are needed, and when they are needed. The marketplace establishes the priorities. Manufacturing is respon-sible for devising plans to satisfy the market demand if posrespon-sible.
2
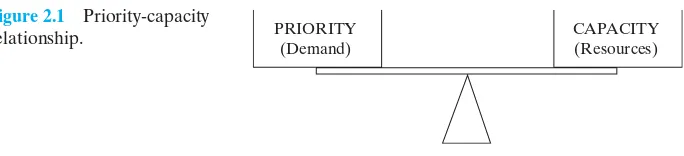
Capacity is the capability of manufacturing to produce goods and services. Eventually it depends on the resources of the company—the machinery, labor, and financial resources, and the availability of material from suppliers. In the short run, capacity is the quantity of work that labor and equipment can perform in a given period. The relationship that should exist between priority and capacity is shown graphically in Figure 2.1.
In the long and short run, manufacturing must devise plans to balance the demands of the marketplace with its resources and capacity. For long-range deci-sions, such as the building of new plants or the purchase of new equipment, the plans must be made for several years. For planning production over the next few weeks, the time span will be days or weeks. This hierarchy of planning, from long range to short range, is covered in the next section.
MANUFACTURING PLANNING AND CONTROL SYSTEM
There are five major levels in the manufacturing planning and control (MPC) system:
• Strategic business plan.
• Production plan (sales and operations plan). • Master production schedule.
• Material requirements plan.
• Purchasing and production activity control.
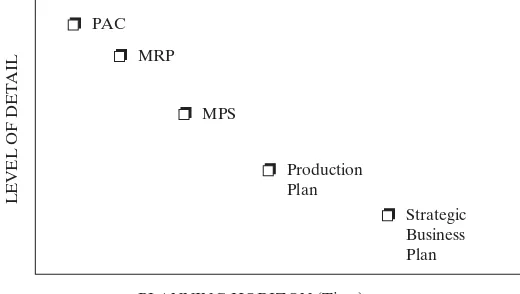
Each level varies in purpose, time span, and level of detail. As we move from strategic planning to production activity control, the purpose changes from general direction to specific detailed planning, the time span decreases from years to days, and the level of detail increases from general categories to individual components and workstations.
Since each level is for a different time span and for different purposes, each dif-fers in the following:
• Purpose of the plan.
• Planning horizon—the time span from now to some time in the future for which the plan is created.
• Level of detail—the detail about products required for the plan. • Planning cycle—the frequency with which the plan is reviewed.
PRIORITY (Demand)
CAPACITY (Resources)
Figure 2.1 Priority-capacity
STRATEGIC BUSINESS
PLAN
MASTER PRODUCTION
SCHEDULE
MATERIAL REQUIREMENTS
PLAN PRODUCTION
PLAN
PRODUCTION ACTIVITY CONTROL
AND PURCHASING
MASTER PLAN
PLANNING
IMPLEMENTATION
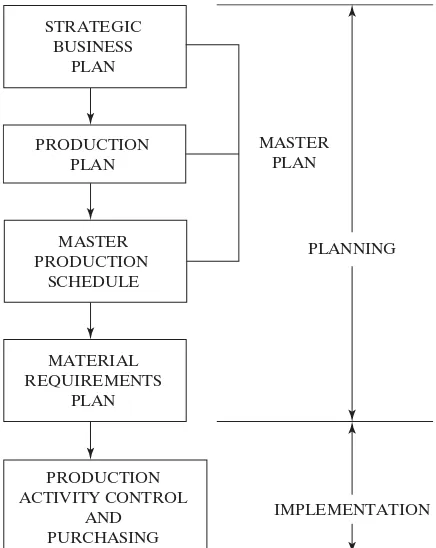
Figure 2.2 Manufacturing
planning and control system.
At each level, three questions must be answered:
1. What are the priorities—how much of what is to be produced and when? 2. What is the available capacity—what resources do we have?
3. How can differences between priorities and capacity be resolved?
Figure 2.2 shows the planning hierarchy. The first four levels are planning lev-els. The result of the plans is authorization to purchase or manufacture what is required. The final level is when the plans are put into action through production activity control and purchasing.
The following sections will examine each of the planning levels by purpose, horizon, level of detail, and planning cycle.
The Strategic Business Plan
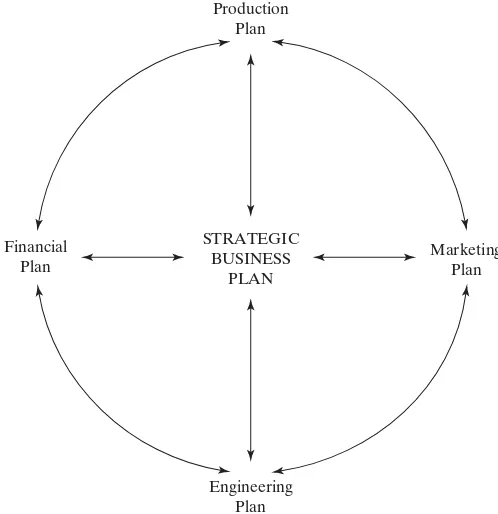
forecasts and includes participation from marketing, finance, production, and engi-neering. In turn, the plan provides direction and coordination among the marketing, production, financial, and engineering plans.
Marketingis responsible for analyzing the marketplace and deciding the firm’s response: the markets to be served, the products supplied, desired levels of customer service, pricing, promotion strategies, and so on.
Financeis responsible for deciding the sources and uses of funds available to the firm, cash flows, profits, return on investment, and budgets.
Productionmust satisfy the demands of the marketplace. It does so by using plants, machinery, equipment, labor, and materials as efficiently as possible.
Engineeringis responsible for research, development, and design of new prod-ucts or modifications to existing ones. Engineering must work with marketing and production to produce designs for products that will sell in the marketplace and can be made most economically.
The development of the strategic business plan is the responsibility of senior management. Using information from marketing, finance, and production, the strate-gic business plan provides a framework that sets the goals and objectives for further planning by the marketing, finance, engineering, and production departments. Each department produces its own plans to achieve the objectives set by the strategic busi-ness plan. These plans will be coordinated with one another and with the strategic business plan. Figure 2.3 shows this relationship.
STRATEGIC BUSINESS
PLAN Financial
Plan
Marketing Plan Production
Plan
Engineering Plan
The level of detail in the strategic business plan is not high. It is concerned with general market and production requirements—total market for major product groups, perhaps—and not sales of individual items. It is often stated in dollars rather than units.
Strategic business plans are usually reviewed every six months to a year.
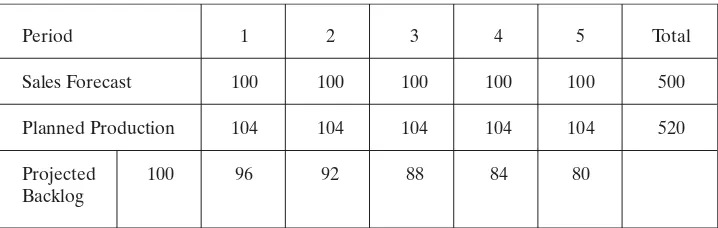
The Production Plan
Given the objectives set by the strategic business plan, production management is concerned with the following:
• The quantities of each product group that must be produced in each period. • The desired inventory levels.
• The resources of equipment, labor, and material needed in each period. • The availability of the resources needed.
The level of detail is not high. For example, if a company manufactures chil-dren’s bicycles, tricycles, and scooters in various models, each with many options, the production plan will show major product groups, or families: bicycles, tricycles, and scooters.
Production planners must devise a plan to satisfy market demand within the resources available to the company. This will involve determining the resources needed to meet market demand, comparing the results to the resources available, and devising a plan to balance requirements and availability.
This process of determining the resources required and comparing them to the available resources takes place at each of the planning levels and is the problem of capacity management. For effective planning, there must be a balance between prior-ity and capacprior-ity.
Along with the market and financial plans, the production plan is concerned with implementing the strategic business plan. The planning horizon is usually 6 to 18 months and is reviewed perhaps each month or quarter.
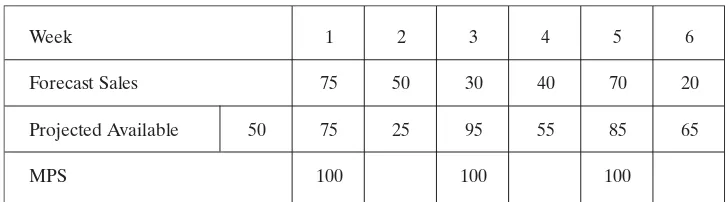
The Master Production Schedule
The master production schedule (MPS) is a plan for the production of individual end items. It breaks down the production plan to show, for each period, the quantity of each end item to be made. For example, it might show that 200 Model A23 scooters are to be built each week. Inputs to the MPS are the production plan, the forecast for individual end items, sales orders, inventories, and existing capacity.
purchasing and manufacturing lead times. This is discussed in Chapter 3 in the section on master scheduling. The term master schedulingdescribes the process of developing a master production schedule. The term master production scheduleis the end result of this process. Usually, the plans are reviewed and changed weekly or monthly.
The Material Requirements Plan
The material requirements plan (MRP) is a plan for the production and purchase of the components used in making the items in the master production schedule. It shows the quantities needed and when manufacturing intends to make or use them. Purchasing and production activity control use the MRP to decide the purchase or manufacture of specific items.
The level of detail is high. The material requirements plan establishes when the components and parts are needed to make each end item.
The planning horizon is at least as long as the combined purchase and manu-facturing lead times. As with the master production schedule, it usually extends from 3 to 18 months.
Purchasing and Production Activity Control
Purchasing and production activity control (PAC) represent the implementation and control phase of the production planning and control system. Purchasing is responsi-ble for establishing and controlling the flow of raw materials into the factory. PAC is responsible for planning and controlling the flow of work through the factory.
The planning horizon is very short, perhaps from a day to a month. The level of detail is high since it is concerned with individual components, workstations, and orders. Plans are reviewed and revised daily.
Figure 2.4 shows the relationship among the various planning tools, planning horizons, and level of detail.
PLANNING HORIZON (Time)
LEVEL OF DETAIL
PAC MRP
MPS
Production Plan
Strategic Business Plan
The levels discussed in the preceding sections are examined in more detail in later chapters. This chapter discusses production planning. Later chapters deal with master scheduling, material requirements planning, and production activity control.
Capacity Management
At each level in the manufacturing planning and control system, the priority plan must be tested against the available resources and capacity of the manufacturing sys-tem. Chapter 5 describes some of the details of capacity management. For now, it is sufficient to understand that the basic process is one of calculating the capacity needed to manufacture the priority plan and of finding methods to make that capac-ity available. There can be no valid, workable production plan unless this is done. If the capacity cannot be made available when needed, then the plans must be changed. Determining the capacity required, comparing it to available capacity, and mak-ing adjustments (or changmak-ing plans) must occur at all levels of the manufacturmak-ing planning and control system.
Over several years, machinery, equipment, and plants can be added to or taken away from manufacturing. However, in the time spans involved from production planning to production activity control, these kinds of changes cannot be made. Some changes, such as changing the number of shifts, working overtime, subcontracting the work, and so on, can be accomplished in these time spans.
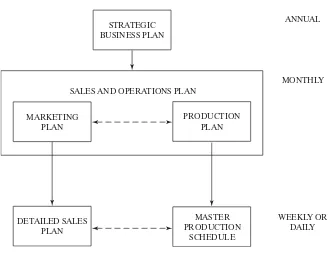
SALES AND OPERATIONS PLANNING
The strategic business plan integrates the plans of all the departments in an organiza-tion and is normally updated annually. However, these plans should be updated as time progresses so that the latest forecasts and market and economic condi-tions are taken into account. Sales and operations planning (SOP)is a process for continually revising the strategic business plan and coordinating plans of the various departments. SOP is a cross-functional business plan that involves sales and market-ing, product development, operations, and senior management. Although operations represents supply, marketing represents demand. The SOP is the forum in which the production plan is developed.
MASTER PRODUCTION
SCHEDULE PRODUCTION
PLAN MARKETING
PLAN
STRATEGIC BUSINESS PLAN
DETAILED SALES PLAN
SALES AND OPERATIONS PLAN
ANNUAL
MONTHLY
WEEKLY OR DAILY
Figure 2.5 Sales and operations planning.
Sales and operations planning is medium range and includes the marketing, production, engineering, and finance plans. Sales and operations planning has several benefits:
• It provides a means of updating the strategic business plan as conditions change.
• It provides a means of managing change. Rather than reacting to changes in market conditions or the economy after they happen, the SOP forces manage-ment to look at the economy at least monthly and places it in a better position to plan changes.
• Planning ensures the various department plans are realistic, coordinated, and support the business plan.
• It provides a realistic plan that can achieve the company objectives. • It permits better management of production, inventory, and backlog.
executives can ensure that the best approach to volume and mix are made and that supply and demand are balanced in the best approach possible.
MANUFACTURING RESOURCE PLANNING
Because of the large amount of data and the number of calculations needed, the manufacturing planning and control system will probably have to be computer based. If a computer is not used, the time and labor required to make calculations manually is extensive and forces a company into compromises. Instead of scheduling requirements through the planning system, the company may have to extend lead times and build inventory to compensate for the inability to schedule quickly what is needed and when.
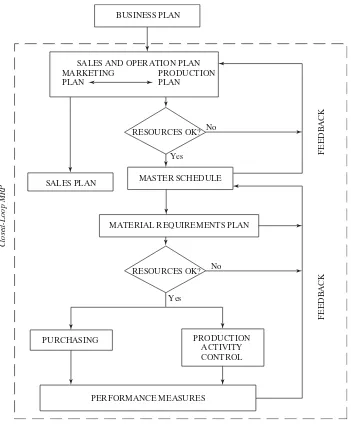
The system is intended to be a fully integrated planning and control system that works from the top down and has feedback from the bottom up. Strategic busi-ness planning integrates the plans and activities of marketing, finance, and produc-tion to create plans intended to achieve the overall goals of the company. In turn, master production scheduling, material requirements planning, production activity control, and purchasing are directed toward achieving the goals of the production and strategic business plans and, ultimately, the company. If priority plans have to be adjusted at any of the planning levels because of capacity problems, those changes should be reflected in the levels above. Thus, there must be feedback throughout the system.
The strategic business plan incorporates the plans of marketing, finance, and pro-duction. Marketing must agree that its plans are realistic and attainable. Finance must agree that the plans are desirable from a financial point of view, and production must agree that it can meet the required demand. The manufacturing planning and control system, as described here, is a master game plan for all departments in the company. This fully integrated planning and control system is called a manufacturing resource planning,orMRP II.system. The term MRP IIis used to distinguish the “manufactur-ing resource plan” (MRP II) from the “materials requirement plan” (MRP).
MRP II provides coordination between marketing and production. Marketing, finance, and production agree on a total workable plan expressed in the production plan. Marketing and production must work together on a weekly and daily basis to adjust the plan as changes occur. Order sizes may need to be changed, orders can-celed, and delivery dates adjusted. This kind of change is made through the master production schedule. Marketing managers and production managers may change master production schedules to meet changes in forecast demand. Senior manage-ment may adjust the production plan to reflect overall changes in demand or resources. However, they all work through the MRP II system. It provides the mech-anism for coordinating the efforts of marketing, finance, production, and other departments in the company. MRP II is a method for the effective planning of all resources of a manufacturing company.
BUSINESS PLAN
SALES AND OPERATION PLAN
MASTER SCHEDULE
MATERIAL REQUIREMENTS PLAN RESOURCES OK?
SALES PLAN
RESOURCES OK?
PURCHASING PRODUCTION
ACTIVITY CONTROL
PERFORMANCE MEASURES
FEEDBACK
FEEDBACK
No
No Yes
Yes
Closed-Loop MRP
MARKETING PLAN
PRODUCTION PLAN
Figure 2.6 Manufacturing resource planning (MRP II).
ENTERPRISE RESOURCE PLANNING
As MRP systems evolved, they tended to take advantage of two changing conditions:
least comfortable, but often very familiar, with the advantages in speed, accu-racy, and capability of integrated computer-based management systems. 2. Movement toward integration of knowledge and decision making in all aspects
of direct and indirect functions and areas that impact materials flow and mate-rials management. This integration not only included internal functions such as marketing, engineering, human resources, accounting, and finance but also included the “upstream” activities in supplier information and the “down-stream” activities of distribution and delivery. That movement of integration is what is now recognized as supply chain management.
As the needs of the organization grew in the direction of a truly integrated approach toward materials management, the development of IT systems matched that need. As these systems became both larger in scope and integration when com-pared to the existing MRP and MRP II systems, they were given a new name— enterprise resource planning, or ERP.
ERP is similar to the MRP II system except it does not dwell on manufacturing. The whole enterprise is taken into account. The eleventh edition of the American Production and Inventory Control Society (APICS) APICS Dictionarydefines ERP as “Framework for organizing, defining, and standardizing the business processes neces-sary to effectively plan and control an organization so the organization can use its internal knowledge to seek external advantage.” To fully operate there must be appli-cations for planning, scheduling, costing, and so forth, to all layers in an organization, work centers, sites, divisions, and corporate. Essentially, ERP encompasses the total company and MRP II is manufacturing.
The larger scope of ERP systems allows the tracking of orders and other impor-tant planning and control information throughout the entire company from procure-ment to ultimate customer delivery. In addition, many ERP systems are capable of allowing managers to share data between firms, meaning that these managers can potentially have visibility across the complete span of the supply chain.
Although the power and capability of these highly integrated ERP systems is extremely high, there are also some large costs involved. Many of the best systems are expensive to buy, and the large data requirements (for both quantity and accuracy) tend to make the systems expensive, time consuming, and generally difficult to implement for many firms.
MAKING THE PRODUCTION PLAN
We have looked briefly at the purpose, planning horizon, and level of detail found in a production plan. This section discusses some details involved in making production plans. Based on the market plan and available resources, the production plan sets the limits or levels of manufacturing activity for some time in the future. It integrates the capabilities and capacity of the factory with the market and financial plans to achieve the overall business goals of the company.