Jejak Vol 10 (1) (2017): 205-222. DOI: http://dx.doi.org/10.15294/jejak.v10i1.9136
JEJAK
Journal of Economics and Policy http://journal.unnes.ac.id/nju/index.php/jejak
The Perception and Contribution of Community Forest on the
Welfare of Farmers i
n Merapi Volcano’s Slope
Setiaji1, Ronggo Sadono2, Hartono3, Mochammad Maksum Machfoedz4
1Student of Doctoral Program (S3) of Forestry Science Studies, Gadjah Mada University, Indonesia 2Faculty of Forestry, Gadjah Mada University, Indonesia
3Faculty of Geography, Gadjah Mada University, Indonesia 4Faculty of Agriculture, GadjahMada University, Indonesia
Permalink/DOI:http://dx.doi.org/10.15294/jejak.v10i1.9136
Received: June 2016; Accepted: October 2016; Published: March 2017
Abstract
Pressure on forest resources causes overexploitation, so that forest resources can’t provide optimal benefits. High demands for timber have created opportunity for the development of community forests in Indonesia. The opportunity has been used relatively well by community forest farmers, such as in Cangkringan Sub-District, Sleman Regency. This study was aimed to learn the economic condition of community forest farmers by calculating income balance, expense, welfare, and perception of community forest farmer family. The data of this study was collected using purposive sampling method, with a total of 60 respondents. Secondary data was collected from related government agencies. The research result showed that most community forests useagroforestry system.Sengon,
which is the main community of community forest, serves community savings, which is knownas “tebangbutuh” system. 51%
respondents agreed to the perception of the importance of community forest.Comprehensive calculation produced positive value, which is bigger than 100% for total percentage of income on expense. Using Sajogyo’s line of poverty, over ¾ (three fourth) of community forest farmer respondents were above the line of poverty or were able to meet their minimum primary needs.
Key words : community forest, perception, income and expense, welfare.
How to Cite: Setiaji, S., Sadono, R., Hartono, H., & Machfoedz, M. (2017). The Perception and Contribution of Community Forest on the Welfare of Farmers in Merapi Volcano’s Slope.JEJAK: Jurnal Ekonomi Dan Kebijakan, 10(1), 205-222. doi:http://dx.doi.org/10.15294/jejak.v10i1.9136
© 2017 Semarang State University. All rights reserved
Corresponding author :
Address: Jl. Agro No.1 Bulaksumur, UGM, Sleman, Yogyakarta
E-mail: [email protected]
INTRODUCTION
Deforestation in Indonesia is highly alarming and has toned down productive forest areas. The damage is resulted from the exploitation of forest resources that pay less attention to the principles of sustainability, just to meet their needs for raw materials for timber industry in Indonesia that keeps opportunity for the development of community forests in Indonesia. Deforestation in Indonesia is highly worrying, and it has reduced productive forest areas. The damage is caused by the exploitation of forest resources which pay less attention to the principles of preservation, just to meet the needs for raw materials for the timber industry in Indonesia that keeps increasing. The lower stock of wood materials from natural forest areas and the high demand for wood materials result in higher price of wood (Ritosuhardoyo, 2009). Such condition is actually a good opportunity for the development of community forests in Indonesia. In addition to meet the demand for wood raw materials, community forest business also plays a role in improving the income of farmers while preserving the environment (Rajati, et al., 2006). The extent to which the community forests play a role in the family economic structure will affect the behavior of the farmers in the forest community business. In this context, the contribution of community forests in household welfare of forest farmers becomes highly interesting matter to study. In order to understand such aspect, it is necessary to investigate the structure of income and
expenditure of community forest farmers and its relation with motivation of farmers in this type of business. Java is denselypopulated, and land ownership of farmersis relatively small. The majority of the farmers are also vulnerable to pressure in terms of meetingtheir daily needs. Thereby, the farmer community will be encouraged to utilize their limited land for planting trees and high value dry-season crops.
JEJAK Journal of Economics and Policy Vol 10 (1) (2017): 205-222 207
avocado plants with cudgel as its additional product, Micheliaandits flower products without damaging the trees, durian, mangosteen, ylang-ylang, and stinky beans.
According to Law No. 41, 1999, community forests are forest typef all into the category of forest rights. It indicates that the forest community is forest growing on land encumbered with property rights, and not cultivated on the state ground. However, it puts more emphasis on land ownership. The community forest is a forest growing on proprietary land by the minimum area of 0.25 ha, with a crown cover dominated by timber plants (over 50%), or first-year crops which are at least 500. (The Ministerial Decree No. 49 / KPTS-II / 1997). Meanwhile, according to the dictionary of forestry (1990) in Awang (2001), the community forest is forest located on lands under the ownership of the community or the traditional property (customary) continuously cultivatedfor forestry business, namely wood, either grown naturally or cultivated. Zain (1998) states a small number of community forests in Java in general only covers the area according to forest definition, in which at least 0.25 ha. It is resulted from the average land ownership in Java which is very narrow. The narrowness of land ownership of each family encourages the owners to utilize it optimally. In connection with this, the owners generally try to utilize the land by cultivating high-value crops, fast to harvest, and plants for daily consumption.
In the community forest development efforts to the present day, it can be said that the community forest business is a business that will neither grow bignor die. The community forest business has the following characteristics:(1) the community forest business is done by farmers, middlemen, and
industries, where the farmers still have lower bargaining power, (2) the farmers have not been able to conduct community forest business according to the principles of good business and sustainability, (3) public forests are mostly in the form of mixed cultivation, cultivated with simple ways. (4) Thein come from public forests is still positioned as a side income and incidental for farmers, with a range of no more than 10% of total income (Zain, 1998).
Anonymous in Jaffar (1993), states that community forests are comprised of very diverse vegetations. The dominance of any of this type will determine the pattern of the silvopastur pattern; this community forest is dominated by plants producing fodder/ forage, (3) firewood pattern;this community forests are dominated by trees species of which wood producing energy, (4) horticulture pattern; this community forest is dominated by fruit trees. (5) trade/ industrial pattern; this community forest is dominated by wood for trade. (6) wood pattern; this community forest is dominated by wood that can produce utensils materials.
the quality of the environment (absorbing CO2 and O2 manufacturer), (d) aesthetics: to provide natural beauty, (e) source: as a natural resource for science, biology, environmental science and others.
In accordance with Awang (2001), as seen from the arrangement of its species, there are two models of community forest management: (1) monoculture community forest, mostly is dominated by hard trees only. This type of forestusually doesn’t include cropsin the community forest, (2) mixed community forest; this community forest is covered with more than one type of plants. In this forest, crops, fruits and vegetables are cultivated (agroforestry).
(Kotler, 2000) describes perception as the process of how someone selects, organizes and interprets information inputs to create meaningful overall description. Meanwhile (Robbins, 2003) describes the perception in relation to the environment, i.e. as a process in which individuals organize and interpret their perception of sense in order to give meaning to their environment.Individuals, in relation to the outside world, always observe to be able to interpret the stimulus received, and the sense used as a connection between the individual and the outside world. To makeobservation process happen, the object for observation is needed, good sense and the attention are the first step as a preparation to make observations.
(Retno, D., 2001) states that household income is income earned by the entire family members, i.e. husband, wife and children. According to Sayogyo (1982) in Kusumaningtyas (2003), household income can be divided into three groups: (a) income from farming, (b) income that includes rice cultivation activity, and other agricultural activities, (c) income earned from all
activities, including sources of livelihood outside of agriculture. The relationship between physical, economic, strategic, and socio-cultural variables affect welfare variable (Paranata, A., et al., 2012).
Various alternatives can be used to determine the poverty line, including: rice consumption (kg per person), the consumption of nine daily necessities, household spending (IDR per person), the consumption of calories and protein (person/7 days). The poverty line has characteristics: specifications on the three poverty lines, including the conception of "adequacy threshold value", linking the household expenditure level by food adequacy measurement (calories and protein). For the rural life,the classifications are: (1) poor:included poor if the household expenditure is under 320 kg of rice exchange rate/person/year, (2) extremely poor: not enough food, if the expenditure is under 240 kg of rice exchange rate/person/year, (3) the poorest:theycan be classified into the poorest if the expenditure is under rice exchange rate of 180 kg/person/year (Sajogyo 1977 in Indaryanti, et al., 2006). Sajogyo in Sitorus et al., (1996) states, the level of household expenditure in villages, the rice exchange rate of 240-320 kg/person/year is called "adequacy threshold", whilst for the city, the figure is amounted to 360-480 kg of rice exchange rate/person/year. The income of rural household is still dominated by agricultural sector.
JEJAK Journal of Economics and Policy Vol 10 (1) (2017): 205-222 209
reflects the pattern of consumption (Sajogyo in Sitorus et al.,,1996). Forestry Department (1995) mentions that the successful development of community forest is highly dependent on (1) clear goal of community forests development, (2) the location and unit size of community forests business, (3) the selection of plants, (4) the system of planting, maintenance, and management, (4) planned annual production, (5) the available investment and linkage to wood processing industry.
RESEARCH METHODS
The study was conducted in the Disaster-Prone Areas (KRB), Cangkringan District, Sleman Regency, Special Region of Yogyakarta. In morphological terms, it is located on the slope of Merapi Volcano, from the peak to foot of the volcano, including villages spread in Cangkringan District, Sleman Regency. Furthermore, the analysis unit used was the village administrative unit, amounted to five villages. In accordance with the allocation of area functions, all of the villages had two area functions, namely protection and cultivation functions. In general, in nature, this research was more descriptive analysis with quantitative approach.
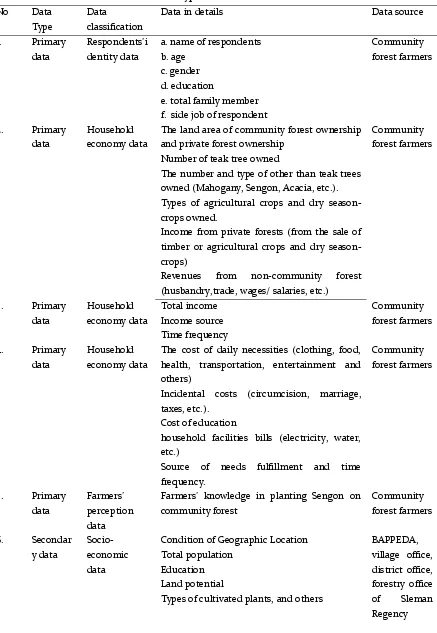
Tools and materials employed during the research were questionnaire, stationery, secondary data, Calculator, Laptop, Software Microsoft Excel 2007, Digital Cameras. Type and source of data; the data collected were in the form of primary and secondary data, as on table 1.
The sampling of respondents employed purposive sampling method. The samples were taken with the intention or
Table 1. Type and Source of Data No Data
Type
Data
classification
Data in details Data source
1. Primary
The land area of community forest ownership and private forest ownership
Number of teak tree owned
The number and type of other than teak trees owned (Mahogany, Sengon, Acacia, etc.). Types of agricultural crops and dry season-crops owned.
Income from private forests (from the sale of timber or agricultural crops and dry season-crops)
Revenues from non-community forest (husbandry,trade, wages/ salaries, etc.)
Community health, transportation, entertainment and others)
Incidental costs (circumcision, marriage, taxes, etc.).
Cost of education
household facilities bills (electricity, water, etc.)
Types of cultivated plants, and others
BAPPEDA,
JEJAK Journal of Economics and Policy Vol 10 (1) (2017): 205-222 211
Calculation of Perception Value:
The calculation of perception value was calculated using Likert method. The value of each question was calculated from answers given by the respondents. Each answer option has the value of a (disagree) = 1, b (agree) = 2, c (do not know) = 3. All answers were summed up and calculated to find the average value. After wards, it was grouped, and the formula for calculation is:
% NM = ΣO / ΣP x 100%
Description:% NM = Percentage of perception value, ΣO = The number of people answered according to option, ΣP = Number of respondents taken in one observation site.
Farmers’ Income from Community Forest:
lhr = Σ Farmers’ income from community forest products
Description: Ihr = total income of farmers from community forest per year (IDR), farmers’ income from community forest products = income earned from the sales of wood and crops, Ihr = Σ Farmers’ income from community forest products.
Farmers Income from Non-Community Forests:
Inhr = Σ farmer's income from non-
community forest products
Description: Inhr = Σ Farmers’ income
from other non-community forests, Description: Inhr = Total income of farmers fromnon community forest (IDR), income from non-community forest = livestock product, trade, as well as wages or salaries and other sources of income.
Farmers’ Total Income:
Itot = Ihr + Inhr
Description: Itot = Total household income of farmers; Ihr = Total income from community forest products; Inhr = Total income from non-community forest products.
Calculating Income Per Capita of
Community Forest Farmers’ Household:
Ipkhr = Itot / ΣAK
Description: Ipkhr = income per capita of community forest per year (IDR) Itrthr = total income of household from community forest products ΣAK = Number of family members
Calculating Income Per Capita of Non-Community Forest:
Ipknhr = Itrtnhr / ΣAK
Description: Ipknhr = Income per capita per year of non-community forest;
Itrtnhr = total household’s income from non
-community forest; ΣAK = Number of family members
Income Percentage of Community Forests on Total Income:
Ihr % = ( Ihr / Itot ) x 100%
Description: Ihr% = income percentage from community forests; Ihr = Total income from community forests; Itot = total income from farmers’ households.
Calculating Total Expenditure: Ctot = ΣC
Description: Ctot = Total household expenditure within one year; ΣC= Total costs incurred to meet the needs.
Calculating Expenditure Per Capita: Cpk = Ctot / ΣAK
expenditure, ΣAK = number of family Crt = total household expenditure
Calculation of Poverty Criteria:
The calculation of the poverty criterion is determined based on the theory of Sajogyo (Sajogyo 1977 in Indaryanti, et al., 2006) using the standard of rice price, consumed at the research sites. The poverty line for rural areas can be classified as follows: (1) If the expenditure of respondents ≤ 320 kg x the rice price/person/year, then they are
classified poor, (2) If the expenditure ≤ 240
kg x the rice price/person/year, then they are classified extremely poor, (3) If the expenditure ≤ 180 kg x the rice price/person/year, then they are categorized the poorest.
RESULTS AND DISCUSSION Perception Value
Decision-making of a person in terms of utilizing community forest lands depends on their knowledge of information on various aspects of the environment, and this knowledge will affect the perception and awareness in choosing an appropriate alternative usage (Su Ritohardoyo, 2009). the management and development of community forest products may be backed by knowledge. The knowledge of community forest farmers in terms of management of community forests in Cangkringan especially in sengon business as a commodity to be developed and having a high sale value is presented in Table 2.
The perception in the management of community forests can be seen from the percentage of respondents stating that the community forest is important for the economic, ecologic and social aspects. From Table 10, it is determined that more than half of the respondents,by 51% out of 60%, agree on the importance of community forests. Especially from the economic aspect, it is very clear that the respondents give a positive response to the existence of community forests. It can be seen in the score percentage of statements 12 and 13.
Disagreement percentage by 9%, indicating there are farmers who pay less or have not paid attention to aspects of community forest management. It is because these respondents also get the benefits of community forests. Nevertheless, some respondents truly feel that the community forest is not more favorable compared to non-community forest.
JEJAK Journal of Economics and Policy Vol 10 (1) (2017): 205-222 213
community forests can be classified to have considerably high perception in the management and conservation of public forests, especially the benefits to be gained
from the community forests. In addition to be made as savings, community forests’ plantscan also become an employment for the community of Cangkringan.
Table 2. Perception Value
No Statement
%
disagree % agree
% do not know 1 HR management is the responsibility of all 0 55 5
2 Deforestation affects lives 5 47 8
3 The community can be separated from forests 33 24 3 4 HR is important for environment 0 59 1
5 HR helps water absorption 1 57 2
6 HR helps rehabilitation of critical land 1 53 6 7 HR produces fruits, roots, medicine, and fodder 9 45 6 8 HR provides wood and industrial raw materials 2 52 6
9 HR enhances wood productivity 1 50 9
0 HR of community income level 1 52 7
11 HR income fulfills community’s needs 18 41 1 12 HR fulfills community’s needs 9 51 0
13 HR is able to improve income 0 60 0
14 HR future assets must be maintained 1 48 11 15 Land conservation is compatible with RTRW 1 56 3 16 Sales of standing tree forest products 16 42 2 17 Sales of log/timber forest product 17 42 1 18 Natural regeneration silviculture 26 30 4 19 Artificial regeneration silviculture 6 51 3 20 Tree seedling from KBR and government aid 4 55 1 21 Institutions are still limited to planting 3 55 2 22 Inventory is used according to life needs 35 23 2 23 Market’s best price is done TPA 9 49 2 24 The need for wood legality certification 25 29 6
25 HR gives grace barrier effect 1 59 0
26 The importance of conservation tradition 6 53 1 Source: processed primary data, 2014
Table 3. Respondent Age Span
Age indicator (Tahun) total (people) Percentage (%)
25-35 3 5.0
36-45 17 28.3
46-55 21 35.0
56-65 19 31.7
Characteristics of Community Forest Farmers
The description of the characteristics of community forest farmers was done by interviewing the respondents. The total respondents taken were 60. The data collected included identity data, age, education level, occupation, number of family members, respondents’ income, respondents’ expenditure, as well as the motivation of respondents towards themanagement of community forest, especially for management of sengon trees.
The Age Span of Community Forest Farmers
The youngest age of respondents is 25, with the oldest being 70. The respondents’ age data are presented in Table 3.
Table 3 shows that the largest percentage of respondents is in the age group of 46-55 years, equal to 35.0%. It is because in the age span of 46-55 years, the average respondents have raised a family; hence the motivation to work as forest farmers in community forest area is greater, in order to meet the family needs.
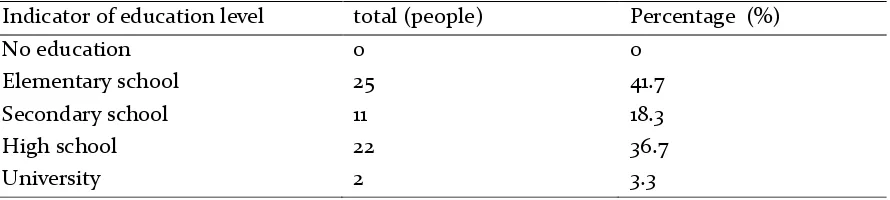
The Education ofCommunity Forest Farmers
The level of education of farmers affects the mindset of farmers in managing
community forests owned as an effort to increase efforts in meeting life needs. In addition, the level of education can be an indicator of a society. The higher a person's education level in social life, the higher the social status in the community.The data of the respondents' education level can be seen in the following table 4.
From Table 4, it can be seen that most respondents (41.7%) are elementary school graduate, followed by 36.7% of high school graduates, 18.3% of secondary school graduates, and 3.3% of university graduates. Low level of education happens because huge costs to attend higher education. The low level of education causes limited ability,there by most effort done to make ends meet is to continue their parents’ occupation, i.e. becoming community forest farmers or migrating to other areas to find work. The low level of education also affects the attitudes and knowledge of the person.
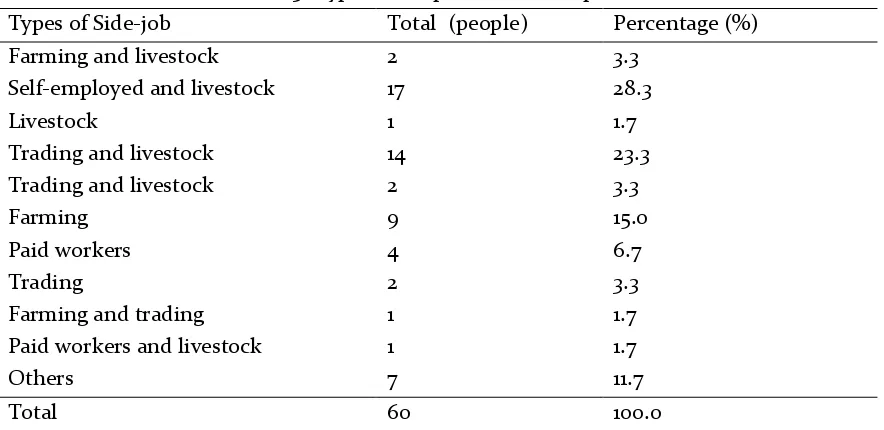
Main Job and Side Job of Cangkringan Community
48 out of 60 respondents have side job in addition to working as a community forest farmers. The majority of the job type is self-employed and farming, with a total of 17 people (28.3%). Data of side job of respondents are presented in Table 5.
Table 4.Respondents’ Level of Education
Indicator of education level total (people) Percentage (%)
No education 0 0
Elementary school 25 41.7
Secondary school 11 18.3
High school 22 36.7
University 2 3.3
JEJAK Journal of Economics and Policy Vol 10 (1) (2017): 205-222 215
Table 5.Types of Respondents’ Occupation
Types of Side-job Total (people) Percentage (%)
Farming and livestock 2 3.3
Self-employed and livestock 17 28.3
Livestock 1 1.7
Trading and livestock 14 23.3
Trading and livestock 2 3.3
Farming 9 15.0
Paid workers 4 6.7
Trading 2 3.3
Farming and trading 1 1.7
Paid workers and livestock 1 1.7
Others 7 11.7
Total 60 100.0
Source: Processed Primary Data, 2014.
Table 5 shows that the presence of main job and side job can determine the fulfillment of respondents’ needs, not only from the community forest business, but also other jobs. It also explains that they have time to spare to do things for increasing the income.
Respondents’ Income
The differences of livelihood will lead to difference in the amount of income on each respondent. This income is calculated within the past year from job income of the respondents, either from the community forest orbeyond community forest product. Income from private forests is generated from the sale of wood and dry-season crops
onthe land owned by farmers, whilst for non-forest income, it is generated from live stock, trade, wages or salaries, and others. Data of respondent's income can be seen in Table 6.
Table 6 provides the information that the community forest income is divided into income from wood and dry-season crops. Wood yields greater income than dry-season crops. While for income from community forests, it is smaller than that of non-community forest. It is because the majority of respondents work as community forest farmers and they exploit commodity in community forest in order to make ends meet.
Table 6. Income of all Respondents 2014 Source of income total (60
respondents/ye ar)
Average
(IDR/respondents/ye ar)
Standard of deviation
In average (IDR/capita /year) Community forest 298.850.000 4.980.833 9.560.783 24.780 Non-community
forest
788.390.000 13.139.833 12.090.033 64.411
The amount of the standard of deviation from household income data of respondents shows that the diversity of the income earned by respondents is high. Actual respondents’ income ranges from IDR 2.470.000 to IDR 78.000.000. Nonetheless, for income comparison, standard average income from 60 respondents is taken, which is amounted to IDR 18,120,666/ respondent/ year.
Respondents’ Expenditure
Respondents’ expenditureis calculated for all purposes, starting from annual fixed needs, incidental needs, and other needs incurred in 2014. Each of household’s needs vary, influenced by the number of family members and type of needs. The
respondent’s expenditure data are presented
in Table 7.
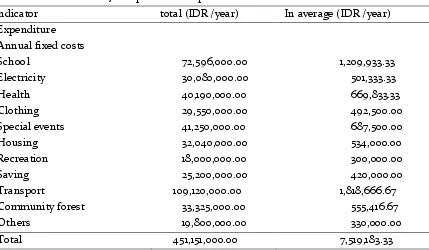
Expenditurefor fixed costs incurred annually by all community forest farmers respondents is amounted to IDR 451,151,000/
year, with IDR 7,519,183/ year being the average number. Mean while, the smallest allocation of household expenditure goes to food. The smallest expenditure allocation is for recreation. The average for fixed costs is derived from the amount of total annual expenditure of respondents’ household divided by the total number of respondents. It is so because each respondent’s household incurs different cost for similar needs in meeting the annual fixed expenditure.
The calculation result above generates information, i.e.a portion of income earned by respondents goes for savings. It proves that in addition to make ends meet, there is still extra income that can be saved by the respondents, so it plays an important role in terms of savings in the future. It also proves the respondent income from community forests provide greater results to total income. Besides annual fixed costs, respondents’ expenses allocated to incidental expenses can be seen in Table 8.
Table 7.Respondent’s Expenditure for Fixed Annual Fee
Indicator total (IDR /year) In average (IDR /year)
Expenditure
Annual fixed costs
School 72,596,000.00 1,209,933.33 Electricity 30,080,000.00 501,333.33 Health 40,190,000.00 669,833.33 Clothing 29,550,000.00 492,500.00 Special events 41,250,000.00 687,500.00 Housing 32,040,000.00 534,000.00 Recreation 18,000,000.00 300,000.00 Saving 25,200,000.00 420,000.00 Transport 109,120,000.00 1,818,666.67 Community forest 33,325,000.00 555,416.67 Others 19,800,000.00 330,000.00 Total 451,151,000.00 7,519,183.33
JEJAK Journal of Economics and Policy Vol 10 (1) (2017): 205-222 217
Table 8. Respondents’ expenditure for incidental fee/ special events of 2014
Expenditure indicators Total In average
(IDR/ total respondents’ payment )
Special events/ incidental 41,250,000.00 687,500.00 Source: processed primary data, 2014
Incidental expenses incurred by respondents go to weddings, circumcisions, and others. The expensetakes considerable amount and is in urgent time to do so. Donations or assistance of the neighborhood association is given if the neighbors are about to hold an event. The condition of the rural environment and a high sense of family cause the respondents to have a high sense of assistance, both in terms of energy and money when a family or neighbors are about to hold an event.
In contrast with the respondent's expenditure for annual fixed costs, the average incidental cost incurred by respondents is obtained from the total expenditure for each incidental expense, divided by the number of respondent householdsincurring the expense, not divided by the total number of respondents, as not all respondents incur incidental expenses within one year. The comparison
between income and expenditure for all respondents can be seen in Table 9.
Overall expenditure of the annual expenditure and incidental expenditure is IDR 451,151,000.00, and the average household expenditure for each respondent for one year is IDR 7,519,183.33. It shows that if the comparison is made between income and expenditure, it can be seen that the
respondents’ income is greater than their
expenditure. Similarly, the average income is greater than average expenditureper capita. The average total income/capita/year is
greater than the average
expenditure/capita/year. Total income per capita of IDR 5,329,609/capita/year, whilst the expenditure is amounted to IDR 2,211,524.51/capita/year. Therefore, the average farmers are able to fund their needs, both from community forests products and non-community forest.
Tabel 9. Comparison of total income and expenditure of all respondents in2014 Indicator Total
(IDR/year)
In average (IDR/year)
Amount per capita
(IDR/capita/y ear)
Per capita average (IDR/capita/year)
Total income of all respondents
1.087.240.000 18.120.666,67 5.329.609 88.827
Total expenditure of
The Contribution of Community Forests on the Income and Expenditure of Respondents
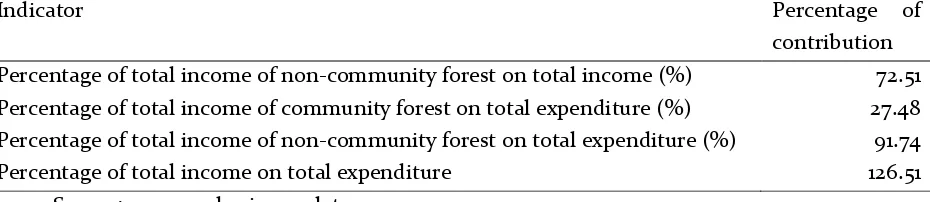
After the calculation of income and expenditure is done, then the contribution of community forests on income and expenditure can also be calculated. The contribution of community forests is divided into contribution of community forest’s income generated from wood against total income and expenditure as well as the income contribution of the community forest generated from dry-season crops against total income and expenditure. Moreover, the contribution of community forests can also be calculated (wood, crops, and livestock) against income and expenditure, as well as the contribution of non-community forests against total income and expenditure. The calculation resultcan be seen in Table 10.
Table 10 explains that non-community forest products only contribute by 72.51% on the income. And for the overall calculation performed, positive value is obtained which is greater than 100% for the percentage of total income on the expenditure. It indicates that respondents' income is sufficient to fulfill their daily needs. The community forest products and non-community forest
contributes greatly on the total of income and the total expenditure.
The increase in average income of the farmers, reduction in poverty, and behavioral/perception changes will lead to increased use of forest resources (Nandini, et al., 2016).
In the opinion of Zain (1998), community forests are only additional
income and incidental in
nature,approximately not more than 10% of the total income. However, community forests in Cangkringan are perceived to have a highly important role, and can be a useful thing in continuous basis because they provide greater income, more than 10% of total income. A great contribution of community forests in Cangkringan areas gives a positive impact for the economy, ecology and social.
The large percentage of contribution from total community forest income (wood) is because there are respondents managing their community forest land using agroforestry. The agroforestry system on land owned by the respondents is cultivated by planting Sengon stands, hence the sale value is high, and it gives major contribution to total income and total expenditure.
Table 10. Percentage of community forest and non-community forest contribution on income and expenditure of respondents of 2014
Indicator Percentage of
contribution Percentage of total income of non-community forest on total income (%) 72.51 Percentage of total income of community forest on total expenditure (%) 27.48 Percentage of total income of non-community forest on total expenditure (%) 91.74
Percentage of total income on total expenditure 126.51
JEJAK Journal of Economics and Policy Vol 10 (1) (2017): 205-222 219
The Concept of Poverty Line and Welfare Measurement of Respondents
After finding out the great contribution of community forests, the level of poverty among respondents in the area of Cangkringan can also be calculated. The of poor or non-poor is not only free from the threat of survival of physically/biologically only, but the capability to live and function as a member of community in the local environment. At the research site, an example of the concept application of the non-poor is the ability to meet food needs, having extra money to save, and if there are neighbors who are about to hold events (celebration/anniversary), then other people should donate to financially help the events.
The poverty measurement using decent living concept relatively changes from time to time. Measurement of material
poverty based on income or expenditure (the purchasing power of people or households). In terms of the social aspect, poverty is a weakness characteristic of the community to develop. Poverty is associated with narrow aspiration, and the short insights into the future among the people. Poverty can be classified into two categories, namely natural poverty category and selective category. Natural Poverty is caused by the quality of natural resources and human resources so that the production opportunity is relatively small, or if the production can be done in general but only in relatively low level of efficiency.
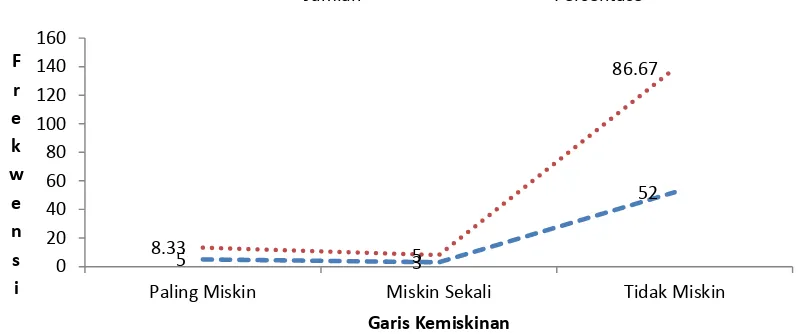
In this research, the poverty level of a person is calculated using standard poverty measurement according to Prof. Dr. Sajogyo. The poverty line includes the conception of the threshold value covering food sufficiency, and linking household expenditure level to the food sufficiency measurement (calories and protein). (Sajogyo 1977 in Indaryanti, et al., 2006).The calculation data from poverty line in order to determine the welfare of the respondents are presented in Figure 1.:
Figure 1.Graph of poverty line in total and in percentage Source : Sajogyo 1977 in Indaryanti, et al., 2006
5 3
Paling Miskin Miskin Sekali Tidak Miskin
Those included in the category of not poor are 52 out of 60 respondents, or by 86.67%. the calculation and grouping comes from calculation of income per capita of each respondent’s household, compared with the rice price per kilogram, consumed by the respondents. The rice price consumed by respondents is IDR8500.00/kg, Ir64 rice type.
The calculation result obtained is based on the standard poverty line by Sajogyo, if the household spending > 320 kg of the exchange rate of rice/person/year, or in the caseof Cangkringan >320 kg x IDR 8500.00 = IDR 2.720,000,then the respondents can be categorized not poor. Poor category is imposed if the household expenses is ≤320 kg or ≤IDR 2,720,000.
For the category of extremely poor ≤240 kg of rice exchange rate/person/year or ≤240 kg x IDR 8.500.00 = IDR 2.040.000. For
the poorest category ≤180 kg of
rice/person/year or ≤180 kg x IDR 8.500.00 = IDR 1.530.000. From the calculation, most respondents or ¾ of the respondents live in the layer of food sufficiency threshold. Households in this layer are able to achieve the minimum requirement of food (Figure 1). The graph above also shows the significant reduction in the number of respondents who are not poor until the poorest respondents. It indicates that the community condition is included in good category, in terms of the fulfillment of needs, as they have been able to afford their household needs.
CONCLUSION
From the description above, it can be concluded that: (1) income from community forests id IDR 298.850.000/year, whilst income from non-community forest is IDR 788,390,000/year. The average total income of respondents is IDR 18.120.666/capita/year,
whilst the total average income per capita is IDR 88.827/capita/year; (2) Varying household expenditure of the farmers: in
overall, the average expenditure of farmers’
households in one year is IDR 451.151.000.00/year, and for average per
capita expenditure is IDR
7,519,183.33/capita/year; (3) by using the criteria or the concept of poverty line by Sajogyo, it can be concluded that there are 52 respondents from 60 respondents, or by 86.67% is above the poverty line; there by, it can be said that mostly falls in the category of prosperous, as their income has already met the minimum physical requirements; (4) from the overall calculation conducted: the positive value, i.e. the value greater than 100% for the percentage of total income on the expenditure, is found. It indicates that respondents' income is sufficient to fund their daily needs. The community forest and non-community forest products make a major contribution to the total incomeand the total expenditure, (5) the perception of community forest management in Cangkringan is included in good category, because more than half of respondents (51%) agree that community forests have crucial role, either from the economic, ecological and social aspects. Perception of community forest management appears not good enough, as seen from the statements 16, 17, 18, 19, 22, 23, and 24.
JEJAK Journal of Economics and Policy Vol 10 (1) (2017): 205-222 221
give added-value to the welfare of farmer families; (2) forest farmers must improve motivation in managing and preserving community forests so as to create sustainable community forests; (3) the need for information system of community forest management to improve the knowledge, where the knowledge will influence the perception and awareness in selecting a suitable alternative.
REFERENCES
Ade Paranata, Wahyunadi, Akung Daeng. (2012). Mengurai Kesejahteraan Petani. Jurnal Ekonomi dan Kebijakan (JEJAK), 5(1):90-102.
Awang, S.A., Santoso, H., Widayanti, W.T., Nugroho, Y., Kustomo dan Sapardiono. (2001). Gurt
Hutan Rakyat di Kapur Selatan. Yogyakarta : CV. Debut Press.
Badan Perencanaan Pembangunan Daerah Tahun 2010 Kabupaten Sleman. 2010. diperbanyak oleh Negara Kesatuan Republik Indonesia.
Badan Pusat Statistik Tahun 2011 Kabupaten Sleman dalam Angka. 2011. diperbanyak oleh Negara Kesatuan Republik Indonesia.
Departemen Kehutanan. (2004) Electronic Statistic Textbook, Tulsa Ok., Departemen Kehutanan
Online. Available at :
http://www.dephut.go.id/index.php?q=id/node /287. Html. Diunduh pada 20 Juni 2012. Gerson N. Njurumana, Djoko Marsono, Irham, Ronggo
sadono. (2014). Konservasi Keanekaragaman Hayati Tanaman Pada Sistem Kaliwu di Pulau Sumba. Jurnal Manusia dan Lingkungan, 21(1):75-82.
Harini, R., (2014). Nilai Ekonomi Total Konversi Lahan Pertanian Di Kabupaten Sleman. Jurnal Manusia dan Lingkungan, 20(1):35-48.
Jaffar, E., R. (1993). Pola Pengembangan Hutan Rakyat Upaya Peningkatan Luasan Lahan, dan Peningkatan Pendapatan Masyarakat di Provinsi DIY. Makalahpada pertemuan DIY., Yogyakarta :: Tanggal 17 Juli 1993.
Kotler, P., (2000). Marketing Manajemen: Analysis, Planning, implementation, and Control (9th Edition). New Yersey : Prentice Hall International, Int.
Nandini R., Ambar Kusumandari, Totok Gunawan, Ronggo Sadono. (2016). Dampak Kebijakan Hutan Kemasyarakatan terhadap Petani di Kawasan Hutan Lindung Rinjani. Jurnal Ekonomi dan Kebijakan, 9(1):36-53.
Paranata A., Wahyunadi, Akung Daeng, Baiq Saripta Wijimulawiani. (2012). Mengurai Model Kesejahteraan Petani. Jurnal Ekonomi dan Kebijakan, 5(1):90-102.
Retno, D., (2001). Hutan Rakyat di Kabupaten Wonosobo, Jawa Tengah, BTP DAS Solo, Surakarta.
Robbins, S.P., 2003. Perilaku Organisasi. Jilid I. Jakarta : PT INDEKS Kelompok Garmedia.
Ritohardoyo, S., (2009). Pemanfaatan lahan hutan rakyat dan kehidupan sosial ekonomi penduduk : Kasus di daerah Kabupaten Gunung Kidul. Unpublished Dissertation. Post Graduate Programme. Yogyakarta : UGM .
Rahut, D. B., A. Ali, and B. Behera. (2015). Household participation and Effects of Community Forest Management on Income and Proverly Levels: Empirical evidence from Bhuton. Forest Policy and Economics 61, 20-29.
Rajati, T., C.Kusmana, D. Darusman, dan A. Saefuddin. (2006). Optimalisasi Pemanfaatan Lahan Kehutanan dalam rangka Peningkatan Kualitas Lingkungan dan Kesejahteraan Sosial Ekonomi Masyarakat Desa Sekitar Hutan : Studi Kasus di Kabupaten Sumedang. Jurnal Manajemen Hutan Tropika Vol.XII, no.1, 38-50.
Sitorus, F.M.T., Supriono, A., Sumarti, T., Gunardi, (1996). Memahami dan Menanggulangi Kemiskinan di Indonesia (Prof. Dr. Sajogyo 70 Tahun). Jakarta : PT. Gramedia Widiasarana Indonesia.
Surat Keputusan Menteri Kehutanan. Nomor 49 Tahun 1997 (SK Menhut No. 49/Kpts-II/1997) tentang
Pendanaan dan Usaha. 1997 diperbanyak oleh Negara Kesatuan Republik Indonesia.
Sajogyo, Soekarno, Saragih, B., Sumardjo, Harianto, Darmawan, A.H., Indaryanti, Y., Utomo, B.S., (2006). Garis Kemiskinan dan Kebutuhan Minimum Pangan., Indaryanti, Y., [editor]., (1977). Pusat Studi Pengembagan Pertanian dan Pedesaan-LPPM IPB. Bogor.
Central Sulawesi. In T. Tscharntke, C. Leuschner, M. Zeller, E. Guharja, A. Bidin (eds), The Stability of Tropical Rainforest Margins, Linking Ecological, Economic and Social Constraints of Land Use and Conservation(pp. 207-222). Berlin:Springer Verlag.
The World Bank, (2006). Melestarikan Pertumbuhan ekonomi, Penghidupan Pedesaan, dan Manfaat Lingkungan : Opsi-opsi Strategis untuk Bantuan Kehutanan di Indonesia. Jakarta, Indonesia: The International Bank for Reconstruction and Development, The World Bank.
Undang-Undang Nomor 41 Tahun 1999 tentang
Kehutanan. 1999 diperbanyak oleh Negara Kesatuan Republik Indonesia.