WOMEN FARMERS RESPOND ABOUT RICE BARN VILLAGE
PROGRAM IN THE PAMOTAN VILLAGE, DAMPIT DISTRICT,
MALANG REGENCY
Kadhung Prayoga1*and Yayuk Yuliati2
Social Economy Department, Agriculture Faculty, Brawijaya University, Jl. Veteran, Malang 65145, Indonesia
Received: 30th July 2015; Revised: 20th August 2015; Accepted; 4th September 2015
ABSTRACT
Malang District was one of the recipients of the Village Food Barn Program because as rice production centre in East Java Province and the majority of the population work as farmers. On food barn village program implementation in Malang District is not only involves men farmers but also include women farmers participation. This research aims to analyse whether there is influence among knowledge, attitude and skill against the formation of women farmers’ response on food barn village in Pamotan Village, Dampit Subdistrict, Malang Regency. Women farmers to be sampled in this research, determination of sample do with non-probability approach and using purposive sampling methods by as much as 45 respondents. The analysis includes descriptive analysis, scoring with likert scale, and path analysis (Structural Equation Modelling). Results of the analysis show that variable knowledge turns out to affect positively against the response variables. Although its influence is indirect effect and no direct effect against the response with the value of indirect effect is 0.041. The attitude variable influences are directly and positively to the establishment of a response and the value is 1.18. Means that each an increase in attitude, it will increase the formation of a response by 1.18. Skill variable is directly affecting for establishment the response but it has negative values and the value is -0.30. Means that every single increase in skill, it will reduce establishment of the response of 0.30.
Keywords: women farmer; knowledge; attitude; skill; response 1. Introduction
Domestic rice production is increase from year to year, although basically the growth rate tends to decrease. Indonesia rice production is 30.70 million tons in 2005, or it is increase around 0.85% per year. The stock of the rice in Indonesia itself is around 165.23 kg / capita / year in 2012 (National Socioeconomic Survey -Statistics Indonesia, 2012). On the other side, the population growth in Indonesia is growing rapidly, it is around 1.49% per year in 1990-2000 (Statistics Indonesia, 2000) with rice consumption rate around 97.6 kg/capita/year in 2012. The growth of rice production tends to decrease and relatively slow, this is not comparable with the growth of the population in Indonesia which growing fast. This condition shows that Indonesia still lack of food needs, so
the government takes a decision to import rice
from the other countries. In 2102, Indonesia’s rice import is up to 1,927,563 tons (Statistics Indonesia, 2014).
This circumstance would lead to the emergence insecurity in Indonesia. One effort to overcome the food insecurity experienced by the population of Indonesia is to make the Village Food Barn Program. In the implementation of the Village Food Barn Program in Pamotan Village, Dampit District, Malang Regency involve not only farmers but also involve men participation of women farmers.
In Pamotan village, the food problem is not only the responsibility of male farmers, but also the responsibility of women farmers. Women farmers should be also included to address the problem of food in the village area. Participation of women farmers is expected to accelerate the development of the village and finding the solutions for the problems in the village. The response of women farmers on the implementation of the barn village program is one of the matters that determine the success of the program. The response is influenced by three
---*)
Correspondence author.
things: knowledge, attitudes and skills, where three interrelated before the response is formed.
The purpose of this study is to analyze the influence of knowledge, attitudes and skills to the response of women farmers in the barn village program in Pamotan Village, Dampit District, Malang Regency. The usefulness of this study are (1) as a reference and evaluation for agricultural extension and Chairman of Farmers Group Association to create the various policies in order to increase knowledge, attitudes, skills and response of women farmers associated with the barn village program, and (2) as a reference for further research on response to women farmers.
There are several problems faced by rice farmers and women farmers are: difficult to collect women farmers in the forum, is the lack of training, low selling price of rice, the high price of rice seeds, the high prices of agricultural machinery to cultivate the rice and rice post-harvest activities that low became the problem for women farmers there. Efforts made by the government to address the problems in the Pamotan Village is organizes the Food Barn Village Community. In the implementation of the barn village program in Pamotan Village, all elements of society involved, both men and women.
The response of women farmers on the implementation of the barn village program is one of the things that determine the success of the program. If the response of women farmers is high then the purpose of the barn village program would be more quickly achieved, because it has included the participation of women farmers in the implementation.
The response and participation of women farmers in the barn village program is influenced by three variables: (1) knowledge, (2) Attitude and (3) Skills. These three components are interrelated, influence one another and the response is a complex interaction of these components. A positive response would result in a change of behavior in increasing the role of women farmers and development program execution village barns.
2. Research Method
2.1. Research Locations and Respondents
This research was conducted in the village of Pamotan, Dampit District, Malang Regency in January 2015. The location determination is done by purposive, with some consideration, namely: this village is one of the barn village program
Respondents in this research consist of two types, namely women farmers and farm workers. Sample determination of women farmers carried out by non-probability approach and using purposive sampling method. Such considerations are not known population of women farmers.
The number of samples used in this research was 45 respondents that are adjusted to the data analysis method used is Structural Equation Modeling (SEM):
n = ( ) ...(1) Descriptions:
n = number of respondents.
k = Number of Indicators for all variables. 2.2. Data Collection and Analysis
Data used in this research are primary data and secondary data. Primary data collection was conducted using structured interviews, focus group discussions and participatory observation, and while secondary data collection methods of documentation.
Methods of data analysis in this research are as follows:
1. Qualitative Descriptive Analysis
In this research illustrates the general state of the research area, the characteristics of respondents by age, level of education, land, land ownership, farming experience and number of family and to describe the stages and the role of the program.
2. Quantitative Analysis
Quantitative analysis is performed to determine the path analysis response of women farmers in the village food barn program.
a. Validity Test
Validity test of this research using a significance level of 5% to the value of r table (0.294).
= (∑ ) (∑ ).(∑ )
{ .∑ (∑ ) .( .∑ (∑ ) )} ... (2)
Description:
r value = correlation coefficient n = number of respondents
∑ = Total score of question items
∑ = Total score of all items Testing criteria are as follows:
If the r value > r table means that the question items is valid.
If r value < r table means that the question items is not a valid.
b. Reliability Test
Reliability is an index that indicates the extent to which a reliable measuring instrument. According to Rianse and Abdi (2008), to determine whether or not a reliable measuring instrument, was tested using Cronbach Alpha formula and its value must be greater than 0.6:
= (1 − ²
²) ... (3)
Description:
R = Reliability instruments k = number of the questions b2 = Total item variance t2 = Total varians
c. Scoring using Likert Scale
This study uses ordinal scale of five scales, namely:
Do not Know / Disagree / Able = 1 Less Know / Disagree / Able = 2
Undecided = 3
Know / Disagree / Able = 4 Highly Know / Disagree / Able = 5
The stages in the scoring are as follows: 1) Determine the number of classes, there are
two: 1) high and 2) low. 2) Create a class interval.
3) Determine the range, with the formula:
R (X) = Xt–Xr ... (4) R (Y) = Yt–Yr ... (5) Where:
R = Range.
Xt = the highest observation value on the variable X.
Xr = the lowest observations on the
variable X.
Yt = The highest observation value on the variable Y.
Yr = The lowest observations value on variable Y.
4) Determine the interval in class (I), using the formula:
I = R / K ... (6) Where:
I = Interval in the class.
R = Range.
K = the number of class.
d. Analysis of SEM (Structural Equation Modeling)
In this research measures the formation of structural equation model in accordance with the opinion of Hair (2006), namely:
1) The development of a theory-based on model. 2) Identification of the model.
3) Development of the path diagram.
4) Conversion of specification models in the form of equations series.
5) Selection of the input matrix and the estimation of technique to the model.
6) Assess the problem of identification. 7) Evaluation of models.
3. Results and Discussion
3.1. Implementation of Food Barn Village Program in the Pamotan Village, Dampit District, Malang Regency
Food Barn Village Program in Pamotan Village is implemented by all the people who administered Association of farmer group ofTani Makmur. Barn Village program started in 2011 with a capacity of 30-40 tons of paddy / rice.
Funding source of barn village program activities comes from the Regional Government Budget of East Java Province of IDR 50,000,000 and from non-governmental donations to the physical build barns and in the development stage are given IDR 20,000,000 for charging the barn.
The following is an explanation of the stages of the implementation of the activities program in the food barns in Pamotan Village is as follows:
1. Planning and Preparation Phases
At this stage of the planning and preparation of women farmers was briefed on the barn village program. It also conducted a group work plan formulation, which is the general plan of the group related to the needs and wants of members.
Group work plan made by all socialization participants form the small groups, where each member of a small group will determine the things that will be done. The conference also discussed the physical construction of barns, how to overcome with post-harvest pests and plan of funds utilization.
2. Implementation Phase
Barn Village in the Pamotan Village conducts drying, milling, packaging and storage of rice. Barns here also perform store-sales services and process paddy into rice.
3. Monitoring and Evaluation Phases
Monitoring and evaluation activities in the barn village program aimed to determine progress in achieving goals and providing feedback on its efforts to find out the problems faced. The execution time is periodic, namely two times a year. Monitoring and evaluation performed by a designated officer
For a description of the explanation of the role of the barn village in the Pamotan Village is as follows:
a. Food Reserves
Food reserve in question is stored food that is in the barn. Food reserves serve as a means to assist the community in meeting food needs anyway and used to anticipate temporary food shortages caused by erratic fluctuations in the season, nuisance pest.
b. Media of Savings and Loans
Communities can borrow food needs in the form of rice in the dry season or during famine. People who borrow rice barns in the village must be willing to return the loan at a specified time period along with additional interest.
Loan rice channeled through the head of neighbourhood groups in every hamlet in Pamotan Village, then distributed to the people who borrowed rice. At the time should collect,
the barn manager will send an invitation containing rice borrowed amount along with interest to be returned. Invitations submitted a week before the deadline of return.
c. Food Stability
Food stability associated with the household food needs are stabilized by utilizing barn village to meet basic food needs at any time if experience food shortages. Rice is in the barn can be used by people in the Pamotan Village to feed continuously, so that people will be more easy to obtain food needs.
3.2. Analysis of Structural Equation Modeling (SEM)
In the analysis of LISREL according to Wijanto (2008), there are five stages to conduct SEM analysis is as follows:
1. Model Specifications
There are four concepts that are involved in this research that knowledge, attitudes, skills and response. Knowledge as the latent exogenous and endogenous latent is the attitude, skill and responsiveness. As for the observed variables that are 9 variables as listed in Table 1.
2. Identification
To identify, first seen is the amount of data that is known. In this research, there are nine indicators; it takes a minimum of 45 respondents to the processing of SEM analysis in this research. The parameters in this research are: B = Consists of 3 parameters
ɼ = Consists of 1 parameter ɅX = Consists of 2 parameters ɅY = Consisting of 7 parameters ϴ
δ = Consisting of 2 parameters ϴ
ε = Consisting of 7 parameters Ψ = Consisting of 3 parameters Φ = Consisting of 1 parameter
From here we can see the Degree of Freedom, which is 45-26 = 19. Value of df is 19. It means greater than 0 or positive and this means that the model is made is Over Identified.
3. Estimation
4. Testing Fit
The compatibility test is the level of compatibility between the data model, the
validity and reliability of the measurement model as well as the significance of the structural model.
Table 1.Model Specifications of SEM
Latent Variable Symbol Indicator Symbol Programming Language
Exogenous
Knowledge ξ1 Program
Knowledge Commodity Knowledge
X1
X2
Peng.Pro
Peng.Kom
Endogenous
Attitude η1 Perception
Motivation
Y1
Y2
Perception Motivation
Skill η2 Managerial Skill
Technical Skill
Y3
Y4
Manager Technic
Response η3 Impact
Readiness Training
Y5
Y6
Y7
Impact Readiness
Training Descriptions:
Peng.Pro : Program Knowledge Peng.Kom : Commodity Knowledge a. Compatibility of Overall Model
The first stage of compatibility test of this research is to analyze the degree of Goodness of Fit between the data held by the model created.
Here is a model Goodness of Fit Test on the final model with 50 iterations has been modified five times:
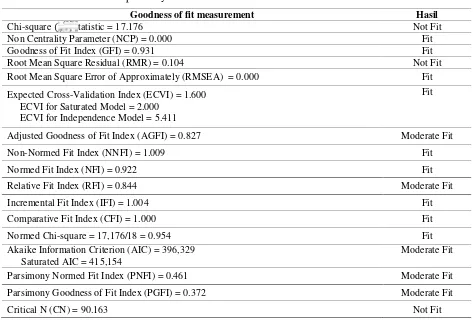
Table 2.The Result of Compatibility Test of Overall Model
Goodness of fit measurement Hasil
Chi-square( ) statistic = 17.176 Not Fit
Non Centrality Parameter (NCP) = 0.000 Fit
Goodness of Fit Index (GFI) = 0.931 Fit
Root Mean Square Residual (RMR) = 0.104 Not Fit
Root Mean Square Error of Approximately (RMSEA) = 0.000 Fit
Expected Cross-Validation Index (ECVI) = 1.600 ECVI for Saturated Model = 2.000
ECVI for Independence Model = 5.411
Fit
Adjusted Goodness of Fit Index (AGFI) = 0.827 Moderate Fit
Non-Normed Fit Index (NNFI) = 1.009 Fit
Normed Fit Index (NFI) = 0.922 Fit
Relative Fit Index (RFI) = 0.844 Moderate Fit
Incremental Fit Index (IFI) = 1.004 Fit
Comparative Fit Index (CFI) = 1.000 Fit
Normed Chi-square = 17,176/18 = 0.954 Fit
Akaike Information Criterion (AIC) = 396,329 Saturated AIC = 415,154
Moderate Fit
Parsimony Normed Fit Index (PNFI) = 0.461 Moderate Fit
Parsimony Goodness of Fit Index (PGFI) = 0.372 Moderate Fit
Critical N (CN) = 90.163 Not Fit
b. Compatibility Test of Measurement Model An evaluation of each model of the measurement is through two ways to test the
indicator according to Ringdon and Ferguson (1991) is as follows:
1) Value of the t-value (Loading Factors) must be greater than the critical value (≥ 1.96).
2) To view the reliability, the standard of load factor (Standardized Loading Factors) value must be greater or equal to 0.70 or ≥ 0.50.
Table 3.The Result of Validity and Reliability Model
Observed Variables
Latent Variable
Validity
Knowledge Attitude Skill Response
SLF
t-value
SLF
t-value
SLF
t-value
SLF
t-value
Program Knowledge
0.56 3.63 Valid
Commodity Knowledge
0.63 4.14 Valid
Perception 0.25 * Valid
Motivation 0.63 5.12 Valid
Managerial Skill
0.81 * Valid
Technical Skill 0.66 4.99 Valid
Impact 0.42 * Valid
Readiness 0.83 3.62 Valid
Training 0.25 3.48 Valid
* = Set defaut by LISREL, the value was not estimated. From Table 3 it is known that all variables have SLF observed more than 0.50, but there are three variables that have SLF below the 0.50. This is because the value determined by the model since its inception. Variables observed in this study as a whole also has a value of t-value greater than 1.96 which means that the model is valid and reliable.
c. Compatibility Test of Structural Model and Hypothesis Test
The evaluation of the structural model includes the value of the t-value, coefficient and coefficient of determination (R2). From the analysis we also linkages between the variables of knowledge, attitudes and skills as showed in Table 4 and Table 5.
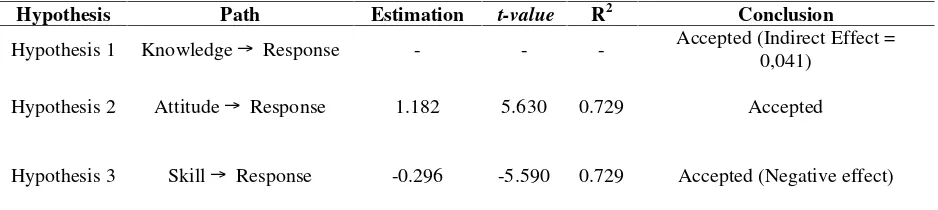
Table 4.Estimation of Parameter Value for SEM Model
Hypothesis Path Estimation t-value R2 Conclusion
Hypothesis 1 Knowledge→ Response - - - Accepted (Indirect Effect = 0,041)
Hypothesis 2 Attitude→ Response 1.182 5.630 0.729 Accepted
Hypothesis 3 Skill→ Response -0.296 -5.590 0.729 Accepted (Negative effect)
Aside from the above hypothesis testing found also lingkage between the variables
knowledge, attitudes, and skills that can be seen in Table 5 below:
Table 5.Estimation of Parameters Value for SEM Model
No. Path Estimation t-value R2
1 Knowledge→ Attitude 0.109 2.84 0.677
2 Attitude→ Skill 2.713 4.61 0.633
5. Direct, Indirect and Total Effect
This section provides information related to the effect of endogenous latent variables directly against other variables that influence.
0.25
Tabel 6.Direct, IndirectandTotal Effectamong Latent Variable in the Model
Latent Var.
Direct Effect Indirect Effect Total Effect
Knowledge Attitude Skill Knowledge Attitude Skill Knowledge Attitude Skill
Attitude 0.11 0.11
Skill 2.71 0.29 0.29 2.71
Response 1.18 -0.30 0.041 -0.81 0.041 0.37 -0.30
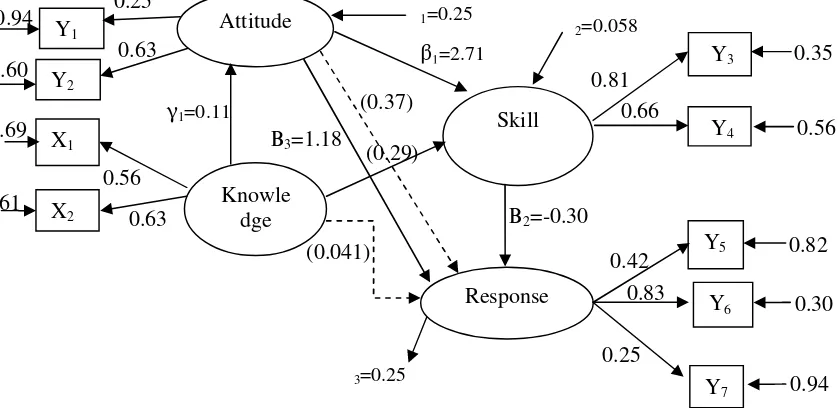
In this case, the direct effect of attitude variable to knowledge variable is small. Attitude itself has a large direct effect on the skills and responses, moreover, directly skills possessed by women farmers turned out to be a negative influence on the formation of women farmer response.
Indirect effect is a relationship between two latent variables that can be encountered when there is no direct arrow between the latent variables, but through one or more other latent variables in accordance with the existing track. On the table can also be seen that the knowledge variable indirect effect on the formation and response skills. Indirectly attitude also adversely affects the response even as the total attitude of forming a positive response.
The total effect is the sum of direct and indirect effects. Knowledge influence the formation of attitudes and skills of 0.11 and 0.29, this value indicates a weak correlation between knowledge with attitude and skills. And the total effect on the response to the knowledge of only 0.041. This value is very small, which means the relationship between knowledge and the response is very small.
Attitude will further affect the formation of the skills of 2.71; this value indicates a strong relationship between attitudes and skills. Attitudes also affect the response to the formation of 0.37, which means there is also a moderate correlation between attitude and response. However, there is a negative relationship between skills and response.
Figure 1.Path Digram of Women Farmers against Food Barn Village Program
3.3. Response of Women Farmers against Program Food Barn Village
The response of women farmers who are affected by three things: knowledge, attitude and skills will be discussed in this reserach, as follows:
1. Knowledge of Women Farmers
0.25
0.56
0.63
0,041
0.42
0.83
Table 7.Knowledge of Women Farmers of the Food Barn Village Program
No Indicators Max. Score Field Score Percentage (%) Category
1. Definition barn village 5 2.44 48.8 Low
2. Benefits barn village 5 2.44 48.8 Low
3. Terms of establishment a physical building
5 1.93 38.6 Low
4. Terms of the program 5 3.42 68.4 High
5. Making the rules 5 1.84 36.8 Low
6. implementation of the extension
5 1.93 38.6 Low
7. Type of rice stored 5 3.58 71.6 High
8. The amount of rice stored
5 3.40 68.0 High
9. The duration of rice storage
5 3.00 60.0 Low
10. Pest and disease control in rice
5 3.73 74.6 High
Total 50 27.71 55.42 Low
The Low knowledge of women farmers occur for several reasons, such as: (1) the level of education of women farmers is relatively low, (2) less participate in extension activities, (3) women farmers have an average age of 50 years, interest, comprehension and their memory of the program already low, (4) difficult to communicate and discuss related programs, (5) there is a lack of experience of women farmers in managing the barn village program, and (6) the channel or
media used to convey information about the program yet maximum.
On the other hand, knowledge of women farmers on commodities is high. The high knowledge of them is because rice is a commodity that has been long since they knew and know. Here, the variable knowledge positively influences the response, though its influence is indirect effect of 0.041.
Figure 2.Path Diagram of Knowledge Effect against Response These results are in accordance with the
opinion of Gibson (1996) that knowledge is only concerned with what they know and have not reached the stage of the response. Before getting to the response prior knowledge will affect a person's attitude.
2. Attitude of Women Farmers
Attitude indicator in the research includes the perception and motivation. The attitude of women farmers is a level of agreement with the tendency to act in accordance with the experience they already have before.
Y
6Y
7X
1X
2Response
Knowledge
0.30
0.94
0.69
0.61
Y
50.25
0.25 0.63
1,18 0.42
0.83
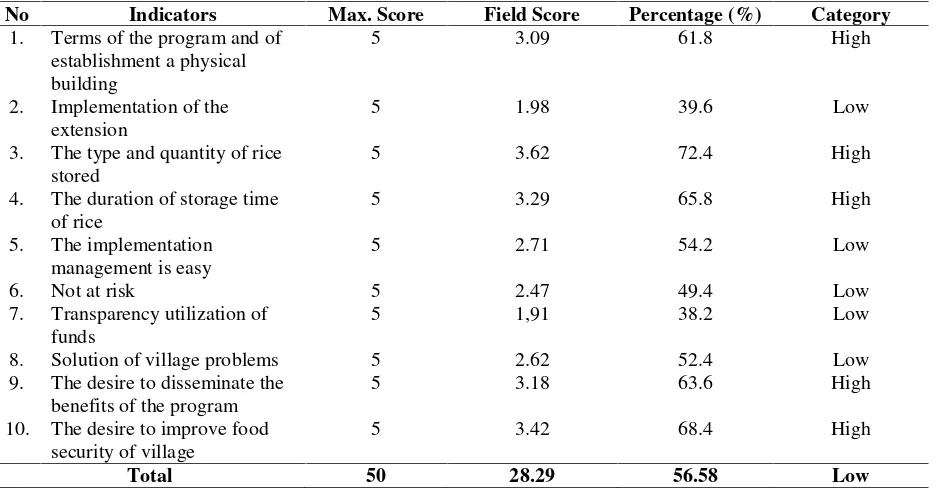
Table 8.Women Farmer Attitudes toward Food Barn Village Program
No Indicators Max. Score Field Score Percentage (%) Category
1. Terms of the program and of establishment a physical building
5 3.09 61.8 High
2. Implementation of the extension
5 1.98 39.6 Low
3. The type and quantity of rice stored
5 3.62 72.4 High
4. The duration of storage time of rice
5 3.29 65.8 High
5. The implementation management is easy
5 2.71 54.2 Low
6. Not at risk 5 2.47 49.4 Low
7. Transparency utilization of funds
5 1,91 38.2 Low
8. Solution of village problems 5 2.62 52.4 Low
9. The desire to disseminate the benefits of the program
5 3.18 63.6 High
10. The desire to improve food security of village
5 3.42 68.4 High
Total 50 28.29 56.58 Low
Although the results of the above known attitude towards women farmers barn village program is low, it turns out the attitude of women farmers directly affects the response of women farmers by 1.18. Attitude alone in addition to having a direct effect on the response turned out to be an attitude also directly affects the skills of women farmers. Such situation can happen because getting them interested in the program, they will be actively participating in the program and get the skills they will also increase. Attitudes that directly and positively impact the response due to: (1) have a desire to spread the benefits of the barn village program against the other women farmers, and (2) have a desire to improve food security in the Pamotan Village.
From the analysis it is also known that the attitude indirectly affect negatively towards the response, even as totaty the attitude forming a
positive response. This can happen because (1) women farmers is difficult to accept the existence of a new program, (2) women farmers feel the program is too risky, (3) the experience of women farmers who are not unpleasant to the previous program, (4) considers that government programs are not pro with poor people, (5) the management of the program is not easy, (6) barn villages program is still not able to help women farmers to achieve its objectives, (9) the barns program still do not have closeness with the background of social women farmers, (10) barns deemed not to have different characteristics compared to the previous program that never existed, and (11) there is not good communication between the extension agent and head of farmer group association with women farmers.
Figure 3.Path Diagram of Attitudes Effect toward Response
Y
6Y
7Y
1Y
2Response
Attitude
0.30
0.94
0.94
0.60
Y
5The below shows that there is an otistik hatred of women farmers to the program and executing. Otistik hatred is a condition where there is hatred so that someone will shut themselves from the unpopular these (Sarwono, 1985). Attitudes that negatively affect the response also occurs because women farmers are still hesitant about the program and the frame of reference of the program is not in accordance with the social environment of women farmers and it could be a boomerang effect where attitudes are formed instead (Gerungan, 2000). Incentive theory also explains that someone would take the attitude that maximizes profits. According to Ahmadi (1991), a person who has a favorable attitude toward an object, they must be approached. Conversely, if someone has an attitude that is unfavorable then they will tend to avoid it. 3. Skill of Women Farmers
Skills are skills to carry out a physical job. In this research, the variables measured skills of two indicators of technical skills and managerial skills of women farmers.
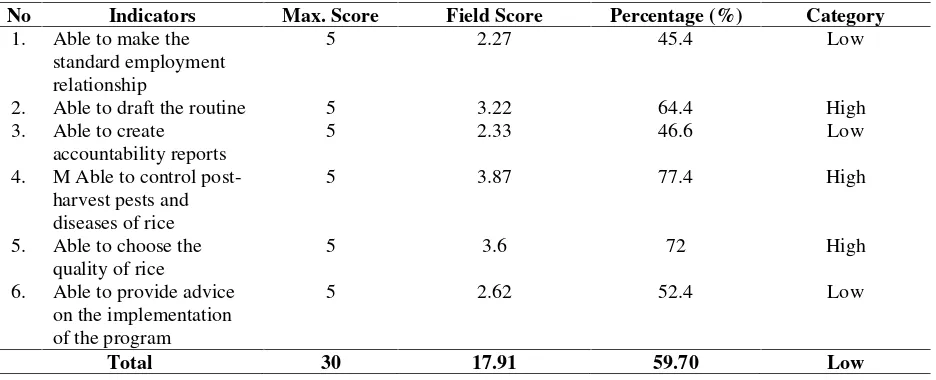
Respondents managerial skills of women farmers are still comparatively low. They are many who can not make the standard employment relationship and accountability reports. This is because many women farmers who are not included in the standard report creation and labor relations, only certain people who do this.
On the other hand, the technical skills of women farmers in the implementation of barn village are high. They have been able to control post-harvest pests and diseases in rice and already able to choose
Quality of rice will be stored in the barn. It is not in spite of the fact that the commodity of paddy / rice is a commodity that has been long since they knew.
Table 9.Skill of Women Farmers Againts Barn Village Program
No Indicators Max. Score Field Score Percentage (%) Category
1. Able to make the standard employment relationship
5 2.27 45.4 Low
2. Able to draft the routine 5 3.22 64.4 High
3. Able to create accountability reports
5 2.33 46.6 Low
4. M Able to control post-harvest pests and diseases of rice
5 3.87 77.4 High
5. Able to choose the quality of rice
5 3.6 72 High
6. Able to provide advice on the implementation of the program
5 2.62 52.4 Low
Total 30 17.91 59.70 Low
From the below results are known
variables skills directly affect the response of
women farmers, but the effect was negative
amounting to -0.30.
The third hypothesis test results in accordance with experiments that have been conducted by Ahmadi (1991), that if someone has the skills it will tend to be satisfied and will not try to perform other actions. Second, if before joint the program, he was already skilled then he will likely not be satisfied with the training provided by the program and likely will not be repeated again because he felt it could be that the response given is negative.
Directly, skill negatively affect on the response it is because: (1) women farmers
minded if they are skilled then for what they follow the program, (2) to make monthly reports and financial reports are still many women farmers not taught, (3) information not spread from woman farmers to woman farmers one another evenly, (5) they can not directly apply the knowledge contained in extension activities, and (6) the material is given less education according to the needs of women farmers.
0.25
0.56
0.63
-0,30
0.42
0.83
responses tends to be unclear as they have increased anxiety, confusion and ultimately
weaken the performance (Mercer, 2007).
Figure 4.Path Diagram of Skill Effect on Response Skills 4. Response of Women Farmers
The response was a final stage which is drawn up by the knowledge, attitudes and skills. Knowledge is the initial step is the introduction of women farmers to the program. Attitude is a
stage in the form of persuasion in which women farmers form a pleasing attitude or not to the program and skills are the result of the decision to follow the existing programs.
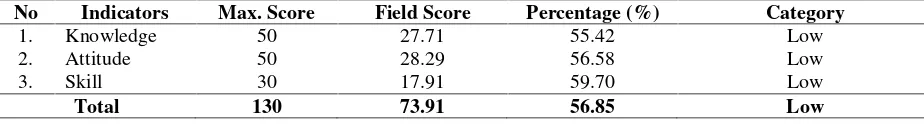
Table 10.Response of Woman Farmers Againts Barn Village Program
No Indicators Max. Score Field Score Percentage (%) Category
1. Knowledge 50 27.71 55.42 Low
2. Attitude 50 28.29 56.58 Low
3. Skill 30 17.91 59.70 Low
Total 130 73.91 56.85 Low
Knowledge is still low means women farmers of respondents did not know the information related to the barn village program. Low attitude occurs because the women farmers of respondents disagree with the program. Skills of women farmers is low, it means that the ability of women farmers of respondents still have not implemented what was recommended.
Positive responses to women farmers say if there was an increase in knowledge, attitudes and skills. Knowledge is said to be increased if there is a change from that originally did not know then be out and who already know to be more to know. Attitude is said to increase when there is a change from the past who initially did not want to be like. Skills is said to increase when if there is a change from that originally was not able to be able to do something.
This low response, in addition to some of the things that has been described for each of the variables above also caused by several things: (1) the difficulty of obtaining information relating to the barn village program, (2) extension agent and head of farmer group association less active in providing information, (3) women farmers have
not participated in preparing and determining the time and extension materials that do not suit their needs, and (4) women farmers are not ready to accept the risk and follow the barn village program.
According Soekartawi (2005), negative response also caused by rural food basket program incompatibilities. The program is not considered a continuation of the previous program, but the new program replaces the old program so that the response that arises is low. If the changes are too fast then the woman farmers would be difficult to make adjustments.
4. Conclusions
Based on research and analysis has been done, it can be deduced as follows:
Knowledge variable positively effect on the response variable, the effect is indirect effect with a value of 0.041. Knowledge will initially affect the attitude, and then it will affect the skills and ultimately will affect the response. To improve the knowledge of women farmers, should the head of farmer group association and
Y
6Y
7Y
3Y
4Response
Skill
0.30
0.94
0.35
0.56
Y
5extension activities often hold meetings with all the farmers both men and women in relation to the obstacles encountered and the information required.
Variable attitude positively effect on the response variable, where the response variable is able to be explained by the attitude variable of 72.9%. Direct effect value is 1.18, which means that every increase in the attitude, it will increase the formation of a response by 1.18. To improve the attitude of women farmers is to give praise to women farmers to help increase their fondness of the program and appreciate their presence. Head of farmer group association should also be more open and transparent in accounting for funds for community programs.
Variable skills negatively affect the response variable, where the response variable is able to be explained by the skills of 72.9%. Dirrect effect value is -0.30, which explains that each increase in skill, it will reduce the formation of the response of 0.30. To improve the skills of women farmers, the head of farmer group association should include them in all activities and initiatives to store commodities other than rice so that his skills will be increase. Extension activities should also be continuous and implement more direct knowledge contained in extension activities to the field.
References
[1]. Ahmadi, A. 1991. Social Psychology. PT. Rineke Cipta. Jakarta.
[2]. Gerungan, W. A. 2000. Social Psychology. PT. Eresco. Bandung
[3]. Gibson, et al. 1996. Organizations: Behavior, Structure, Processes. Binarupa. Jakarta.
[4]. Hair, J. F. 2006. Multivariate Data Analysis. Pearson International Edition. [5]. Mercer, J. and Clayton, D. 2007. Social
Psychology. Erlangga. Jakarta.
[6]. Rianse, U. and Abdi. 2008.
Social and
Economic
Research
Methodology:
Theory and Applications
. Alfabeta. Bandung.[7]. Rigdon, E. E. and Ferguson, C. E. 1991. The Performance of Polychoric Correlation Coefficient and Selected Fitting Functions in Confirmatory Factor Analysis with
Ordinal Data. Journal of Marketing Research.
[8]. Sarwono, S. 1985.
Theories of Social
Psychology
Rajawali Press. Jakarta. [9]. Soekartawi. 2005.Agribusiness
:Theory
and Application
. Raja Grafindo Persada. Jakarta.[10]. Statistics Indonesia. 2000. Data of Rice Production Period 1990-2000. Jakarta. [11]. Statistics Indonesia. 2014. Monthly Report
of Economic Development. Jakarta. [12]. Susenas. 2014.
National Labour Force
Survey
. Jakarta.[13]. Susenas dan BPS. 2012. Data of