http://dx.doi.org/10.17503/Agrivita-2014-36-3-217-228
GENETIC DIVERSITY OF NATURAL POPULATIONS OF Bactrocera occipitalis (Bezzi)
AND B. philippinensis Drew and Hancock (Diptera: Tephritidae)
IN SELECTED MANGO PRODUCING AREAS IN THE PHILIPPINES
USING MICROSATELLITES
Grace Sheila Paguibitan Jalani 1), Rita P. Laude1*), Maria Genaleen Q. Diaz1), Celia dR. Medina2) and Luis Rey I. Velasco2)
1)
Institute of Biological Sciences, College of Arts and Sciences, University of the Philippines Los Baños (UPLB), College, Laguna
2)
Crop Protection Cluster, College of Agriculture, University of the Philippines Los Baños (UPLB), College, Laguna
*) Corresponding author Phone: +63-49-536-2306 E-mail: [email protected]
Received: October 5, 2014 / Accepted: October 27, 2014
ABSTRACT
Using nine microsatellite loci, the genetic diversity of natural populations of Bactrocera occipitalis and B. philippinensis was investigated. Estimates of genetic diversity based on allele number (na and ne),
heterozygosity (Ho and He) and Shannon
information index (I) revealed that the Cavite population was the most genetically diverse (na
= 18.56; ne = 12.88; Ho = 0.58; He = 0.89; I =
2.55) and Pangasinan was the least (na = 7.89;
ne = 8.94; Ho = 0.34; He = 0.87; I = 2.31). Among
groups, the intermediates were the most genetically diverse (na = 25.44; ne = 15.30; Ho =
0.52; He = 0.92; I = 2.85) and B. philippinensis
was the least (na = 17.44; Ho = 0.44; He = 0.90; I
= 2.54). A low level of genetic diversity was detected among populations. Pangasinan and Palawan populations were the most related while Palawan and Guimaras populations were the least. Among groups, B. occipitalis and intermediates were the most related while B. occipitalis and B. philippinesis were the least. Dendrogram analysis indicated that B. occipitalis, B. philippinensis, and intermediates are not genetically distinct from each other. Keywords: Bactrocera occipitalis, B. philippinensis,
genetic diversity, microsatellite INTRODUCTION
The fruit flies of the genus Bactrocera are considered major pest species in Southeast
Asia, causing damage to most fruits, including mangoes, and many vegetables (Drew and Romig, 1996).
The Oriental fruit fly, B. dorsalis (Hendel) is the most cosmopolitan. However, the taxonomic revision by Drew and Hancock (1994) revealed that a complex of sibling species exists in the region, many of which are of economic significance. In the Philippines, among the existing thirteen complex sibling species B. dorsalis hasbeen misidentified (Drew, 2004).
The B. dorsalis complex includes two sympatric species; namely: B. occipitalis (Bezzi) and B. philippinensis Drew and Hancock. B. occipitalis is distributed in the Philippines and Borneo and its confirmed hosts are mango (Mangifera indica) and guava (Psidium guajava). On the other hand, B. philippinensis is native to the Philippines and it has been recorded in camansi (Artocarpus communis), papaya (Carica papaya), macopa (Syzygium malaccensis), mango (Mangifera indica), and wild rainforest host (Pouteria duklitan) (Drew and Hancock, 1994).
Grace Sheila Paguibitan Jalani et al.: Genetic Diversity Of Natural Populations of Bactrocera occipitalis (Bezzi)………
costal band of the wing to distinguish between B. occipitalis and B. philippinensis. Since these taxonomic characters are not reliable due to frequent observance of intermediates, aedeagal length has been used instead (Iwaizumi et al., 1997; Iwahashi, 1999a; Iwahashi, 1999b; Iwahashi, 2001).
Several genetic approaches have been employed to rapidly identify and discriminate the two species. Isozyme study using six presumptive loci coding for enzymes, acid phosphatase (ACP), alkaline phosphatase (ALP), esterase (EST) and malic enzyme (ME), showed genetic similarity between B. occipitalis and B. philippinensis of the morphological groups 0 and 6, respectively from Puerto Princesa, Palawan, Philippines (Borja, et al. 2010. While another study using eight presumptive loci coding for the enzyme ACP, ALP and EST, revealed that the Bactrocera spp. groups in the Guimaras population had higher genetic diversity and that a considerable genetic variation occurred among the groups.
RAPD-PCR using seven primers showed a low genetic variation among 15 males from reared population of B. philippinensis indicating that the individuals were closely related (Dolores, 2003). Results of two separate DNA barcoding using 5’ end of the mitochondrial cytochrome c oxidase sub-unit and morphometric analysis of fruit flies from Cavite and Davao del Norte (Delomen et al., 2013) and from Guimaras, Philippines (Sumalde et al., 2013) showed no significant differences between B. occipitalis and B. philippinensis hence could not delineate between them.
DNA probes were used to discriminate the three Tephritid species Ceratitis capitata, B. dorsalis and B. cucurbitae (Haymer et al., 1994). PCR-RFLP analysis of the mitochondrial DNA was used to discriminate among pest species of Bactrocera (Nei, 1978). Recently, a new technique combining real-time PCR using SYBR
Green assay with melting curve analysis successfully identified B. occipitalis and B. philippinensis (Yu et al., 2005).
Microsatellite markers isolated from B. dorsalis sensu stricto (Aketarawong et al., 2006) have shown potential utility as population and species markers for the B. dorsalis complex.
This study was conducted to determine the extent of genetic diversity within and among natural populations of combined B. occipitalis, B. philipppinensis and their intermediates in selected mango-producing provinces of the Philippines. In addition, it was aimed to determine the extent of genetic diversity within and among B. occipitalis and B. philippinensis and intermediate groups classified according to the method of Iwahashi (1999a).
MATERIALS AND METHODS
Place and Time of Implementation
The study was conducted at the Molecular Biology and Biotechnology Laboratory of the Institute of Biological Sciences, University of the Philippines Los Baños, College Laguna Philippines from December 2007 to December 2009.
Fruit Fly Materials
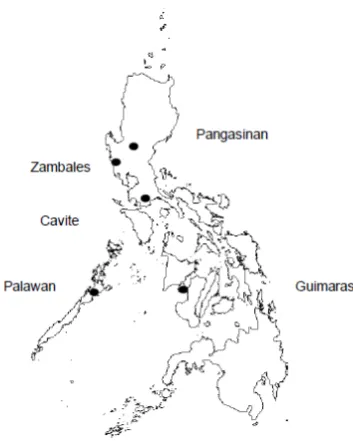
Figure 1. Philippine map, showing the five sample collection sites. Microsatellite Analysis
Genomic DNA was extracted from a total of 116 adult flies at 30 adults each from Pangasinan, Cavite and Palawan and 26 from Guimaras for microsatellite analysis following the manufacturer’s instructions of DNeasy® blood and tissue kit (Qiagen) and quantified by spectrophotometer. Nine (Bd1, Bd6, Bd19,Bd37, Bd39, Bd43A, Bd43B, Bd76 and Bd98) out of 17 novel microsatellite markers isolated from from B. dorsalis sensu stricto (Aketarawong et al., 2006) were used. PCR primers were synthesized by Invitrogen.
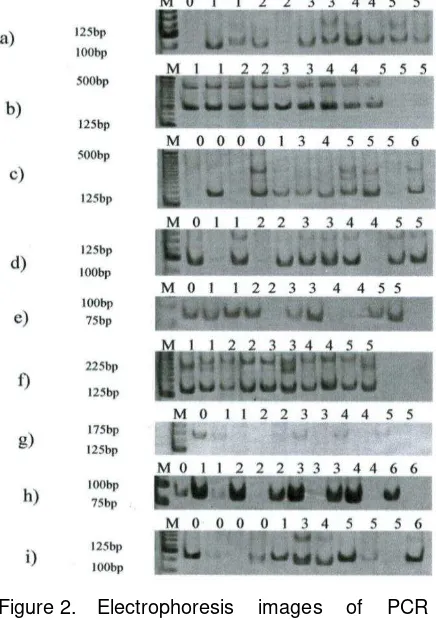
The PCR reactions were carried out in My CyclerTM Thermal Cycler (Biorad) programmed for 5 min at 94°C followed by 29 cycles of 30 s at 94°C, 90s at 55-67°C and 90 s at 72°C, and 5 min at 72°C. The PCR products were separated on 8% polyacrylamide gel. The gel was run at 50V and was silver stained following the method of Benbouza et al. (2006).
Data Analysis
The sizes of the microsatellite alleles were determined using the AlphaEaseFC (Stand Alone) Version 4.0 software (Alpha Innotech). Statistical evaluations of genotypic data were performed using POPGENE version 1.31 software (Yeh et al., 1999), available online at
http://ftp.microsoft.com/Softlib/MSLFILES/HPGL. EXE.
Comparison of Microsatellite Variation in B. occipitalis and B. philippinensis with Isozyme Variation and Morphological Classification
Using mere inspection, the results of microsatellite analysis were compared with the findings of a previous study using isozyme analysis (Velasco et al., 2010) to determine if the results of the two analyses agreed with each other. To compare microsatellite analysis with morphological classification, the clustering of groups based on dendrogram analysis of microsatellite data was compared with the groupings based on morphological classification of Iwahashi (1999a).
RESULTS AND DISCUSSION
Genetic Diversity of Natural Populations of Combined B. occipitalis, B. philippinensis, and Their Intermediates
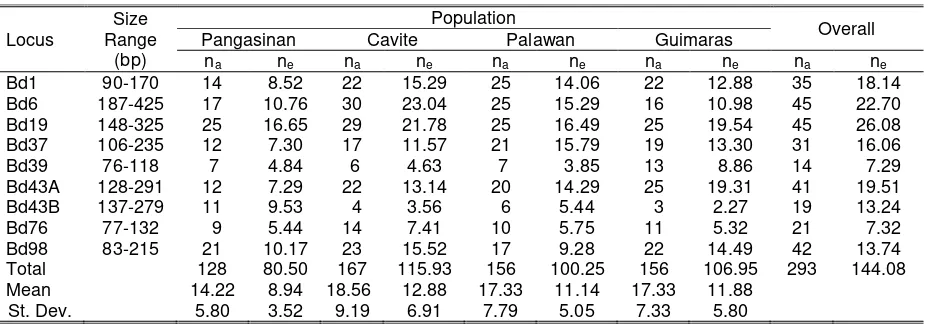
Intrapopulation Estimates of Genetic Diversity Figure 2 and Table 1 shows the observed number of alleles (na) which ranged from 14 for
Grace Sheila Paguibitan Jalani et al.: Genetic Diversity Of Natural Populations of Bactrocera occipitalis (Bezzi)………
The highest mean na was observed in
Cavite (18.56), while the lowest was recorded in Pangasinan (14.22). Lower values were reported in B. dorsalis sensu stricto populations (Aketawarong et al., 2006) with na ranging from
1 to 11 alleles per locus.
As shown in Table 2, the mean Ho per
locus per population ranged from 0.34 in Pangasinan to 0.58 in Cavite. Aketarawong et al. (2006) reported a relatively lower range of mean Ho in B. dorsalis sensu stricto populations (0.305 to 0.451). Cavite had the highest mean He of 0.89, followed by Palawan (0.88) and
Pangasinan and Guimaras (0.87). Lower He
values (0.507-0.615) were even obtained in B. dorsalis sensu stricto populations (Aketawarong et al., 2006).
The Shannon information index (I) value was observed highest in Cavite (2.55) and lowest in Pangasinan (2.31). In all populations, I values ranged from 2.21 in Bd39 to 3.51 in Bd19, with overall mean of 2.97, revealing a relatively high level of genetic diversity. These values are higher than those reported in B. dorsalis (Hendel) populations, which exhibited mean I value of 0.7870 (Li et al., 2007).
Based on the three estimates of intrapopulation genetic diversity, the Cavite population is the most genetically diverse while Pangasinan is the least. The high diversity in Cavite is indicative of permanent, continuously large and has highly effective population size The low diversity in Pangasinan, on the other hand, reflects reduction in population size. Since mango fruits were collected towards the end of the harvest season. Moreover, early rainfall caused only a few mango fruits to reach maturity. This may have caused the flies to find new hosts. According to Baruffi et al. (1995), dispersion itself might explain a reduction in variability (Table 2).
All populations showed deviations from HWE and four of the nine loci accounted for these deviations, namely Bd39, which showed HWE deviation in all populations, Bd43A in Pangasinan, Bd43B in Cavite, Palawan, and Guimaras, and Bd76 in Pangasinan, Palawan, and Guimaras. Fis values ranged from 0.1672 in Bd37 to 0.9310 in Bd39, with mean of 0.4904 (Table 3). This means that on the average, the populations were 49 % deficient of heterozygotes. HWE deviations as a result of heterozygote
deficiency may be attributed to null alleles, inbreeding, finite sample size, a chance of sampling effect or the combination of subpopulations (Aketarawong et al., 2006; Wang et al., 2003; Dai et al., 2004; Augustinos et al., 2005). Some samples failed to yield PCR products at loci Bd39, Bd43B, and Bd76 but they were successfully amplified at other loci, suggesting the existence of null alleles at these loci. Aketawarong et al. (2006) attributed the observed cases of HWE deviation in B. dorsalis sensu stricto populations for loci Bd1, Bd39, Bd43A, and Bd98 to inbreeding and/or null alleles.
Table 1. Observed number of alleles (na) and effective number of alleles (ne) at nine microsatellite loci in
four populations of combined Bactrocera occipitals, B. philippinensis, and their intermediates
Table 2. Observed heterozygosity (Ho), Nei (1978) expected heterozygosity (Ave Het), and Shannon
information index (I) at nine microsatellite loci in four populations of combined Bactrocera occipitalis, B. phiilippinensis, and their intermediates
Table 3. Probability (P) test for HWE and Wright’s (1978) fixation index (Fis) at nine microsatellite loci in
four populations of combined Bactrocera occipitalis, B. philippinensis, and their intermediate
Remarks: P-values based on likelihood ratio (G2) criterion. P<0.05 are highlighted Locus
Size Range
(bp)
Population
Overall
Pangasinan Cavite Palawan Guimaras
na ne na ne na ne na ne na ne
Bd1 90-170 14 8.52 22 15.29 25 14.06 22 12.88 35 18.14
Bd6 187-425 17 10.76 30 23.04 25 15.29 16 10.98 45 22.70
Bd19 148-325 25 16.65 29 21.78 25 16.49 25 19.54 45 26.08
Bd37 106-235 12 7.30 17 11.57 21 15.79 19 13.30 31 16.06
Bd39 76-118 7 4.84 6 4.63 7 3.85 13 8.86 14 7.29
Bd43A 128-291 12 7.29 22 13.14 20 14.29 25 19.31 41 19.51
Bd43B 137-279 11 9.53 4 3.56 6 5.44 3 2.27 19 13.24
Bd76 77-132 9 5.44 14 7.41 10 5.75 11 5.32 21 7.32
Bd98 83-215 21 10.17 23 15.52 17 9.28 22 14.49 42 13.74
Total 128 80.50 167 115.93 156 100.25 156 106.95 293 144.08
Mean 14.22 8.94 18.56 12.88 17.33 11.14 17.33 11.88
St. Dev. 5.80 3.52 9.19 6.91 7.79 5.05 7.33 5.80
Locus Pangasinan Cavite Palawan Guimaras Ave
Het Overall I
Ho He I Ho He I Ho He I Ho He I
Bd1 0.32 0.88 2.32 0.79 0.93 2.89 0.57 0.93 2.92 0.38 0.92 2.78 0.92 3.16
Bd6 0.52 0.91 2.60 0.83 0.96 3.26 0.59 0.93 2.97 0.89 0.91 2.58 0.93 3.43
Bd19 0.45 0.94 3.02 1.00 0.95 3.22 0.76 0.94 3.00 0.92 0.95 3.09 0.95 3.51
Bd37 0.48 0.86 2.16 0.93 0.91 2.60 0.87 0.94 2.88 0.80 0.92 2.74 0.91 3.04
Bd39 0.00 0.79 1.71 0.00 0.78 1.65 0.00 0.74 1.63 0.21 0.89 2.36 0.80 2.21
Bd43A 0.13 0.86 2.15 0.90 0.92 2.82 0.85 0.93 2.80 0.85 0.95 3.08 0.92 3.27
Bd43B 0.56 0.90 2.32 0.00 0.72 1.32 0.00 0.82 1.75 0.00 0.56 0.95 0.75 2.75
Bd76 0.11 0.82 1.88 0.37 0.87 2.27 0.20 0.83 1.96 0.19 0.81 1.92 0.83 2.35
Bd98 0.50 0.90 2.64 0.37 0.94 2.92 0.23 0.89 2.46 0.61 0.93 2.87 0.92 3.07
Mean 0.34 0.87 2.31 0.58 0.89 2.55 0.45 0.88 2.49 0.54 0.87 2.49 0.88 2.97
St. Dev. 0.21 0.05 0.40 0.40 0.08 0.68 0.35 0.07 0.56 0.35 0.12 0.68 0.07 0.46
Locus Population Fis
Pangasinan Cavite Palawan Guimaras
Bd1 0.0564 1.0000 1.0000 1.0000 0.4474
Bd6 0.9966 1.0000 1.0000 1.0000 0.2667
Bd19 1.0000 1.0000 1.0000 1.0000 0.1965
Bd37 0.3776 0.9939 1.0000 1.0000 0.1672
Bd39 0.0000 0.0000 0.0000 0.0163 0.9310
Bd43A 0.0000 1.0000 1.0000 1.0000 0.2942
Bd43B 0.9188 0.0004 0.0075 0.0064 0.8135
Bd76 0.0000 0.0658 0.0000 0.0005 0.7460
Bd98 1.0000 1.0000 0.4226 1.0000 0.5514
Grace Sheila Paguibitan Jalani et al.: Genetic Diversity Of Natural Populations of Bactrocera occipitalis (Bezzi)………
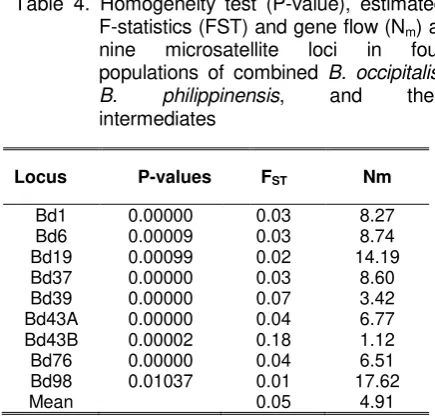
Interpopulation Estimates of Genetic Diversity Table 4 shows P-values based on likelihood ratio (G2) criterion (P<0.05) which indicated that all loci did not conform to the hypothesis that flies from the different sites do not constitute one population but segregated to smaller subpopulations.
Table 4. Homogeneity test (P-value), estimated F-statistics (FST) and gene flow (Nm) at
nine microsatellite loci in four populations of combined B. occipitalis, B. philippinensis, and their intermediates
The estimated F-statistics, FST, which represents genetic variation among populations (Yao et al., 2008) varied from 0.01 in Bd98 to 0.18 in Bd43B. Based on Wright’s (1978) guidelines, seven loci (Bd1, Bd6, Bd19, Bd37, Bd43A, Bd76, and Bd98) reflect little genetic variation, one (Bd39) indicate moderate genetic variation, and one (Bd43B) implies great genetic variation. The mean Fst value of 0.05, suggest that there is low genetic diversity among the four populations. This also implies that approximately 5% of the total genetic variation could be due to genetic variation among populations, while 95% is accounted for by the genetic variation within the population. The high degree of similarity among the four populations may be due to the extensive transportation of mangoes between provinces and probably the lack of quarantine restrictions in interprovincial movement of fruit commodities (except for Guimaras which has strict quarantine restrictions for mangoes), causing B. occipitalis and B. philippinensis to expand to their current range. A higher level of genetic diversity was detected at microsatellite
loci in B. dorsalis (Hendel) populations, with mean Fst value of 0.2370. The differences had been attributed to geographical isolation and barriers to gene flow (Li et al., 2007). Genetic diversity was also high at enzyme loci in populations of the Mediterranean fruit fly, Ceratitis capitata with average Fst values ranging from 0.108 to 0.283 (Kourti, 2004). The low Fst value (0.05) indicates considerable gene flow among the four populations. The number of migrants per generation, Nm, was estimated from Fst and is also shown in Table 6. It ranged from 1.12 in Bd43B to 17.62 in Bd98 with mean of 4.91. He and Haymer (1997) cited that, in theory, an average exchange of one individual per generation (Nm=1) is sufficient to prevent dramatic genetic differentiation for neutral alleles by genetic drift alone. In the case of migration are high enough to prevent dramatic differentiation. Bactrocera species are strong flies and highly mobile, moving large distances from 40 to 200 km (Fletcher, 1987), and this may be one reason for the gene flow among populations.
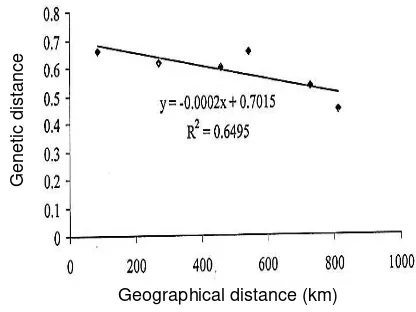
Table 5 shows the estimate of Nei’s (1978) unbiased genetic identity between populations which varied from 0.5177 between Palawan and Guimaras to 0.6397 between Pangasinan and Palawan. Genetic distance values ranged from 0.4467 between Pangasinan and Palawan to 0.6584 between Palawan and Guimaras. Among populations studied, Pangasinan and Palawan are the most related while Palawan and Guimaras are the least related. Regression analysis revealed negative correlation between genetic distance and geographical distance (Figure 3). Pangasinan and Palawan are geographically distant populations but they are most related. It is likely that Pangasinan and Palawan have similar environmental conditions. Sun et al. (1999) stated that geographically close habitats can be ecologically quite different, and conversely, habitats that are geographically distant from one another can be very similar in their environmental conditions. Mangoes have been one of the main trade products throughout the Philippines and it is therefore expected that B. occipitalis and B. philippinensis populations present low genetic distance values.
Table 5. Nei (1978) unbiased measures of genetic identity (above diagonal) and genetic distance (below diagonal) between the four populations of combined Bactrocera occipitalis, B. philippinensis, and their intermediates
Table 6. Observed number of alleles (na) and effective number of alleles (ne) at nine microsatellite loci in
Bactrocera occipitalis, B. philippinensis, and intermediates
Locus B. occipitalis B. philippinensis Intermediate Overall
na ne na ne na ne na ne
Bd1 29 15.64 19 10.32 30 17.71 37 18.82
Bd6 29 16.62 25 16.13 33 21.01 45 22.64
Bd19 29 14.16 28 20.18 38 26.62 45 25.96
Bd37 27 15.74 20 13.74 20 12.41 31 16.42
Bd39 8 6.16 9 6.96 12 7.15 14 7.38
Bd43A 27 12.17 22 14.23 33 20.15 41 19.18
Bd43B 11 7.58 6 5.44 10 8.07 19 12.77
Bd76 16 6.95 9 6.08 19 6.96 23 7.90
Bd98 25 9.35 19 11.61 34 17.61 42 13.96
Total 201 104.35 157 104.69 229 137.68 297 145.02
Mean 22.33 11.59 17.44 11.63 25.44 15.30
St. Dev. 8.35 4.15 7.70 4.96 10.35 7.00
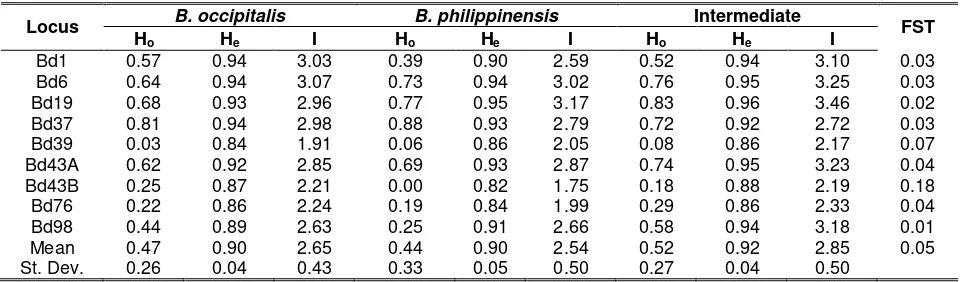
Table 7. Observed heterozygosity (Ho), Nei (1973) expected heterozygosity (He) and Shannon
information index (I) at nine microsatellite loci in Bactrocera occipitalis, B. philippinensis, and intermediates and F-statistics (FST) among them
Locus B. occipitalis B. philippinensis Intermediate FST
Ho He I Ho He I Ho He I
Bd1 0.57 0.94 3.03 0.39 0.90 2.59 0.52 0.94 3.10 0.03
Bd6 0.64 0.94 3.07 0.73 0.94 3.02 0.76 0.95 3.25 0.03
Bd19 0.68 0.93 2.96 0.77 0.95 3.17 0.83 0.96 3.46 0.02
Bd37 0.81 0.94 2.98 0.88 0.93 2.79 0.72 0.92 2.72 0.03
Bd39 0.03 0.84 1.91 0.06 0.86 2.05 0.08 0.86 2.17 0.07
Bd43A 0.62 0.92 2.85 0.69 0.93 2.87 0.74 0.95 3.23 0.04
Bd43B 0.25 0.87 2.21 0.00 0.82 1.75 0.18 0.88 2.19 0.18
Bd76 0.22 0.86 2.24 0.19 0.84 1.99 0.29 0.86 2.33 0.04
Bd98 0.44 0.89 2.63 0.25 0.91 2.66 0.58 0.94 3.18 0.01
Mean 0.47 0.90 2.65 0.44 0.90 2.54 0.52 0.92 2.85 0.05
St. Dev. 0.26 0.04 0.43 0.33 0.05 0.50 0.27 0.04 0.50
Population Cavite Guimaras Palawan Pangasinan
Cavite **** 0.5476 0.5187 0.5397
Guimaras 0.6021 **** 0.5177 0.5883
Palawan 0.6564 0.6584 **** 0.6397
Grace Sheila Paguibitan Jalani et al.: Genetic Diversity Of Natural Populations of Bactrocera occipitalis (Bezzi)………
http://dx.doi.org/10.17503/Agrivita-2014-36-3-217-228 Figure 3. Correlation between genetic and
geographical distances among the four populations of combined Bactrocera occipitalis, B. philippinensis, and their intermediates
A dendrogram based on genetic distance using UPGMA method shows that the four populations clustered together (Figure 4). This clustering may be the result of intensive trade of mangoes in the Luzon and Visayas areas. Genetic Diversity of B. occipitalis, B. philippinensis and Intermediate Groups
Estimates of Genetic Diversity within B. occipitalis, B. philippinensis and Intermediate Groups
Table 6 shows values of na that ranged
from 8 (Bd39) to 29 (Bd1, Bd6, and Bd19) in B. occipitalis, 6 (Bd43B) to 28 (Bd19) in B. philippinensis, and 12 (Bd39) to 38 (Bd19) in intermediates. B. philipinensis had the lowest na,
with mean of 17.44, while the intermediates had the highest, with mean of 25.44. For ne, the
lowest value was exhibited by B. occipitalis, with mean of 11.59, while the highest was exhibited by the intermediates, with mean of 15.30.
As shown in Table 7, B. philippinensis exhibited the lowest Ho value (0.44) while the
intermediates showed the highest (0.52). For He
values, B. occipitalis and B. philippinensis, had the same mean He (0.90), while the
intermediates exhibited a slightly higher mean He of 0.92. The lowest mean I value was
exhibited by B. philippinensis (2.54) while the highest was exhibited by the intermediates (2.85). The three estimates of genetic diversity
reveal that the intermediates are the most genetically diverse, which may be due to its large effective population size, while B. philippinensis is the least, which may be attributed to its small sample size.
Figure 4. UPGMA dendrogram based on Nei (1978) genetic distance showing the relationships among the four populations of combined B. occipitalis, B. philippinensis, and intermediates
Estimates of Genetic Diversity among B. occipitalis, B. philippinensis and Intermediate Groups
The estimated FST varied from 0.01
(Bd98) to 0.18 (Bd43B), with mean of 0.05 (Table 7), indicating low level of genetic diversity among B. occipitalis, B. philippinensis, and intermediates. This also implies that 5% of the total genetic variation is due to genetic variation among groups while 95% is due to genetic variation within groups. The low level of genetic diversity suggests that B. occipitalis, B. philippinensis, and intermediates may actually be the same rather that separate species. Genetic Identity, Genetic Distance and Cluster Analysis
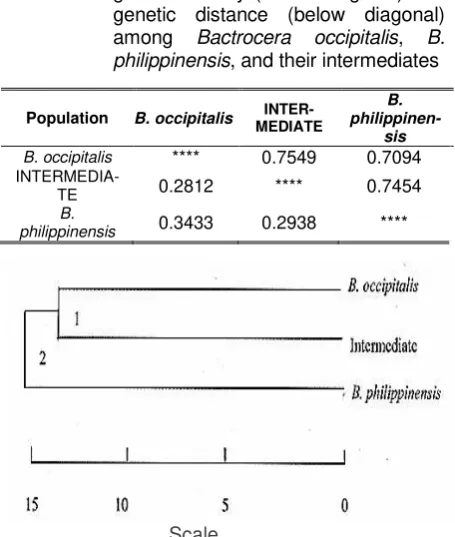
Table 8 shows that genetic identity values were 0.7094 between B. occipitalis and B. philippinensis, 0.7454 between B. philippinensis and intermediates, and 0.7549 between B.occipitalis and intermediates. On the other hand, the genetic distance values were 0.2812 between B. occipitalis and intermediates, 0.2938 between B. philippinensis and intermediates, and
Scale
Geographical distance (km)
G
e
n
e
ti
c
d
is
ta
n
c
0.3433 between B. occipitalis and B. philippinensis. Based on these results, B. occipitalis and intermediates are the most related while B. occipitalis and B. philippinensis are the least related. The genetic distance values, however, are very close, which indicates that these species are not genetically distinct from each other. This is further supported by the dendrogram based on Nei’s (1978) genetic distance using UPGMA method (Fig. 5), which shows that B. occipitalis, B. philippinensis, and intermediates clustered together.
Table 8. Nei (1978) unbiased measures of genetic identity (above diagonal) and genetic distance (below diagonal) among Bactrocera occipitalis, B. philippinensis, and their intermediates
Figure 5. UPGMA dendrogram based on Nei (1978) genetic distance showing the relationships among Bactrocera occipitalis, B. philippinensis, and their intermediates.
Comparison of Microsatellite Variation in B. occipitalis, B. philippinensis, and Intermediate Groups with Isozyme Variation and Morphological Classification
The results of microsatellite analysis did not conform to the results of isozyme analysis by Velasco et al. (2010). Intermediates showed high
intrapopulation genetic variation with microsatellite analysis but low with isozyme analysis. Moreover, microsatellite analysis revealed low genetic diversity among B. occipitalis, B. philippinensis, and intermediates while isozyme analysis showed that there was considerable amount of genetic variation among these groups. However, it should be noted that the two analyses differed in the way the groups were treated and this could have contributed to the observed differences in the results. For microsatellite analysis, each of B. occipitalis, B. philippinensis, and intermediate groups from five localities were pooled together and their genetic diversities were assessed. For isozyme analysis, the groups were not pooled. Instead, each per locality was examined for genetic diversity and genetic relationships.
The dendrogram analysis of microsatellite data showed that B. occipitalis, B. philippinensis, and intermediates are not genetically distinct from each other, as implied by the low genetic distance values. This result did not agree with the morphological classification of Iwahashi (1999a) which classified flies belonging to groups 0, 1, and 2 as B. occipitalis, groups 5 and 6 as B. philippinensis, and groups 3 and 4 as intermediates of these two species. This indicates that microsatellite variation did not reflect the observed morphological differences.
CONCLUSIONS AND SUGGESTIONS
The extent of genetic diversity in natural populations of B. occipitalis and B. philippinensis and their intermediates from four mango-producing provinces in the Philippines: Pangasinan, Cavite, Palawan and Guimaras was determined by microsatellite analysis using nine of the 17 microsatellite loci (Aketawarong et al., 2006).
Intrapopulation genetic diversity was determined using three estimates, namely, allele number, heterozygosity, and Shannon information index. The mean ne was highest in Cavite and lowest in Pangasinan. In terms of heterozygosity, Cavite showed the highest observed heterozygosity (Ho) while Pangasinan
exhibited the lowest. Expected heterozygosity (He) values did not differ much between
populations. For the Shannon information index (I), Cavite exhibited the highest I value while Pangasinan showed the lowest. Based on the Population B. occipitalis MEDIATE
INTER-B.
philippinen-sis
B. occipitalis **** 0.7549 0.7094
INTERMEDIA-TE 0.2812 **** 0.7454
B.
philippinensis 0.3433 0.2938 ****
Grace Sheila Paguibitan Jalani et al.: Genetic Diversity Of Natural Populations of Bactrocera occipitalis (Bezzi)………
three estimates of intrapopulation genetic diversity, the Cavite population is the most genetically diverse while Pangasinan is the least. The high diversity in Cavite is indicative of large population. The low diversity in Pangasinan, on the other hand, reflects reduction in population size. This may be due to the fact that mango fruits were collected in Pangasinan towards the end of the harvest season. Early rainfall caused only a few mango fruits to mature causing the flies to possibly find new host.
The estimate F-statistics, Fst, was used to measure population subdivision. There was low level of genetic diversity among the four populations, which may be due to the extensive transportation of mangoes among the provinces and probably the lack of quarantine restrictions (except Guimaras which has strict quarantine restrictions for mangoes) in interprovincial movement of fruit commodities. Five percent of the total genetic variation was accounted to genetic variations among populations, while 95% was accounted to genetic variation within the population. A high level of gene flow was observed among populations and this may be attributed to Bactrocera species being strong fliers and highly mobile.
Among populations genetic identity was highest between Pangasinan and Palawan and lowest between Palawan and Guimaras. Conversely, genetic distance was the highest between Palawan and Guimaras and lowest between Pangasinan and Palawan. These results indicate that, among the populations studied, Pangasinan and Palawan are the most related while the Palawan and Guimaras are the least related. It is likely that Pangasinan and Palawan have similar environmental conditions. A dendrogram based on genetic distance using UPGMA method shows that the four populations clustered together. This clustering may be the result of intensive trade of mangoes in Luzon and Visayas areas.
The estimates of genetic diversity within B. occipitalis, B. philippinensis, and intermediate groups showed that the intermediates are the most genetically diverse, which may be due to its large effective population size, while B. philippinensis is the least genetically diverse, which may be attributed to its small sample size.
The estimates of F-statistics, FST, indicated
low level of genetic diversity among B. occipitalis, B. philippinensis, and intermediates. Genetic
identity was highest between B. occipitalis and intermediates and lowest between B. occipitalis and B. philippinensis. On the other hand, genetic distance was highest between B. occipitalis and B. philippinensis and lowest between B. occipitalis and intermediates. These results indicate that B. occipitalis and intermediates are the most related while B. occipitalis and B. philippinensis are the least related. The dendrogram showed that B. occipitalis, B. philippinensis and intermediates clustered together, indicating that they are not genetically distinct from each other.
The results of microsatellite analysis did not conform to the results of isozyme analysis by Velasco et al. (2010). The dendrogram analysis of microsatellite data which showed that B. occipitalis, B. philippinensis, and intermediates are not genetically distinct from each other did not agree with the morphological classification of Iwahashi (1999a) which classified flies belonging to groups 0, 1, and 2 as B. occipitalis, groups 5 and 6 as B. philippinensis, and groups 3 and 4 as intermediates of these two species. This indicates that microsatellite variation did not reflect the observed morphological differences.
Isolation and characterization of microsatellite from B. occipitalis and B. philippinensis would be essential in order to have species-specific markers that will differentiate these two species. Moreover, larger population size and greater number of microsatellite markers are recommended for a more effective analysis of genetic diversity.
ACKNOWLEDGEMENT
This study was part of the project granted by the Department of Agriculture- Biotechnology Program to Dr. Luis Rey I. Velasco and Dr. Celia Dr. Medina.
REFERENCES
Aketarawong, N., M. Bonizzoni, A.R. Malacrida, A.R. Malacrida, G. Gasperi and S. Thanaphum. 2006. Seventeen novel microsatellite markers from an enriched library of the pest species Bactrocera dorsalis sensu strict. Molecular Ecology Notes, 6: 1138-1140.
Zacharoopoulou and K.D. Mathiopoulous. 2005. Microsatellite analysis of olive fly populations in Mediterranean indicates a westward expansion of the species. Genetics, 125:231-241.
Baruffi, L., G. Damiani, C.R. Guglielmino, C. Bandi, A.R. Malacrida and G. Gasperi. 1995. Polymorphism within and between populations of Ceratitis capitata: comparison between RAPD and multilocus enzyme electrophoresis data. Heredity, 74: 425-437.
Benbouza, H., J.M. Jacquemin, J.P. Baudoin and G. Mergeai. 2006. Optimization of a reliable, fast, cheap and sensitive silver staining method to detect SSR markers in polyacrylamide gels. Biotechnology, Agronomy, Society and Environment, 10(2): 77-81.
Borja, F.N.N., M.S. Mendioro, C.O.R. Medina and L.R.I. Velasco. 2010. Isozyme polymorphisms in the oriental fruit fly Bactrocera occipitalis Drew and Hancock and B. philippinesis (Bezzi) (Diptera:Tephritidae) from Puerto Princesa, Palawan. Philippine Agricultural Scientist, 93:232-237.
Dai, S.M., C.C. Lin and C. Chang. 2004. Polymorphic microsatellite DNA markers from the oriental fruit fly Bactrocera dorsalis (Hendel). Molecular Ecology Notes, 4: 629-631.
Delomen, M.L.C., M.S. Mendioro and M.G.Q. Diaz. 2013. Morphometric Analysis and DNA barcoding of fruit flies and B. occipitalis (Bezzi) and B. philippinesis Drew and Hancock Tephritidae) from Cavite and Davao del Norte. Philippine Journal of Science, 142(1):69-76. Dolores, L.K.O. 2003. DNA fingerprinting of
mango fruit fly, Bactrocera philippinensis (Drew and Hancock), using random amplified polymorphic DNA. Undegraduate Thesis, University of the Philippines, Los Baños, Laguna. 50pp. Drew, R.A.I. and D.L. Hancock. 1994. The
Bactrocera dorsalis complex of fruit flies (Dipetra: Tephritidae: Dacinae) in Asia. Bulletin of Entomological Research, Supplement Series No.2 in Supplement 2: 1-68. Canberra, Australia: ACIAR Proceedings No. 76.
Drew, R.A.I. 2004. Biogeography and speciation in the Dacini (Diptera: Tephritidae: Dacinae). Bishop Museum Bulletin in Entomology, 12: 165-178.
Ebina, T. and K. Ohto. 2006. Morphological characters and PCR-RFLP markers in the interspecific hybrids between Bactrocera carambolae and B. papaya and B. dorsalis Species Complex (Diptera:Tephritidae). Research Bulletin of the Plant Protection of Japan, 42: 23-34.
Fletcher, B.S. 1987. The biology of Dacine fruit flies. Annual Review of Entomology, 32:115-144.
Haymer, D. S., T. Tanaka and C. Teramae. 1994. DNA probes can be used to discriminate between Tephritid species at all stages of the life cycle (Diptera: Tephritidae). Journal of Economic Entomology, 87(3):741-746.
He, M. and D.S. Haymer.1997. Polymorphic intron sequences detected within and between populations of the Oriental fruit fly (Diptera: Tephritidae). Annals of the Entomological Society of America, 90 (6):825-831.
Iwahashi, O. 1999a. Distinguishing between the two sympatric species, Bactrocera occipitalis and B. philippinensis (Diptera: Tephritidae) based on aedeagal length. Annals of the Entomological Society of America, 92(2):182-187
Iwahashi, O. 1999b. Distinguishing between the two sympatric species Bactrocera carambolae and B. papayae (Diptera: Tephritidae) based on aedeagal length. Annals of the Entomological Society of America, 92(5): 639-643.
Grace Sheila Paguibitan Jalani et al.: Genetic Diversity Of Natural Populations of Bactrocera occipitalis (Bezzi)………
Zoology, 36 (3): 289-297.
Iwaizumi, R., M. Kaneda and O. Iwahashi. 1997. Correlation of length of terminalia of males and females among nine species of Bactrocera (Diptera: Tephritidae) and Differences among sympatric species of B. dorsalis complex. Annals of the Entomological Society of America, 90 (5):664-666.
Kourti, A. 2004. Estimates of gene flow from rare alleles in natural populations of medfly Ceratitis capitata (Diptera: Tephritidae). Bulletin of Entomological Research, 94: 449-456.
Li, W., L. Yang. K. Tang, L. Zeng and G. Liang. 2007. Microsatellite polymorphism of Bactrocera dorsalis (Hendel) populations in China. Acta Entomologica Sinica, 50 (12):1255-1262.
Nei, M. 1978. Estimation of average hetero-zygosity and genetic distance from a small number of individuals. Genetics, 89: 583-590.
Sumalde, A.U.M., M.S. Mendioro, M.L.C. Delomen and C.D.R. Mendoza. 2013. DNA barcoding and Morphometric Analysis of Oriental fruit fly species B. occipitalis (Bezzi) and B. philippinesis Drew and Hancock Tephritidae) from Guimaras, Philippines. Phil Ent , 27(1): 58-74.
Sun, G., O. Diaz, B. Salomon and R. Von Bothmer. 1999. Genetic diversity in Elymus caninus as revealed by isozyme, RAPD, and micro-satellite markers. Genome 42: 420-431.
Velasco, V.M.H, R.P Laude, C. DR. Medina and L.R.I. Velasco. 2010. Morphological and isozyme analysis of natural populations of Bactrocera spp. (Diptera: Tephritidae) from Guimaras Island and Laguna. Philippine Agricultural Scientist, 93(3): 280-287.
Wang, Y., H. Yu, K. Raphael and A.S. Gilchrist. 2003. Genetic delineation of sibling species of the pest fruit fly Bactrocera (Diptera: Tephritidae) using microsatellites. Bulletin of Entomological Research, 93:351-360.
Wright, S. 1978. Variability within and among natural populations. Vol. 4. The University of Chicago Press, Chicago. Yao, Q.P., K. Fang and G. Pan. 2008. Genetic
diversity based on SSR markers in maize (Zea mays L.) landraces from Wuling mountain region in China. Journal of Genetics, 87(3): 287-291.
Yeh, F.C., R. Yang and T. Boyle. 1999. POPGENE version 1.31. Microsoft window-based freeware for population genetics analysis. Available from ftp://ftp.microsoft.com/
Softlib/MSLFILES/HPGL.EXE.