SPATIAL DISTRIBUTION PATTERN OF THE FRUIT FLY,
Bactrocera dorsalis
COMPLEX (DIPTERA: TEPHRITIDAE) IN MANGO ORCHARD
A. Soemargono*), Muryati, Ahsol Hasyim and Mizu Istianto Indonesian Tropical Fruit Research Institute (ITFRI)
Jl. Raya Solok-Aripan Km 8 P.O. Box. 5 Solok-West Sumatera, Indonesia *)
Corresponding author Phone: +62-755-20137 E-mail: [email protected]
Received: November 12, 2010/ Accepted: February 12, 2011
ABSTRACT
The spatial distribution of Bactrocera dorsalis complex in the mango orchard that was analyzed using various mathematical indices dispersion and regression models showed an aggregated distribution. Taylor’s power law and Iwao’s regression model fitted well to all data sets. However, Iwao’s regression model fitted the data better, yielding higher values of R2 than Taylor’s power law. As the regression of the reciprocal of k of negative binomial (1/k)on
x
[k = (x
2– s2/n) / (s2 –
x
)] was not significant, thecalculation of a common k was justified to be 1.30. This implies that the grade of aggregation of the fruit flies population was relatively constant throughout the time despite the variation in sample means. Since the clump size
(λ) value was more than 2, the aggregated distribution might be due to the behavior and environmental factors working together.
Keywords:Bactrocera dorsalis complex, spatial, distribution, trapping, mango
INTRODUCTION
One of the main aims of ecology is to understand the distribution and abundance of organisms (Andrewartha and Birch, 1954). One aspect of distribution and abundance is the dispersion pattern. Knowledge of the dispersion pattern in terms of an insect is very important because its organism is a result of the interaction between individuals of the species and their habitat (Sevacherian and Stern, 1972). Knowledge of this pattern allows a better understanding of the relationship between an insect and its environment and provides basic information for interpreting spatial dynamics,
designing efficient sampling programs for population estimation and pest management (Sevacherian and Stern, 1972; Taylor, 1984; Binns, 1986; Kuno, 1991), and the development of population models (Croft and Hoyt, 1983).
Most insect populations are spatially aggregated (Southwood, 1978; Taylor et al., 1978, 1980; Turchin and Kareiva, 1989; Faeth, 1990; Morris et al., 1992), but the degree of aggregation often varies among populations and among species (Root and Cappuccino, 1992). There is a variety of approaches to characterize the spatial distribution of insects (Kuno, 1991; Binns and Nyrop, 1992), which is generally based on the sample mean (
x
) and variance(s2) (Feng and Nowierski, 1992).
To date, no information is known about the dispersion of the fruit fly, B. dorsalis complex, a key pest of mango and many other fruits in Indonesia. As such, the objective of this study was to ascertain the spatial distribution pattern of B. dorsalis complex in the mango ecosystem through captures of adult flies using pheromone traps. Several indices of dispersion and linear regression models were used to analyze spatial pattern as recommended by Mollet et al. (1984), which more than one index should be used before drawing conclusions about dispersion.
MATERIALS AND METHODS
For the purposes of studying the distribution of the fruit fly, twenty pheromone-traps were randomly set up in the orchard of commercial mango in Situbondo - East Java, Indonesia. The mango variety grown was Arumanis-143 16 years of age.
To obtain a continuous release of the pheromone (methyl-eugenol) into the
ment, the traps were set under shade of plant canopy and not exposed to direct sunlight. All traps were hung at a height of 1.5 m above the ground on trunks of trees within the orchard. These traps were serviced twice a month and during servicing, a count of the flies captured in the trap was recorded. Then, the cotton dropped with pheromone was replaced with a new one. A record of the number of flies captured in the 20 pheromone-traps was maintained for the period of April 2006 through December 2006. This number of caught flies in the trap was used to calculate dispersion indices. In the current study, the analysis of spatial distribution was performed on the basis of the monthly captures.
Initially, the data were analyzed to find out the distribution trend based on the variance-means ratio (s2/
x
), which is the simplest index of dispersion and the most fundamental (Myers, 1978; Taylor, 1984). This ratio indicates a suspected, and if d > 1.96, a clumped dispersion is likely (Elliott, 1977). Lloyd’s index patchiness, an index that does not depend on either sample size or mean density (Hurlburt, 1990), was aggregated or regular dispersion, respectively. Furthermore, on the basis of variance and mean values, the other dispersion indices were determined and the statistical tests were applied to confirm the distribution pattern of the insects.The degree of aggregation was also measured by commonly used dispersion indices, including the Green coefficient GI (Green, 1966), Taylor’s power law (Taylor et al., 1978), Iwao’s patchiness regression (Iwao, 1968), and parameter k for the Negative Binomial. Such indices were chosen in an attempt to get a consensus on dispersion because the use of a single index can be misleading (Myers, 1978). Mollet et al. (1984) and Davis (1994) recommended that in evaluating dispersion of an arthropod, one should use several different techniques before drawing conclusions about dispersion. variance (s2) of a population is proportional to a fractional power of the arithmetic mean: s2 =
Iwao’s patchiness regression is the regression of mean crowding index (x*) on mean density (
x
) in the linear model: used to determine significance of departure from randomness for both regression methods.The dispersion parameter k for the Negative Binomial was estimated as (
x
2– s2/n) / (s2 –
x
) for < 50 samples (Elliott, 1977) andof k were also used to test whether a common k (kc) for a negative binomial exists or not by linearly regressing their reciprocal on
x
. The calculation of a common k (kc) is justified and estimated only when there is no relationship betweenx
and 1/k by regressing y’= (s2–
x
) on x’= (x
2– s2/N), and kc was defined by 1/slope (Bliss and Owen, 1958 in Elliott, 1977).
RESULTS AND DISCUSSION
As the fruit flies trapped were adults, the spatial distribution pattern observed herein was that of the fruit fly adults in the mango orchard.
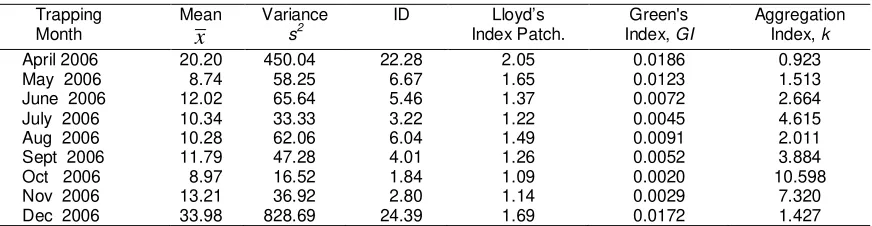
The spatial distribution pattern of the fruit fly in the mango orchard was found to be highly aggregated in accordance with various indices of dispersion (Table 1). In all cases, the variance-to-mean ratio (s2/
x
) was of significant departure from 1 (ranging from 1.84 to 24.39), and Lloyd’s index of patchiness was greater than unity, and the Green coefficient Cx values were more than zero, indicating that the spatial distribution of fruit flies was aggregative in nature. K values of the negative binomial, index of clumping (aggregation) in the population for all occasions, were less than 8 except in the October sample. The reciprocal of k values was fractional and >0 in most cases, indicating that the population of fruit flies in the mango orchard followed negative binomial distribution or aggregative type of distribution. These findings concur with the statement of Poole (1974) and Southwood (1978) that the value of k, up to 8, indicated aggregative nature of distribution, and the smaller the value of k the greater the aggregation. Hence, this further confirmed the aggregated pattern of the fruit flies distribution.Both Taylor’s power law and Iwao’s patchiness regression appeared to describe the distribution of B. dorsalis complex well. The slope value of Taylor’s power law for the fruit fly on mango (b = 2.63) was significantly greater than 1 (t = 3.62; df = 7; P<0.01), indicating clumped or aggregated distributions in mango orchard. Similarly, the slope (β) of Iwao’s model on mango (1.94) was also significantly greater than 1 (t = 5.21; df = 7; P<0.01), suggesting that the distribution pattern of the fruit flies is to be aggregated in mango orchard. Hence, these regression models supported the conclusion that the population of B. dorsalis complex was aggregated.
From Figures 1 and 2, it appears that the Iwao’s model fitted the data better than Taylor’s power law. This is based on the higher value of R2 for Iwao’s model. In addition, Iwao’s model provided a slightly more even distribution of points along the line when compared with the plot of Taylor’s power law regression (Figure 1). Iwao’s patchiness regression, nonetheless, also allows the ecological implications of the parameter to be interpreted since this equation was originally derived with close reference to theoretical distribution models (Kuno, 1991). The index of basic contagion () of Iwao’s patchiness regression was not significantly different from zero (t = -2.04; df = 7; P=0.08). This implies that for the adults the basic component of the population is a single individual. The negative value of implies a negative interaction /association between individuals of the male fruit fly in the mango orchard, thus indicating that the behavior of male fruit flies in the mango orchard was independent and solitary.
Table 1. Parameters for spatial distribution of B. dorsalis complex in the mangoorchard Trapping
Month
Mean
x
Variance
s2
ID Lloyd’s Index Patch.
Green's Index, GI
Aggregation Index, k
April 2006 20.20 450.04 22.28 2.05 0.0186 0.923
May 2006 8.74 58.25 6.67 1.65 0.0123 1.513
June 2006 12.02 65.64 5.46 1.37 0.0072 2.664 July 2006 10.34 33.33 3.22 1.22 0.0045 4.615
Aug 2006 10.28 62.06 6.04 1.49 0.0091 2.011
Sept 2006 11.79 47.28 4.01 1.26 0.0052 3.884 Oct 2006 8.97 16.52 1.84 1.09 0.0020 10.598
Nov 2006 13.21 36.92 2.80 1.14 0.0029 7.320
log (s2) = -1.05 + 2.63 log (x) (R2 = 0.83)
log (x)
0.9 1.0 1.1 1.2 1.3 1.4 1.5 1.6
log
(s
2
)
1.0 1.2 1.4 1.6 1.8 2.0 2.2 2.4 2.6 2.8 3.0 3.2
Figure 1. Regression analysis of Taylor’s power law, log (s2) = log (a) + b log (
x
) for B. dorsaliscomplexpopulation in mango orchard
x* = -6.02 + 1.94 x (R2 = 0.94)
M ean n o. of fruit flies/trap (x)
5 10 15 20 25 30 35 40
M
ea
n
c
ro
w
d
in
g
i
n
d
ex
(
x
*
)
0 10 20 30 40 50 60 70
Figure 2. Regression analysis of Iwao’s patchiness, mean crowding index (x*) on mean number of flies per trap (
x
) for B. dorsalis complexpopulation in mango orchard.The regression of the reciprocal of k on mean density (
x
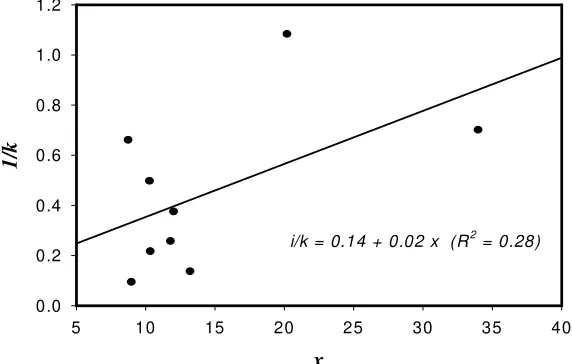
) was not significant; 1/k = 0.14 − 0.02x
(R2= 0.28; P>0.05) (Figure 3); therefore, a common k of negative binomial for
slope b is equal to 1/kc, the value of kc is 1.30. This kc is the common value of k for the entire area (Poole, 1974). Figure 4 shows that most of the points lie close to the regression line, so the latter appeared to be a good fit to the data. According to Elliott (1977), the stability of k implies that the degree of contagiousness in the population was relatively constant over several months despite the variation in sample means. Therefore, in this current study, k was an adequate model for the aggregation of the fruit fly. Similar test to confirm the stability of k had been carried out by Faleiro et al. (2002) for the red palm weevil (scientific name) distribution in coconut plantation and Gonzalez-Andujar et al. (2006) for the green leaf hopper (scientific name)distributionin vineyard.
Identifying the cause of aggregation can be determined by using the Arbous and Kerrich formula (Southwood, 1978):
k
x
2
,where λ is the mean clumping size and γ is the
responding value of x2 to 0.5 probability level with 2 k degree of freedom for χ2 distribution. With the overall mean of 14.39 per trap during the study and a common kof 1.30, λ was equal to 8.94. Since the value of λ was greater than 2,
the causes of aggregation as declared by Poole (1974), Southwood (1978), and Wratten and Fry (1980) were due to active aggregation of the fruit fly such as behavior whereby the presence of each individual male attracting to female, and reproductive biology were influenced by the heterogeneity of the environment such as microclimate especially relative humidity and preferred part of plant. Preferential oviposition of eggs on west–facing fruits resulting in significantly clustering larvae among fruits (Stonehouse et al., 2002b) confirmed the presence of preferred part of plant. Pertaining to the behavior, it could be explained by the fact that the fruit flies caught in traps baited with methyl-eugenol, a highly potent attractant for the male fruit flies of several species, are mostly males (Chuah et al., 1997; Stonehouse et al., 2002a and b).
Hence, the main reason they tend to aggregate in the same situation or habitat is the sexual attraction. Such findings can potentially provide valuable information on further eco-logical studies in term of the number of traps that should be set in different favored spots in the fields for controlling fruit flies using mass trapping with pheromones.
i/k = 0.14 + 0.02 x (R2 = 0.28)
x
5 10 15 20 25 30 35 40
1
/k
0.0 0.2 0.4 0.6 0.8 1.0 1.2
Figure 3. Regression analysis of 1/k on
x
for detection of a common k of B. dorsalis complexy' = -37.35 + 0.77 x' (R2 = 0.94)
x'
0 200 400 600 800 1000 1200
y
'
0 200 400 600 800 1000
Figure 4. Regression line of y’ on x’ showing the degree of contagiousness in the population of B. dorsalis complexin mango orchard.
CONCLUSIONS AND SUGGESTIONS
Based on the analysis of various mathematical indices of dispersion and regression models, the spatial distribution of the fruit fly, B. dorsalis complex in mango orchard was determined as an aggregated distribution. With mean clumping size (λ) equal to 8.94, it could be inferred that this aggregated distribution is due to the behavior of fruit fly and some heterogeneity of the environment. To complement the information on behavior aspect of this insect, the similar study is required especially at the larval stage due to their direct attack on mango fruits.
ACKNOWLEDGMENTS
This research was supported with funding by the DIPA of the Indonesian Tropical Fruit Research Institute fiscal year 2006. The authors are grateful to the Director of Trigatra Ltd, Situbondo for providing the research facilities. Thanks are also extended to peer reviewer for their valuable criticism and peer review of this manuscript.
REFERENCES
Andrewartha, H.G. and L.C. Birch. 1954. Distribution and abundance of animals. University of Chicago Press.
Binns, M.R. 1986. Behavioural dynamics and the negative binomial distribution. Oikos 47: 315-318.
Binns, M.R. and J.P. Nyrop. 1992. Sampling insect populations for purpose of IPM decision making. Annu. Rev. Entomol. 37: 427-533.
Chuah, C.H., H.S. Yong, and S.H. Goh. 1997. Methyl eugenol, a fruit-fly attractant, from the browning leaves of Proiphys
amboinensis (Amaryllidaceae).
Bio-Chemical Systematics and Ecol. 25 (5): 391-393.
Croft, B.A. and S.C. Hoyt. 1983. Integrated management of insect pests of pome and stone fruits. Wiley, New York. Davis, P.M. 1994. Statistical for describing
Elliott, J.M. 1977. Some Methods for the Statistical Analysis of Samples of Benthic Inverte-brates. Scientific Publication No. 25, Freshwater Biological Association, Ambleside, Westmorland, Great Britain. Faeth, S.H. 1990. Aggregation of a leafminer,
Cameraria sp. Nov. (Davis): consequen-ces and causes. J. Anim. Ecol. 59: 569-586.
Faleiro, J.R., J.A. Kumar and P.A. Rangnekar. 2002. Spatial distribution of red palm weevil Rhynchophorus ferrugineus Olic. (Coleoptera: Curculionidae) in coconut plantations. Crop Prot. 21: 171–176. Feng M.G. and R.M. Nowierski. 1992. Variation
in spatial patterns of the Russian wheat aphid (Homoptera: Aphididae) among small grains in the Northwestern United States. Environ. Entomol. 21: 1029-1034.
Gonzalez-Andujar, J.L.,J.F.Ramirez-Davila, M.A. Lopez, and R. Ocete. 2006. Spatial Distribution of Jacobiasca lybica
(Bergenin and Zanon) (Homoptera: Cicadellidae) Egg Populations in an Irrigated Sherry Vineyard. J. Agric. Urban Entomol. 23(1): 51–55.
Green, R.H. 1966. Measurement of non-randomness in spatial distribution. Res. Popul. Ecol. 8: 1-7.
Hurlburt, S.H. 1990. Spatial distribution of the montane unicorn. Oikos 58: 257-27. Iwao, S. 1968. A new regression model for
analyzing the aggregation pattern of animal populations. Res. Popul. Ecol. 10: 1-10
Kuno, E. 1991. Sampling and analysis of insect populations. Annu. Rev. Entomol. 35: 285-304.
Mollet, J., J.T. Trumble and V. Sevacherian. 1984. Comparison of dispersion indices for Tetranychus cinnabarinus (Bois-duval) (Acari: Tetranychidae) population in cotton. Environ. Entomol. 13: 1511-1514.
Morris, W.F., S.D. Wiser and B. Klepetka. 1992. Causes and consequences of spatial aggregation in the phytophagous beetle Altica tombacina. J. Anim. Ecol. 62: 49-58.
Myers, J.H. 1978. Selecting a measure of dispersion. Environ. Entomol. 7: 619-621.
Poole, R.W. 1974. An Introduction to Quantitative Ecology. McGraw-Hill Kogakusha, Ltd. Tokyo.
Root, R.B. and N. Cappuccino. 1992. Patterns in population change and the organization of the insect community associated with goldenrod. Ecol. Mon. 62: 393-420. Sevacherian, V. and V.M. Stern. 1972. Spatial
distribution patterns of Lygus bugs in California cotton fields. Environ. Entomol 21: 996-1001.
Southwood, T.R.E. 1978. Ecological methods wit particular reference to the study of insect populations. 2nd Ed. Chapman and Hall, London.
Stonehouse, J., M. Afzal, Q. Zia, J. Mumford, A. Poswal and P. Mahmood. 2002a. “Single-killing-point” field assessment of bait and lure control of fruit flies (Diptera: Tephritidae) in Pakistan. Crop Prot. 21: 651-659.
Stonehouse, J., R. Mahmood, A. Poswal, J. Mumford, K.N. Baloch, Z.M. Chaudhary, A.H. Makhdum, G. Mustafa, and D. Huggett. 2002b. Farm field assessments of fruit flies (Diptera: Tephritidae) in Pakistan: distribution, damage and control. Crop Protection 21: 661-669. Taylor, L.R. 1984. Assessing and interpreting
the spatial distribution of insect population. Annu. Rev. Entomol. 29: 321-358.
Taylor, L.R., I.P. Woiwod, and J.N. Perry. 1978. The density-dependence of spatial behavior and the variety of randomness. J. Anim. Ecol. 47: 383-406.
Taylor, L.R., I.P. Woiwod, and J.N. Perry.. 1980. Variance and the large scale spatial stability of aphids, moths and birds. J. Anim. Ecol. 49: 831-854.
Turchin, P. and P. Kareiva. 1989. Aggregation in Aphis varians: an effective strategy for reducing predation risk. Ecology 70: 1008-1016.