I
Journal of Biological and Chemical
Research
An International Journal of Life Sciences and Chemistry
EISSN 2319-3077 ISSN 0970-4973
www.sasjournals.com www.jbcr.co.in [email protected]
Journal Impact Factor: 4.275, Global Impact Factor: 0.876, InfoBase Impact Factor: 3.66
Scientific Journal Impact Factor: 3.285, IC Value: 47.86
Scope
Life Sciences (Botany and Zoology), Medical Sciences, Chemical Sciences, Agricultural Sciences, Biochemical Sciences, Environmental Sciences, Biotechnology, Molecular Biology and Tissue Culture
Volume 33 (2) Part A, July - December, 2016
Prof. Abbas Ali Mahdi
Editor GeneralProf. Y.K. Sharma
Executive Chief EditorDr. M.M. Abid Ali Khan
Chief EditorDy. Chief Editors
Dr. John K. Grandy
(USA)
Dr. Dilfuza Egamberdieva
(Uzbekistan)
Dr. T.S. Naqvi
(India)Dr. Raaz Maheshwari
(India)Prof. Uma Singh
(India) Indexed, Abstracted and CitedIndex Copernicus International (Europe), Research Bible (Japan), Scientific Journals Impact Factor Master List, Directory of Research Journals Indexing (DRJI), Indian Science. In, Database Electronic Journals Library (Germany), Open J-Gate, J Gate e-Journal Portal, Info Base Index, International Impact Factor Services (IIFS) (Singapore), Scientific Indexing Services (USA), International Institute of Organized Research (I2OR), World Cat, International Innovative Journal Impact Factor, Swedish Scientific Publishing, Eye Source and citefactor.org Journals Indexing Directory, Cosmos Science Foundation South-East Asia, Indexing of International Research Journals and ImpactFactor.pl - Kompendium wiedzy o czasopismach naukowych, Philadelphia.
II
Journal of Biological and Chemical
Research
Published by Society for Advancement of Sciences®
ISSN 2319-3077 (Online/Electronic) ISSN 0970-4973 (Print)
Journal Impact Factor: 4.275 Global Impact Factor: 0.876
Scientific Journal Impact Factor: 3.285
InfoBase Impact Factor: 3.66 Index Copernicus Value: 47.86
Volume 33 (2), Part A, July- December, 2016
S. No. 1
E a i atio of La ti A id Ba teria’s A ilit fro
Fish Intestinal Tract in Deconjugation Bile Salt
By
Astuti, Zaenal Bachrudin, Supadmo and
Eni Harmayani
(Indonesia) 598-606
S. No. 2
Efficacy of bio-pesticide obtained from the blend of
seeds' extract of
Azadirachta indica and
leaves'
extract of C
alotropis procera
on the 2
ndlarval instars of
Plutella xylostella (Lepidoptera: Plutellidae)
By
Sabiha Khan
and Puja Dewanda
(India)
607-615
S. No. 3
Morphological and Morphometrical Study of Sacral
Hiatus in North Indian Population
By
Pooja Singh, Ritu Singh, Archana Rani,
R.K. Diwan, R.K. Verma, Deepshikha Kori and
Stuti Tandon
(India)
616-628
S. No. 4
An Osteological Study of Diaphyseal Nutrient
Foramen in Human Tibia
By
Ritu Singh, Rakesh Kumar Diwan, Pooja Singh,
Archana Rani, Rakesh Kumar Verma,
III
S. No. 5
Isolation and Purification of Camel Milk
Oligosaccharides as Therapeutic Agent
By
Arjita Mani and Desh Deepak
639-647
S. No. 6
Isolation of Novel Oligosaccharide from
Shyama Dhenu (Black Cow) Milk
By
Gunjan, Deepali Narain, Anakshi Khare and
Desh Deepak
648-654
S. No. 7
Comparative Efficacy of
Azadirachta indica
and
Calotropis Procera
Extract alone and in
Combination as antifeedant against
Plutella xylostella
(L) (Lepidoptera, Plutellidae)
By
Sabiha Khan and Puja Dewanda
655-661
S. No. 8
Digestibility and Rumen Fermentation Product of
Crossbred Etawah Goat given
Calliandracalothyrsus
and
Gliricidiasepium
in Ration
By
A. A. A. S. Trisnadewi, N. N. Suryani, I W. Suarna, and
I G. L. O. Cakra
662-668
S. No. 9-
Effect of Zn on Antioxidant Enzyme Activities of
Common Bean under Drought Stress
By
Abd El-Monem M. Sharaf, Ahmed R. Sofy,
Mahmoud R. Sofy and Ahmed S. Mabrouk
669-676
S. No. 10-
Extraction and Bioactivity Study of Seeds and Roots
Extract of
Datura stramonium
By
Melkamu Feyera and Temam Kedir
677-685
S. No. 11-
Serological Evidence of Hbv and Hdv Co-Infection among
Pregnant Women in Maiduguri, Borno State Nigeria
By
Hassan Dawud Jidda, Samuel O. Oyebode,
IV
S. No. 12-
Effects of Gamma Rays on the Root Tip Mitosis of
Jatropha curcas
L.
By
Rakesh Kumar Pandey
692-696
S. No. 13-
A Study of Soil Structural Variations in
Relation to Microsporogenesis in Barley
By
Vivek Singh
697-703
S. No. 14-
Description of a New Species of the Genus
Thaparocleidus
Jain, 1952 (Monogenea, Dactylogyridae) from Freshwater
Fish
Sperata
, in Lucknow, India
By
Pushpa Vishwakarma
704-707
S. No. 15-
Compound Analysis of
Tithonia diversifolia
Leaves
By
Amanatie
708-719
S. No. 16-
Tools to Improve Medical Education and Research at
Undergraduate Level
By
M.M. Khan, Farah Khan, Indu Pisharody,
Compound Analysis of
Tithonia diversifolia
Leaves
By
Amanatie
ISSN 2319-3077 Online/Electronic ISSN 0970-4973 Print
Journal Impact Factor: 4.275
Global Impact factor of Journal: 0.876 Scientific Journals Impact Factor: 3.285 InfoBase Impact Factor: 3.66
Index Copernicus International Value IC Value of Journal 47.86 Poland, Europe
J. Biol. Chem. Research
Volume 33 (2) 2016 Pages No. 708-719
Journal of
Biological and
Chemical Research
An International Peer Reviewed / Referred Journal of Life Sciences and Chemistry
Indexed, Abstracted and Cited in various International and
National Scientific Databases
Compound Analysis………..…………Tithonia diversifolia Leaves Amanatie, 2016
J. Biol. Chem. Research. Vol. 33, No. 2: 708-719, 2016
(An International Peer Reviewed / Refereed Journal of Life Sciences and Chemistry)
Chemistry Department, Faculty of Mathematics and Natural Sciences, Yogyakarta State University, Yogyakarta, Indonesia.
ABSTRACT
This study aimed of compounds analysis of Tithonia diversifolia leaves using UV-Vis spectroscopy, IR and GC-MS analyses.
Extract of Tithonia diversifolia lleaves were macerated with methanol. Methanol extract obtained from the maceration was then evaporated and partitioned with ethylacetat. Ethyl acetat fraction was further evaporated and separated using GCC guided by TLC. The compounds obtained from GCC were identified by using TLC with 3 different types of eluent mixture.
They showed that compound analysis using UV-Vis spectroscopy gave the maximum wavelength (�����) at 220.80 nm and 400.20 nm. IR spectrum showed functional groups C=O carbonyl, –OH carboxylate, C-O ester, and C-H aliphatic. The result of GC-MS analysis showed that secondary metabolite compound which was isolated has a similarity index (SI) to 7β-(acetyloxy)- α -methyl-5α-estran-3-one of 75 with a purity of 69.53%.
Keywords: Compound, Analysis, UV-Vis Spectroscopy, IR and GC-MS Analyses and Tithonia diversifolia leaves.
INTRODUCTION
As a tropical country, Indonesia has a large amount of plant species thriving in its region. Not only plants used for food and for industrial export, but also plants that can be used in the field of medicine for natural treatment. Thus, today many alternative treatments using various types of herbs are found in Indonesia.
Compound Analysis………..…………Tithonia diversifolia Leaves Amanatie, 2016
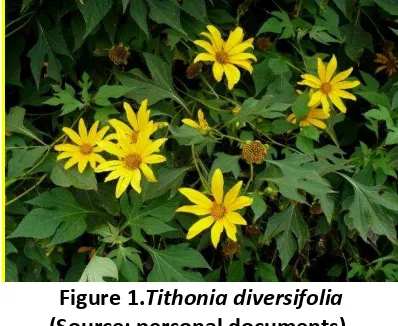
ingredients can still compete at present time despite the rapid advances in science and technology. Furthermore, with the great advancement of technology many scientists start optimizing the utilization of various medicinal plants for more efficient treatments. One of the natural plants which is often prescribed in traditional medicine is Tithonia diversifolia. This plant usually grows wild in steep places, such as on cliffs, river banks, and ditches. In addition, this annual plant can grow well in places with high light-intensity at the height of 5-1500meters above sea level. Tithonia diversifolia has a straight-erected stems, three-branched leaves with green main veins and others branching off, yellow flowers, and the roots are in the form of a taproot (Hutapea, et.al., 1994).
Based on various studies it is known that the leaves Tithonia diversifolia can be used to treat stomach-ache, bloating, bloody injury, and as anti-inflammatory and antidiabetic. Further research reveals that the leaves of this plant contain alkaloids, terpenoids, flavonoids, saponisn, tannins, and polyphenols. These compounds are included in the class of secondary metabolites, thus allowing these plants to be used for medical treatment.
This study was carried out to isolate and identify secondary metabolites from ethyl acetate fraction of Tithonia diversifolia leaves. The extraction method used in this study was maceration. This method was chosen because it has several advantages, i.e. the required tools are relatively simple; it can be used for extraction in large quantities, the cost is relatively low, and it can be performed at room temperature without heating. This process technically used methanol solvent and the result was then partitioned using n-hexane. Methanol was used as a solvent because it can dissolve almost all kinds of secondary metabolites. The process of compound separation was conducted using Gravity Column Chromatography (GCC) method. To determine the purity of the compound and the GCC eluent a Thin Layer Chromatography (TLC) test was conducted. To determine the characteristics of the structure, a further analysis of pure compounds resulted from the isolation was conducted using UV-Vis spectrophotometer, infrared (IR) spectroscopy and GC-MS spectroscopy. The result of this study is expected to optimize the use of the Tithonia diversifolia as traditional and modern medicine.
The study aims to:
1. Compound analysis of Tithonia diversifolia leaves using Thin-layer Chromatography (TLC) and Gravity Column Chromatography (GCC), UV-Vis (Ultraviolet-Visible) spectrophotometer, IR (infrared) spectroscopy, and GC-MS Spectroscopy; and
2. Reveal the type of compound in the ethyl-acetate fraction of Tithonia diversifolia leaves by maceration method and separation by chromatography.
The benefits that can be drawn are, among others:
1. to provide information on how to compound analysis of Tithonia diversifolia leaves;
2. to contribute in developing science in chemistry, especially organic chemistry and pharmaceuticals.
REVIEW
Tithonia diversifolia flower can be classified as follows (Hutapea, 1997:297):
Division: Spermatophyta Sub Division: Angiospermae Class : Dicotyledoneae Ordo: Asterales Family : Asteraceae Genus : Tithonia Species: Tithonia diversifolia
Tithonia diversifolia is an upright shrub that can reach a height of 3 meters, have sprouts, and crept on the ground. Generally, this plant grows wild on steep places, for example on the cliffs, river banks, and ditches.
Compound Analysis………..…………Tithonia diversifolia Leaves Amanatie, 2016
This plant grows easily in places with a height of 5-1500 meters above sea level, and is also an annual plant that likes bright places and grows well in a place exposed to direct sunlight (Sulistijawati and Didik, 2001).
According Taofik, et.al. (2010), the extract of Tithonia diversifolia leaves contains an active ingredient that can kill the eriophyidae (mites that usually infest fowl). Based on his study, it is known that the extract of Tithonia diversifolia leaves has a toxicity level for eriophyidae mites at 2.2922 ppm during a 72-hour treatment. Using the phytochemical and High Performance Liquid Chromatography (HPLC) analysis, the study has shown that the extract contains flavonoids, alkaloids, and tannins. From this result it is known that Tithonia diversifolia plants have a potential to be utilized as botanical insecticide which is very economical.
Tithonia diversifolia is generally utilized traditionally for its leaves. The leaves contain active substances that can be used in medical treatment. Apart from being a botanical insecticide, a lot of research has also proven that the content of the active compounds in the leaves Tithonia diversifolia can be used as medicine to treat antidiabetic, virus, anti-malaria, liver, and strep throat. The plant of Tithonia diversifolia is shown in Figure 1.
Figure 1.Tithonia diversifolia
(Source: personal documents).
RESULTS AND DISCUSSION
1. Separating Tithonia diversifolia Leaves by Maceration and Partition
The result of the separation and partition leaf maceration Tithonia diversifolia are shown in Table 1.
Table 1. Results of Separation by Maceration and Partitions.
Material Separation method
Solvent Extract Volume concentrated 0.5 kg dried powder of
Tithonia diversifolia leaf
Maceration Methanol 115 mL Partition ethyl acetate 50.6 mL
2. Separation of Ethyl acetate with Chromatography
Separation technique performed by using Vacuum Liquid Chromatography is the first process to obtain secondary metabolites.
Compound Analysis………..…………Tithonia diversifolia Leaves Amanatie, 2016
In this technique a column of 9.5cm diameter and 5 cm was used with tools such as a vacuum pump. Previously, the concentrated ethyl acetate extracts using silica gel. Merck 60 (mesh). Eluent used in this process was 100% n-hexane, n-hexane: ethyl acetate in the ratio of n-hexane : ethyl acetate =6 : 4 Rf 0.4 ; acetone : ethyl acetate= 4 : 1 Rf0.875; and dichloromethane : acetone= 9 : 1 Rf 0.425.
The subsequent separation process was conducted the gravity column chromatography. Fraction I results which have been concentrated and then impregnated with silica gel Merck 60 (200-400 mesh). The column used for chromatography is 30 cm in length with a diameter of 2.5 cm. Eluent used in this process a mixture of n-hexane: ethyl acetate in a ratio of 6:4.
The generated eluent was then collected in a 20 mL bottle fraction. This process resulted in60 bottles of fractions, and each fraction was then identified using Thin Layer Chromatography (TLC) with an interval of 3 bottles. Fractions were grouped by determining the similar value of Rf; thus 6 groups of fractions, i.e. F1 (3-7), F2 (8-12), F3 (13-17), F4 (18-20), F5 (21-40), and F6 (41-60) were obtained. Of the six groups of the fraction, fraction F6 (41-60) was concentrated.
Fraction F6 (bottles 41-60) was concentrated further separation by TLC because the results have not shown single spot. The fraction of silica gel was impregnated using Merck 60 (mesh). The separation was carried out using n-hexane eluent: ethyl acetate in the ratio of 6: 4. The generated eluent was accommodated within ± 5 mL bottle fractions and fractions obtained 32 bottles. Each fraction was further identified using Thin Layer Chromatography (TLC) with the interval of one bottle.
Based on the similarity value of Rf, all fractions were grouped into two groups, namely F(6A) fraction (no. 1-12) and F(6B) (no. 13-32). At TLC chromatogram, F6-A (1-12) showed a single spot so that the group of this fraction was further concentrated for the purity test.
The process of gravity column chromatography was carried out to obtain the components of secondary metabolite compounds in chloroform fraction of Tithonia diversifolia leaf which is simpler. The column used here was with a diameter of 2 cm. A total of 1.00 g concentrated extract chloroform of Tithonia diversifolia leaf that had been diluted with a little mixture of eluent n-hexane: ethyl acetate (6:4) and the stationary phase in the form of a mixture of silica gel Merck 60 (200-400 Mesh), resulting in 60 bottles of fractions.
The separation pattern of the whole fraction bottles was observed using TLC under UV light using the same eluent mixture. Bottles with the same separation pattern and Rf value can be combined and grouped, thus resulting in three groups of fractions.
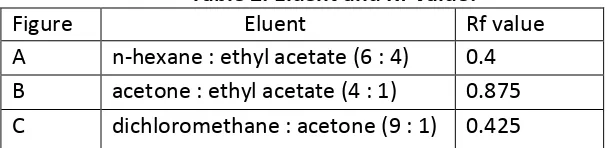
Based on the TLC chromatogram purity test, the results showed a single stain on every kind of eluent (Table 2).
From the results it can be concluded that compound 2 separation results in a relatively high purity that can be further analyzed by UV-Vis, IR spectrophotometer, and GC-MS spectrometers.
Compound Analysis………..…………Tithonia diversifolia Leaves Amanatie, 2016
3. Data Analysis
UV-Vis Spectrophotometer
UV-Vis spectrophotometer used to determine the maximum wavelength of compounds under analysis. The results of measurements of these compounds in methanol showed the maximum absorption of wavelength at 220.80 nm and 400.20 nm.
Figure 2. UV-Vis spectra of isolated compounds. IR Spectrometer
Infrared spectroscopy (IR) used to determine the presence of functional groups contained in the isolated compounds. The analysis of IR spectra of isolated compounds are shown in Table 3.
Table 3. Results of the analysis of the IR spectra.
Wavelength(cm-1) Estimated Group 3464.15 O-H Carboxyl 2970.38 ; 2931.80 and 2877.79 C-H aliphatic 1743.65 C=O Carbonyl 1458.18 and 1381.03 C-H aliphatic 1265.30 C-O ester
GC-MS Spectroscopy
The GC-MS spectroscopy method was used to determine the molecular weight and structure of the isolated compounds. The result of analysis with GC-MS spectroscopy is shown in Figure 3, while the GC-MS chromatogram data of isolated compounds are presented in Table 4.
Figure 3. GC-MS Spectroscopy of isolated compounds.
Compound Analysis………..…………Tithonia diversifolia Leaves Amanatie, 2016
Table 4. GC-MS Chromatogram Data of isolated compounds.
Peak no
Rt
(second) % Area Estimated compound SI 1 35.520 30.47 bis (2-ethyl-hexyl) phthalate 95
2 36.347 69.53 estran-3-one, 17-(acetyloxy)-2-methyl- α., α., β 75
Based on the above chromatogram, the mass spectra of peak 1 has a base peak of 149 with a molecular weight of 390 and indicates the similarity index (SI) with the fragmentation patterns of bis (2-ethyl-hexyl) phthalate compound of 95. The mass spectrum of the isolated compound is shown in Figure 4.
Figure 4. Mass Spectrum of Peak 1 of the isolated compound.
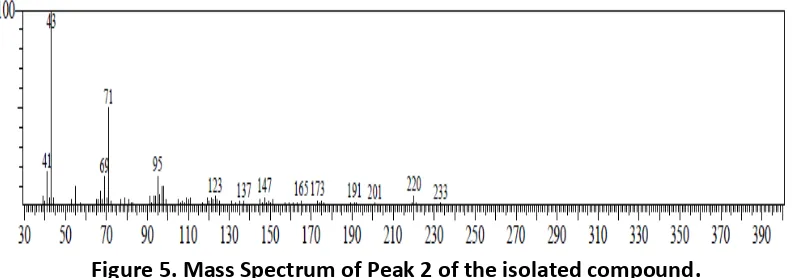
The mass spectrum of Peak 2 has a base peak of 43 with a molecular weight of 332 and indicates the similarity index (SI) with the fragmentation patterns of estran-3-one, 17-(acetyloxy)-2-methyl- α., α., β o pou d of . The ass spectrum of the isolated compound is shown in Figure 5.
Figure 5. Mass Spectrum of Peak 2 of the isolated compound.
The aim of this analysis with GC-MS spectroscopy is to determine the purity of isolated compound and determine the molecular weight fragment of its functional group. GC-MS spectroscopic data generated from the isolated compound two peaks. The highest peak is the Peak 1 with an abundance of 30.47% and a retention time of 35.520 minutes and has the m/e of 390. Peak 2 has an abundance of 69.53% with a retention time of 36.347 minutes and has the m/e of 332. Peak 2 is then the dominant compound because peak 2 has a greater abundance percent age than Peak 1.
Compound Analysis………..…………Tithonia diversifolia Leaves Amanatie, 2016
Fragmentation Patterns of Peak 2
Regarding the mass spectra (M+) 390 in Peak 1 and (M+) 332 in Peak 2, there is no peak in mass spectra; this is because the particles had shorter life time and had no time to reach the ion collector so that molecule could not be detected and only the products of fragmentation showed the peak in mass spectra (Fessenden and Fessenden, 1986).
Compound Analysis………..…………Tithonia diversifolia Leaves Amanatie, 2016
Peak , ith a a u da e of . % a d /e of , has si ilarities ith β -(acetyloxy)- α-methyl- α-estran-3-one. This is supported by the fact that SI of 75 as well as the fragmentation pattern and m/e mass spectra which appeared were similar to the
frag e tatio patter a d /e ass spe tra of β-(acetyloxy)- α-methyl- α-estran-3-one. However, in this case, the similarity index was not very big.
Peak 1, with an abundance of 30.47% and m/e of 390, has similarities with bis (2-ethyl-hexyl) phthalate. This is supported by the fact that SI of 95 as well as the fragmentation pattern and m/e mass spectra which appeared were similar to the pattern of fragmentation and m/e mass spectra of bis (2-ethyl-hexyl) phthalate.
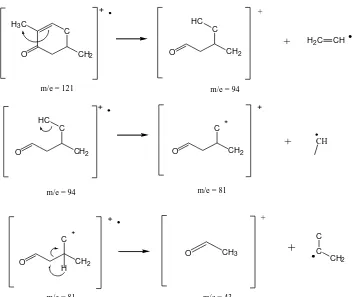
The fragmentation patterns of isolated compounds found in the analysis ere β -(acetyloxy)- α-methyl- α-estran-3-one and bis (2-ethyl-hexyl) phthalate. The fragmentation
patter s of β- (acetyloxy) - α-methyl- α-estran-3-one are 332 (M+), 272, 257, 121, 94, 81,
Figure 6 . Fragmentation Patterns of 7β-(acetyloxy)- α-methyl-5α-estran-3-one.
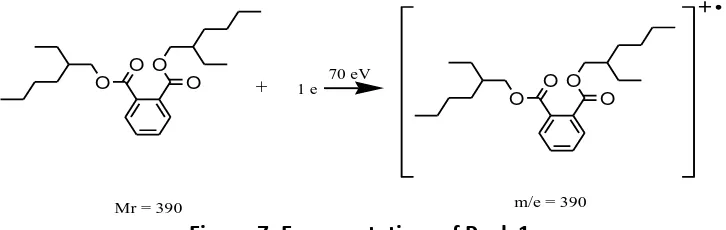
Meanwhile, the fragmentation patterns of bis (2-ethyl-hexyl) phthalate are 390 (M+), 279, 168, and 149. The fragmentation patterns of bis (2-ethyl-hexyl) phthalate are shown in Figure 7.
Fragmentation patterns of Peak 1
Compound Analysis………..…………Tithonia diversifolia Leaves Amanatie, 2016
Figure 7. Fragmentation of Peak 1.
The extraction method in this study is macerated by dissolving the powder with methanol solvent. Methanol was chosen to be the solvent because it is widely used in the extraction process and is able to dissolve all the preliminary and secondary metabolites. In addition, methanol also has a low boiling point of 64.7°C, so that it will be easily evaporated. As much as 0.5 kg Tithonia diversifolia leaf powder was macerated using approximately 1 liter technical methanol for 2 x24 hours long, while being shaken occasionally. The powder that has been macerated remaserasi process is done only once at the same time. The methanol extract was then separated from Tithonia diversifolia leaf powder and concentrated using Buchii evaporator to obtain a concentrated methanol extract as much as 215 mL.
Separating the Chloroform Extract using Gravity Column Chromatography (GCC) Method
The separation process was conducted by using gravity column chromatography (GCC).Before processing, the column should be packed first, and the extract used should be as much as 1.00 grams, because the diameter of the column was just 2 cm wide. The solvent used in this process was selected by trial and error method, with two solvents mixed by TLC. The TLC result edinan appropriate eluent i.e. a mixture of n-hexane and ethyl acetate in a ratio of 6: 4. In 20 bottles of fraction were obtained from this process, each of which were then identified using the TLC, eluted using a mixture of n-hexane and ethyl acetate with the ratio 6: 4.
Furthermore, the concentrated methanol extract was partitioned using chloroform. The partitioning process aimed to separate compounds based on the polarity of the more-specific secondary metabolites. The concentrated methanol extract was partitioned using n-hexane and then the rest of the methanol in this partition was again partitioned using chloroform. The tools used in this partitioning process was separating funnel. The partitioning process was repeated three times, each with the ratio of 6:4 between n-hexane and ethyl acetate. The partitioning process resulted in as much as 215 mLethyl acetate fraction. Then this fraction is evaporated to produce concentrated chloroform fraction as much as 110.6 mL.
The next stage was the separation process using chromatographic techniques with Vacuum Liquid Chromatograph, Gravity Column Chromatography (GCC), and Thin Layer Chromatography (TLC). Prior to the separation, the ethyl acetate fraction concentrated in advance using silica gel was impregnated intended that the compound in the fraction bound to the silica gel so that secondary metabolites can be eluted only with a suitable solvent in the separation process with GCC. Thin Layer Chromatography (TLC) function to determine the appropriate eluent to be used in the process of GCC, as well as to test the purity of the isolated compounds.
Compound Analysis………..…………Tithonia diversifolia Leaves Amanatie, 2016
The TLC resulted in the appropriate eluent, i.e. a mixture of n-hexane and ethyl acetate with a ratio of 6:4. This process generated 20 bottles off raction, which were then identified with TLC from each bottle of fraction using a mixture of n-hexane and ethyl acetate with the ratio of 6:4. The 20 bottles of fraction resulted from TLC were grouped based on the pattern of separation and the same value of Rf, so that there were 5 groups/fractions, namely I (1-2), II (3-4), III (5-8), IV (9-13) and V (14-20). Group/fraction V (14-20) was assumed to produce a single node so that this group of bottles was identified to be further examined.
From fraction V (14-20), the results were then gathered into one and dried, in order to obtain as much as 0.1 gram. This fraction showed a single node on the chromatogram, so that a further test for purity using TLC with three kinds of eluent i.e. n-hexane: ethyl acetate (6:4) (Figure A), acetone : ethyl acetate (4:1) (Figure B), and dichloromethane : acetone (9:1) (Figure C). The chromatogram as a result of purity test is shown in Figure 13.
Separation with Vacuum Liquid Chromatography clicking to use tools such as a vacuum pump to accelerate the rate of the eluent. Eluent used include 100% hexane, n-hexane: ethyl acetate with the ratio of 6:4; 4:1; 9:1, ethyl acetate 100%, and acetone100%. Eluent-column eluent is passed on by the increase in polarity then vacuum and collected in bottles fractions. Thus obtained 20 bottles fraction, the fraction of each bottle is in-identification using Thin Layer Chromatography (TLC) with a mixture of n-hexane eluent: ethyl acetate in a ratio of 6:4. Based on the results of TLC Rf price similarity then 8 bottles fractions were grouped into two fractions, namely fraction A, fraction B and Fraction C. Based on the chromatogram, selected fractions A for further separation using column chromatography Gravity 1.
The separation process with CCG 1 aims to obtain more pure fractions with a single stain on the TLC plate. Eluent used in the separation process is a mixture of n-hexane: ethyl acetate in a ratio of 6:4. This process produces 20 bottles fraction, then be identified using TLC techniques. Based on the results 1 TLC chromatogram, taken one of the most dominant faction group and have the same price of Rf (0.2) is the fraction F6A. These groups combined and concentrated fractions and tested for purity using TLC techniques. The purity of the test is known that has not produced a single stain on a TLC plate. Therefore, this fraction is separated group returned with techniques 2.
Separation process of CCG2 using the eluent a mixture of n-hexane: ethyl acetate in the ratio of6:4. In this separation process produces 20 bottles of fractions, then identified using TLC techniques. Furthermore, the fractions were grouped by similarity price Rf and obtained two groups of fractions. Then the selected group of the most dominant fraction is the fraction of Rf 0.45. These groups combined and concentrated fractions and tested for purity using TLC techniques.
Test purity by TLC technique using the eluent mixture of chloroformwith 3 kinds of comparisons among others (6:4), (4;1), (9:1). The value of Rf calculations on this test can be seen in Appendix 2. Relatively pure compounds in the yellow-green room temperature.
Analysis using UV-Vis, IR spectrometer, and GC-MS spectrometer
Analysis with UV-Vis spectrophotometer aimed to investigate the electronic transition and the chromophore group in the identified compounds. Chromophore group is a functional group that can absorb ultraviolet radiation near the visible region.
Compound Analysis………..…………Tithonia diversifolia Leaves Amanatie, 2016
Solvent used in this analysis was methanol, since methanol can dissolve the sample well and do not absorb ultraviolet radiation. The results of the analysis using UV-Vis
spe trophoto eter sho ed the a i u a ele gth λmaks) at 402.0 nm and 664.5 nm.
The Infrared (IR) spectrometer analysis aimed to determine the functional groups contained in the isolated compounds. Based on the IR spectra of isolated compounds showed an -OH group at 3429.59 cm-1, CH aliphatic at 2951.62 cm-1and 2839.31 cm-1, group C=C in 1644,01cm-1, -CH3 in 1405.86 cm-1, and C=O at 1018.12 cm-1.
CONCLUSION
Based on the discussion above some conclusions can be drawn as follows:
1. Analysis compound in the leaves Tithonia diversifolia using a UV-Vis spectrophotometer
sho ed the a i u a ele gth λ aks at . a d . . Based o the
analysis of IR spectrometer it is known that the compound contains -OH group, aliphatic CH, the C=O ester group, and the C=C double bond.
2. Mass spectrum of GC-MS shows the m/e value of 332 which is similar to β-(acetyloxy)- α -methyl-5α-estran-3-one with the abundance of 69.53%. The secondary metabolite compound which can be isolated from chloroform fraction of Tithonia diversifolia leaves is steroid.
ACKNOLEDMENTS
Author gratefully thanks to Rector of UNY due to the funding support.
REFERENCES
Anonim. (2015).Tithonia diversifolia. Accessed from www.berkhasiat.web.idon 27 June 2015 at 11.00 a.m.
Amanatie and Eddy Sulistyowati (2014). Structure elusidation of the leaf of Tithonia diversifolia (Hemsl) Gray, Proceeding in National Seminar on Chemistry, F.MIPA UNY, Yogyakarta.
Harborne, J.B. (1987). Phytochemical Methods: Guide How to Analyze Modern Plant. Bandung: ITB. pp. 103-105.
Hardjono Sastrohamidjojo (1985).Chromatography. London: Liberty.
Spectroscopy. London: Liberty (1991). Nuclear Magnetic Resonance Spectroscopy (Nuclear magnetic resonance, NMR). London: Liberty (1994).
Hostettmann K., M. Hostettmann and A. Marston. (1995). Use of the Preparative Chromatography Method Isolation of Natural Compounds. Bandung: ITB
Hutapea, J.R. (1994). Inventory Indonesian Medicinal Plants. Jakarta: Agency for Health Research and Development. p. 297
Montakarn Thongsom, Warangkana Chunglok, Rapeeporn Kuanchuea, Jitbanjong Tangpong. (2013). Antioxidant and Hypoglycemic Effects of Tithonia diversifolia Aqueous Leaves Extract in Alloxan-i du ed Dia eti Mi e . Advances in Environmental Biology, 7(9): 2116-2125.
Robinson Trevor. (1991).Organic Ingredients Plant High. Bandung: ITB.
Rubenstein, D., Wayne, D. and John Bradley (2003).Lecture Notes: Clinical Medicine, Sixth Edition. (Translation by dr. Annisa Rahmala). Jakarta: Erland. pp. 177-178.
Compound Analysis………..…………Tithonia diversifolia Leaves Amanatie, 2016
Sacher Ronald, A. and McPherson Richard, A. (2002). Review Clinical Laboratory Examination Results Edition 11. (Translations: dr. Brahm U. Pendit and dr. Dewi Wulandari). Jakarta: EGC. p. 287.
Salah Kosela (2010). Easy and Simple Determination of Molecular Structure Based Data spectra (NMR, Mass, IR, UV). Jakarta: UI.
Sitorus Marham (2009).Spectroscopy. Yogyakarta: Graha Science.
Sjamsul Arifin, A. (1986). Chemistry of Organic Natural Products. London: The Open University.
Stahl Egon (1985). Drug Analysis by Chromatography and Microscopy. (Translation KosasihPadmawinata). Bandung. ITB.
Sudjadi (1988).Separation methods. Yogyakarta: Canisius.
Taofik, M., Yulianti, E., Barizi, A. and Biological, E.K. (2010). Isolatio a d ide tifi atio of
active compounds Air Leaf Extract Thitonia diversifolia as Material Botanical
I se ti ides for Co trol Mites Erroph idae .Alchemy Vol. 2.No. 1. pp. 132-142.
Thomas, A.N.S. (1989).Traditional Medicinal Plants 1. New York: Canisius. P. 11.
Verawati Mimi Aria and Novicaresa, M. (2011). A ti-Inflammatory Activity of Methanol Extract of Leaves of Kembang Bulan (Titonia diversifolia A. Gray) White Mice against
Fe ales. Scientia Journal of Pharmaceutical Health Volume 1, Number 1. STIFI Foundation Pioneer Padang.pp.47-52.
Corresponding author: Dr. Amanatie, M.Pd., M.Si, Chemistry Department, Faculty of Mathematics and Natural Sciences, Yogyakarta State University, Yogyakarta, Indonesia. Email: [email protected]