www.elsevier.com / locate / bres
Research report
The substrate for brain-stimulation reward in the lateral preoptic area
I. Anatomical mapping of its boundaries
a b ,
*
bTamara Bushnik , Catherine Bielajew
, Anne T.M. Konkle
a
TBI /SCI Grants Office, San Jose, CA 95128, USA
b
School of Psychology, University of Ottawa, Ottawa, Ontario, K1N 6N5, Canada
Received 7 February 2000; accepted 30 May 2000
Abstract
Given the putative role of the lateral preoptic area as a primary contributor of the cell bodies of origin of the descending pathway linking a subset of lateral hypothalamic and ventral tegmental area reward neurons, the distribution of self-stimulation sites in this structure was mapped in 22 animals using moveable electrodes and threshold procedures. Ninety-seven electrode sites were evaluated with placements ranging from just rostral to the midline convergence of the anterior commissure back to the transition zone between the lateral preoptic and lateral hypothalamic areas; of these, roughly 2 / 3 supported self-stimulation which was widely observed throughout the lateral preoptic area and medial forebrain bundle. In general, self-stimulation thresholds obtained from lateral sites were most stable, and progressively so approaching more caudal regions. Examination of the slopes of the period / current trade-off functions revealed a tendency for higher values in lateral and caudal sites; in contrast, dorsoventral excursions did not influence these estimates. Taken together, these data provide support for the notion that the substrate for brain-stimulation reward in the lateral preoptic area has a relatively homogeneous distribution that is more diffusely organized than that found in reward sites activated further caudally in the medial forebrain bundle. 2000 Elsevier Science B.V. All rights reserved.
Theme: Neural basis of behavior
Topic: Motivation and emotion
Keywords: Brain-stimulation reward; Mapping; Lateral preoptic area; Trade-off functions; Moveable electrode; Medial forebrain bundle
1. Introduction have shown that neurons in the LPO and the area between the preoptic and anterior hypothalamic nuclei respond The lateral preoptic area (LPO), situated rostral to the antidromically to stimulation of the medial forebrain lateral hypothalamus (LH), has reciprocal connections with bundle (MFB) [32,36]. Cells responsive to activation of both the ventral tegmental area (VTA) and LH [33,40], and sites in the MFB that support self-stimulation are present is linked to the latter by a short transition zone, frequently in the lateral and medial preoptic areas, the ventral referred to as the bed nucleus of the medial forebrain pallidum, and the parastrial nucleus, with a much larger bundle [29]; rostral and caudal parcellations correspond to region of antidromically driven neurons existing in and the LPO and LH, respectively [15,16]. In view of its around the septal complex [38].
particular anatomical arrangement, the LPO is considered Metabolic markers have been used to further define an important candidate for the cell bodies of origin of the regions selectively activated by self-stimulation electrodes descending pathway that links a subset of LH and VTA in the MFB. Autoradiography with 2-deoxyglucose reward neurons [6,21,25,37,44]. However compelling this [13,34,35,39] has shown activation in the vertical limb of hypothesis, the LPO has not been systematically mapped the diagonal band of Broca (included within the for self-stimulation. For example, single cell recordings boundaries of the LPO in some studies [28]), the bed nucleus of the stria terminalis, the medial preoptic area with suppression of activity in the lateral habenula, as a *Corresponding author. Tel.: 11-613-562-5800; fax: 1
1-613-562-consequence of self-stimulation in the anterior VTA [13]. 5147.
E-mail address: [email protected] (C. Bielajew). Cytochrome oxidase [2] and glycogen phosphorylase
[17,22] have been similarly exploited to examine sites ranged from 0.2 to 0.92 mm posterior to bregma, 0.6 to 2.0 activated by stimulating electrodes in LH reward sites. mm lateral to the mid-sagittal suture, and 7.6 to 8.2 mm Cytochrome oxidase activity is evident in the lateral septal ventral to the skull surface reading at bregma. The nucleus and nucleus accumbens when short pulse durations anesthetic consisted of a combination of sodium pen-are used to activate reward loci while a more widespread tobarbital (Somnotol, 65 mg / kg i.p.) and xylazine (Rom-activation is observed from the use of longer pulse pun, 0.05 ml i.m.); atropine sulfate (0.05 ml s.c.) was durations [2]. In the case of glycogen phosphorylase, the administered just prior to surgery in order to minimize diagonal band of Broca and the caudate nucleus show respiratory distress.
greater activation of reaction product on the stimulated
side, and the habenula in the contralateral hemisphere in 2.2. Apparatus one study [22], and weak activation in the ipsilateral lateral
septum in another study [17]. More recently, c-fos im- Electrical stimulation was delivered via an integrated munohistochemistry has been similarly exploited and circuit pulse generator, manufactured in house, and a generally supports the implication of basal forebrain constant-current amplifier [24]. The current was continu-structures such as the LPO as responsive to rewarding ously monitored on an oscilloscope by reading the voltage MFB stimulation [1,10,20,28]. drop across a 1 kVprecision resistor in series with the rat. The purpose of this mapping study was to obtain In order to prevent polarization at the electrode tip in the information about the distribution of reward sites in the absence of a pulse, the output was shorted to ground via a region of the LPO and their spatial organization; the 1 kV resistor.
location of self-stimulation sites within and around the
LPO was therefore documented. At sites that reliably 2.3. Screening and training supported this behavior, the trade-off relationship between
current and period was established in order to permit the Three days after surgery, the animals were trained to characterization of the neural density and the boundaries of lever-press on a continuous reinforcement schedule for 0.5 the behaviorally relevant bundle. Estimates of the relative s trains of square wave monophasic pulses, 0.1 ms in neural density of elements within the effective stimulation duration, using conventional operant shaping techniques. If field, at individual sites, can be gleaned from period after two screening sessions no self-stimulation behavior thresholds [23,45]. Due to the trade-off between current was evident, then the electrode was moved a ventral and period (the reciprocal of frequency), any change in distance of 0.08 to 0.24 mm, aided by a calibrated driver; current must be accommodated by roughly the same the new site was evaluated the following day. This change in period in order to maintain equivalent levels of procedure continued until either bar-pressing was estab-behavior. The function that describes this relationship, lished or the full ventral travel of the electrode was used, when plotted in logarithmic space, ascends to level off at based on the estimated location of the electrode tip from high currents where the relationship between these two the Paxinos and Watson atlas [31].
parameters breaks down. Thus differences in slope across During the training phase of the study, the animals were sites can be used to infer the density of the relevant introduced to 60 s trials preceded by five priming stimula-substrate. (The assumptions underlying this interpretation tions, separated by 1 s, set at the same values as the trial are explained in detail in Gallistel et al. [14]). This strategy parameters; the current was 200 mA. A descending se-has been profitably employed by others to map more quence of periods was presented, starting with a value at posterior reward sites from the stria medullaris [8,42] and which no response occurred. Each successive period was ventral pallidum regions [30] to the posterior mesence- 0.1 log 10 unit below the previous one. The series phalon [9,11], as well as rostrally to study the connections continued until the bar pressing rate exceeded the criterion between the caudate–putamen and the medial prefrontal of 35 responses / min. A rate / period curve was plotted for cortex in our own laboratory [7,41]. each current and the period threshold, i.e. the period required to support the criterion response rate was de-termined. The testing phase, during which complete
trade-2. Materials and methods off functions were generated, was initiated when stable thresholds were obtained. The criterion for stability was 2.1. Subjects and surgery met when the standard error of the mean associated with the average period threshold across sessions did not exceed Twenty-two male Long–Evans rats (Charles River 10% of the mean value. Generally, stable thresholds were Laboratories) were housed separately in plastic cages under achieved within two sessions, during which repeated rate / a 12-h light / dark cycle with lights on at 07.00 h. Food and period functions at the baseline current were collected. water were available ad libitum. Moveable electrodes
(Kinetrode Inc.) were implanted in all but one subject 2.4. Behavioral tests (TH22) which received a fixed electrode. The electrodes
was conducted; the currents used ranged from 80 mA to anterior to the LPO, the second, third, and fourth groups 1000 mA, incrementing in 0.2 log10 units. The period were found within the LPO nucleus at roughly anterior, thresholds, as previously described, were then plotted in mid, and posterior levels, and the fifth group was situated order to generate the trade-off relationship between the posterior to the LPO, in the transition zone between the period threshold and the current. If the period thresholds LPO and the LH.
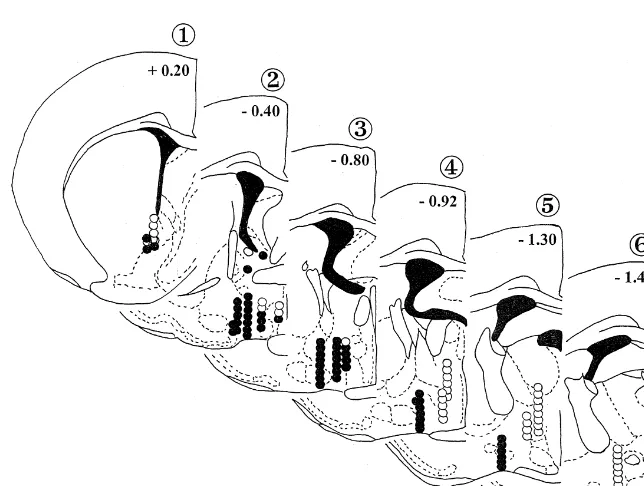
associated with a baseline current administered at the The placements are shown in Fig. 1. Those of the first beginning and at the end of each session differed by more group (n54 rats, 10 sites) were found to be just rostral to than 0.1 log10 units, the data from the session were the midline convergence of the anterior commissure (Fig. discarded. When the trade-off functions were established 1, plate 1). This level is dominated by the caudate-putamen for a range of currents, the electrode was moved and the and the nuclei of the precommissural septum which site tested anew using the same procedure. An example of includes the horizontal and vertical limbs of the diagonal a rate / period function generated at different currents has band, the medial septum, and compartments ‘a’ and ‘b’ of been published elsewhere [19]. the MFB [29]. The second group (n57 rats, 24 sites) is made up of electrodes located around or near the anterior
2.5. Histology part of the LPO (Fig. 1, plate 2). At this level, the anterior
commissure and the fornix, as yet not bifurcated, are still Following administration of a lethal dose of sodium evident. The LPO is bordered medially by the medial pentobarbital, animals were perfused intracardially with preoptic area, laterally by the ventral pallidum and sub-saline, followed by 10% formalin. The brains were re- stantia innominata, dorsally by the bed nuclei of the stria moved and stored in 10% formalin for at least 1 week. terminalis, and, ventrally by the nucleus of the horizontal Coronal sections (40mm) were placed on coated slides and limb of the diagonal band. Three subjects (20 sites) stained with Cresyl Violet in order to better locate the contribute to the third grouping of electrode sites (Fig. 1, electrode tips using the Paxinos and Watson atlas [31]. plate 3). This level is characterized by a large, well-defined third ventricle, the movement of the medial preoptic area from the midline to a more lateral position, and a more
3. Results dispersed optic chiasm. The LPO is bordered by the same structures as at the previous rostral level. The fourth group
3.1. Histology (n54 rats, 19 sites) had placements at the intersection of
the lateral ventricles with the midline (Fig. 1, plate 4). The electrode placements were divided into five groups, Here, the LPO is bordered medially by the medial preoptic based on anteroposterior position: the first was located area, dorsally by the bed nucleus of the stria terminalis,
laterally by the horizontal limb of the diagonal band, and ventrally by the supraoptic nucleus at the base of the brain. The fifth group of electrodes (n54 rats, 25 sites) was situated posterior to the LPO at the level of the anterior, lateroanterior, and lateral hypothalamic areas (Fig. 1, plates 5 and 6).
3.2. Mapping of self-stimulation sites
The composite drawing in Fig. 1 shows both the positive and negative self-stimulation sites; where appropriate, intersecting electrode tracks are combined. Self-stimulation was observed at 60 (61%) of the 98 placements that were evaluated. These included five sites from which threshold determinations could not be obtained because the threshold response rate or the stability criteria were not met (see Materials and Methods). Positive sites are denoted by closed circles; open circles mark those locations at which self-stimulation could not be elicited. Maximum response rates tended to be twice the criterion of 35 responses per minute across rats. The presence or absence of self-stimu-lation did not predict seizure and associated motor activity which were observed in both groups. The typical pattern of behavioral responses (sniffing, chewing, grooming, etc.) was more likely to accompany positive rather than nega-tive sites, but a thorough evaluation of the behavioral profile was not undertaken. It may be that additional screening sessions would have increased the yield of positive sites; however, our experience with the LPO to date does not suggest that a gradual acquisition of
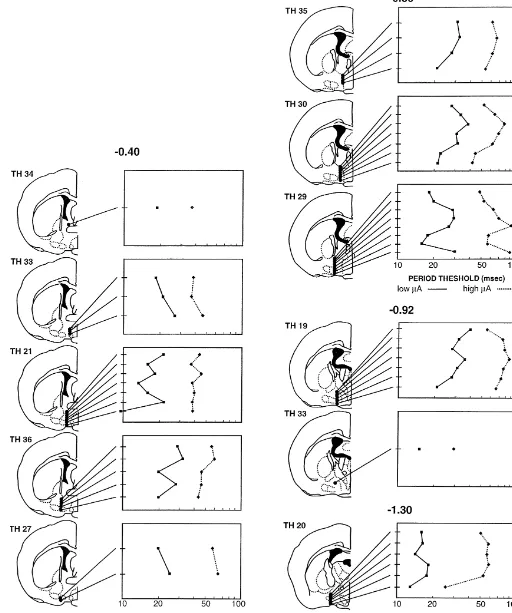
self-stimulation characterizes this structure. Fig. 2. Results of a representative subject, TH21, showing the average period / current trade-off function derived from stimulation at different Subjects with similar placements produced consistent
dorsoventral electrode positions at an anteroposterior site located 0.4 mm results. The one exception was in the most anterior
behind bregma [31]. The trade-off functions are graphed on a log–log stimulation site (see Fig. 1, plate 1) where the two subjects
scale with period threshold plotted against current intensity. The error that did bar-press had electrode tracks that were indis- bars represent the standard error of the mean.
tinguishable from the two subjects that failed to respond to the stimulation; however, the positive sites in this case did
not support stable self-stimulation. between period threshold and current for a representative In general, medial sites, including the medial preoptic animal in which seven sites were evaluated from a total of area and nucleus, did not support self-stimulation (Fig. 1, 51 across animals. Except for the most ventral placement plates 2, 4, 5, and 6); if bar-pressing was observed, it was in this example, the relationship between current and not robust enough to generate trade-off functions. In period was roughly constant with electrode move; this contrast to the medial preoptic area, the majority of LPO pattern was observed in all animals.
sites was associated with vigorous self-stimulation (plates While there was no obvious slope variation in the 2, 3, and 4). The bed nucleus of the stria terminalis, a more trade-off functions generated at different dorsoventral sites, dorsal structure, was also positive for self-stimulation this does not provide any interpretation about the ordinate (plate 2) at least at its more rostral level. Robust self- position of the curves. To examine this, we plotted for stimulation was generally elicited from the compartments each subject the period thresholds as a function of dor-of the MFB and the LH (plates 2, 3, and 5); high response soventral electrode position for a low and high current. rates were associated with lateral sites, particularly in more This compresses the full trade-off functions such as shown
caudal regions. in Fig. 2 to two points representing roughly the extremes
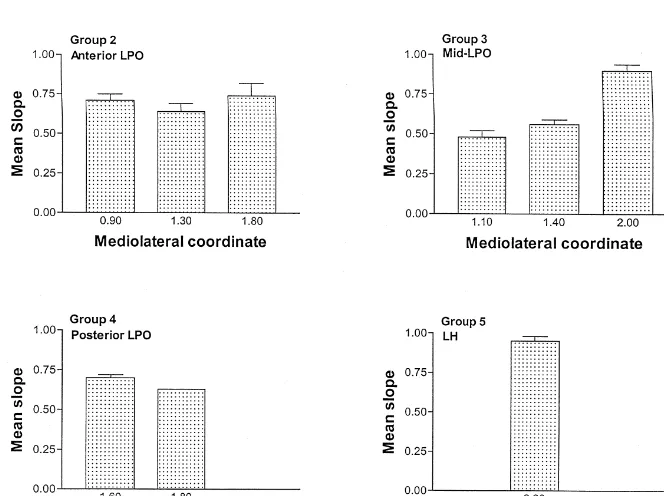
of the curves. Fig. 3a, b, and c illustrate these results in 3.3. Characteristics of the substrate for self-stimulation individual animals, with the subjects organized according
characteristic trade-off between current and period — as tendency for slope values to increase with distance from current increases, there is a compensatory increase in the midline, particularly in more caudal placements. period (or decrease in frequency); this effect was generally Groups 2 and 3, which had more sites associated with each maintained as the electrode was lowered, suggesting no mediolateral coordinate than the other two groups, were change in the trade-off property of the substrate at different examined for statistical significance using a simple 1-way depths. Finally, electrode position produced little alteration ANOVA design. The overall test was significant only in
25
in reward efficacy except in the mid-LPO region (note Group 3 (F2,16524.56, P51.3310 ). The post-hoc com-dorsoventral coordinate of 28.2 mm) where the high parison revealed a difference between the most lateral current in particular gave rise to higher period thresholds, slope (2.00) and those of the coordinates 1.10 and 1.40
26
interpreted as an increase in the rewarding effect of the (F1,16548.16, P53.0310 ), which did not differ from
stimulation. each other. Nonetheless, a linear trend was observed in this
25
A regression analysis was conducted on the individual group (F1,16530.26, P54.8310 ). The single subject in trade-off functions, which were generated at each dor- the LH group (Group 5) was found to have a comparable
2
soventral site. Only in those cases where the r value slope value to those reported in other LH placements [18]. exceeded 0.80, an indicator that the data were reasonably
linear, were slope values included in the comparison. The 2
r value did not exceed 0.80 in five (or roughly 10%) of 4. Discussion
the trade-off functions. In three of these, the curves that
failed to meet this criterion were observed at dorsal The LPO is a structure that has been examined in a
stimulation sites. variety of experimental paradigms intended to uncover the
Taking into consideration the three-dimensional coordi- origin of the cell bodies of the descending pathway linking nates of the stimulation sites, the regression slopes were LH and VTA reward neurons [5,6,26]. While the results of examined for patterns of change in the anteroposterior, lesioning of cells in the LPO [21,25,44], recording from mediolateral, and dorsoventral axes. Because no particular cells in the LPO [27,32,36], and measuring the metabolic order in the slope values obtained from excursions in the activation of LPO neurons [1,10,13,20,22,28,34,35], all of dorsoventral direction for any subject were noted, we these manipulations following MFB self-stimulation, have collapsed these slope values to generate an error term and suggested that the LPO may play a key role in the function arranged the average value for each subject in Fig. 4, of this reward pathway, a systematic investigation of self-according to group (which is based on the anteroposterior stimulation in this area has not been reported. The results dimension — see description above), and mediolateral of this study suggest that self-stimulation can be elicited coordinate. Displayed in this manner, the data suggest a throughout the LPO; however, the slopes of the trade-off
functions appear to vary more as a function of anteropos- competing systems which interfere with the elicitation of terior and mediolateral position than electrode depth. self-stimulation.
Specifically, the trade-off profiles tended to be marked by The location of positive and negative self-stimulation higher slopes as more lateral and caudal sites were sites, extending from the area anterior to the midline sampled, values that match the ones that we have obtained convergence of the anterior commissure caudally to the in our laboratory for the substrate underlying LH and VTA transition area between the LPO and LH, suggests a self-stimulation. Several factors may contribute to this projection that moves more laterally in its caudal direction. finding, including density and differences in the excitabili- For example, it was possible to elicit self-stimulation from ty and / or value of the postsynaptic signals generated by a medial site, 0.9 mm lateral to the midline, in the anterior the relevant neurons [11,45,46]. Recovery from refractori- LPO group, while in the LH group, negative self-stimula-ness as an index of excitability suggests that there are no tion sites were observed up to 1.6 mm lateral to the differences across LPO sites in this measure [3,12]. midline. Indeed, except for the most anterior group, lateral Specific tests for assessing changes in postsynaptic in- placements always supported self-stimulation while medial fluence were not carried out in this study. However, sites were far less likely to do so. Note that the latter several aspects of this study favour the first hypothesis, conclusion is based on only 36 sites, of which 8 were that our data reflect changes in the density of the relevant positive, and therefore warrants additional investigation. substrate. Based on anatomical descriptions of the MFB, The period / current trade-off function produces estimates this view carries face validity, in that the lateral pro- of both the neural density and the spatial boundaries of the gression of positive sites paralleled the rostrocaudal trajec- relevant substrate [46]. Through the use of moveable tory of the MFB [29,43]. On other grounds, it seems the electrodes the trade-off functions of a single subject can be most reasonable explanation. For example, we have con- examined for both a departure from linearity and the sistently observed that LPO currents are higher than the current at which the curve begins to asymptote; these values required to elicit self-stimulation from either the LH observations can be used to infer the spatial limits of the or the VTA. This is best examined in situations where reward substrate for that subject [7,11,42]. No consistent currents are selected in order to match period thresholds pattern was found in either the correlation between elec-between sites, such as is required in behavioral collision trode placement and the observation of a curvilinear experiments (two electrode designs); this manipulation is function or the current intensity at which the curve began needed so that the degree of summation between two sites to asymptote for the subjects in this study.
that are concurrently stimulated can be evaluated [37]. In The relative density of the behaviorally relevant neurons the subsequent article [3], the nature of the axonal connec- can be inferred from the slopes of the regression lines tivity was assessed between the LPO and VTA; with minor relating period threshold to current intensity. These values exception, the LPO current was 2 to 5 times the VTA did not differ greatly across LPO stimulation sites, espe-value. Similarly in previous collision studies [4,5,37], cially when the average of the slopes within each group aimed at examining LH and VTA linkage, the LH current (anterior, middle, and posterior LPO) were compared. was typically twice that of the VTA. The few LPO sites at Within individual groups, differences in slope were de-which direct axonal connectivity with the VTA was tected only in Group 3, which showed a predominant linear demonstrated were located at relatively anterior LPO levels trend. In contrast, the average slope value across sites for and were characterized by shallower trade-off functions the single subject in the LH group, which was comparable than that obtained in the VTA [3]; note that at least some to slope estimates obtained at other LH placements [18], of these neurons are common to both sites. While there was substantially greater, suggesting that the reward may be other explanations for this phenomenon, the most neurons in the LPO are less densely packed than in the LH. parsimonious one in our view is that the caudal and lateral Within the LPO, certain trends were observed that projections of the substrate underlying reward in the MFB suggested an increase in neural density as more caudal
are more dense. sites were stimulated. Thresholds increased as the
stimula-Self-stimulation could be elicited from activation of sites tion site moved caudally (see Fig. 4, groups 2–4); par-located throughout the LPO and compartments ‘a’ and ‘b’ ticularly at high currents, the threshold rose by an average of the MFB [29]. For all groups, except the most anterior of 39%. This pattern is consistent with the anatomical one, the dorsal sites were less likely to support the literature [15,29] which depicts a profile of greater neural behavior and even more so if they were medially situated. density at more caudal LPO sites.
reward by means of current-number trade-off functions, Behav. coarsely myelinated neurons extending to the VTA [43]. A
Neurosci. 107 (1993) 506–524. potential difference in composition between LPO and LH
[12] G. Fouriezos, S. Walker, J. Rick, C. Bielajew, Refractoriness of reward neurons is supported by the behaviorally derived neurons mediating intracranial self-stimulation in the anterior basal measures of refractoriness and estimates of conduction forebrain, Behav. Brain Res. 24 (1987) 73–80.
time between these two structures [6,12]. If these LPO [13] C.R. Gallistel, Y. Gomita, E. Yadin, K.A. Campbell, Forebrain origins and terminations of the medial forebrain bundle metabolical-neurons, thin and poorly myelinated, are the ones that
ly activated by rewarding stimulation or reward-blocking doses of underlie self-stimulation, they should be more difficult to
pimozide, J. Neurosci. 5 (1985) 1246–1261.
activate than corresponding LH ones; slope differences, [14] C.R. Gallistel, P. Shizgal, J.S. Yeoman, A portrait of the substrate for similar to those obtained in this study, could be observed self-stimulation, Psychol. Rev. 88 (1981) 228–273.
and not be due to relative differences in neural density [15] L.M.G. Geeraedts, R. Nieuwenhuys, J.G. Veening, Medial forebrain bundle of the rat: III Cytoarchitecture of the rostral (telencephalic) [45]. Given this concern, it would be useful to determine if
part of the medial forebrain bundle bed nucleus, J. Comp. Neurol. the relevant LPO neurons are the same ones that course
294 (1990) 507–536. downstream through the MFB. One direct manner to
[16] L.M.G. Geeraedts, R. Nieuwenhuys, J.G. Veening, Medial forebrain determine whether the same neurons underlie self-stimula- bundle of the rat: IV Cytoarchitecture of the caudal (lateral tion in the LPO and more caudal MFB sites is the use of hypothalamic) part of the medial forebrain bundle bed nucleus, J.
Comp. Neurol. 294 (1990) 537–568. the behavioral collision test [3]. The following paper
[17] C.W. Harley, J.S. Milway, M. Fara-On, Medial forebrain bundle presents the results from such an experiment.
stimulation in rats activates glycogen phosphorylase in layers 4, 5b, and 6 of ipsilateral granular neocortex, Brain Res. 685 (1995) 217–223.
[18] T. Harris, C. Bielajew, An examination of current / frequency
Acknowledgements tradeoffs of rewarding brain stimulation along the medial forebrain
bundle. Presented at the Milner Reward and Reinforcement Confer-The authors wish to thank the Natural Sciences and ence, Montreal, Quebec (1988).
[19] T. Harris, C. Bielajew, Diazepam alters brain-stimulation reward Engineering Research Council of Canada for its support of
thresholds in seizure-prone sites, Behav. Brain Res. 46 (1991) this project.
167–173.
[20] G.E. Hunt, I.S. McGregor, Rewarding brain stimulation induces only sparse fos-like immunoreactivity in dopaminergic neurons, Neuroscience 83 (1998) 501–515.
References
[21] J.D. Janas, J.R. Stellar, Effect of knife-cut lesions of the medial forebrain bundle in self-stimulating rats, Behav. Neurosci. 101 [1] A. Arvanitogiannis, C. Flores, J.G. Pfaus, P. Shizgal, Increased (1987) 832–845.
ipsilateral expression of Fos following lateral hypothalamic self- [22] A.T.M. Konkle, P. Wilson, C. Bielajew, Histochemical mapping of stimulation, Brain Res. 720 (1996) 148–154. the substrate for brain-stimulation reward with glycogen phosphor-[2] C.H. Bielajew, Distribution of cytochrome oxidase in response to ylase, J. Neurosci. Meth. 93 (1999) 111–119.
rewarding brain stimulation: effect of different pulse durations, [23] E. Miliaressis, P.-P. Rompre, A. Durivage, A psychophysical method´ Brain Res. Bull. 26 (1991) 379–384. for mapping behavioral substrates using a moveable electrode, Brain [3] C. Bielajew, T. Bushnik, A.T.M. Konkle, D. Shindler, The substrate Res. Bull. 8 (1982) 693–701.
for brain-stimulation reward in the lateral preoptic area: II. Con- [24] W.J. Mundl, A constant-current stimulator, Physiol. Behav. 24 nections to the ventral tegmental area, Brain Res., submitted. (1980) 991–993.
[4] C. Bielajew, P. Shizgal, Behaviourally derived measures of conduc- [25] B. Murray, P. Shizgal, Anterolateral lesions of the medial forebrain tion velocity in the substrate for rewarding medial forebrain bundle bundle increase the frequency threshold for self-stimulation of the stimulation, Brain Res. 237 (1982) 107–119. lateral hypothalamus and ventral tegmental area in the rat, Psycho-[5] C. Bielajew, P. Shizgal, Evidence implicating descending fibers in biology 19 (1991) 135–146.
self-stimulation of the medial forebrain bundle, J. Neurosci. 6 [26] B. Murray, P. Shizgal, Behavioral measures of conduction velocity (1986) 919–929. and refractory period for reward-relevant axons in the anterior LH [6] C. Bielajew, A. Thrasher, G. Fouriezos, Self-stimulation site in the and VTA, Physiol. Behav. 59 (1996) 643–652.
lateral hypothalamic and lateral preoptic areas are functionally [27] B. Murray, P. Shizgal, Physiological measures of conduction ve-connected, Can. Psychol. Abstr. 28 (1987) 2a. locity and refractory period for putative reward-relevant MFB axons
´
[7] C. Bielajew, M. Trzcinska, Activation of reward-relevant neurons in arising in the rostral MFB, Physiol. Behav. 59 (1996) 427–437. the caudate–putamen influences the development of medial prefron- [28] D. Nakahara, Y. Ishida, M. Nakamura, I. Kuwahara, K. Todaka, T. tal cortex self-stimulation: a moveable electrode mapping study, Nishimori, Regional differences in desensitization of c-fos expres-Acta Neurobiol. Exp. 58 (1998) 189–198. sion following repeated self-stimulation of the medial forebrain [8] A. Blander, R.A. Wise, Anatomical mapping of brain stimulation bundle in the rat, Neuroscience 90 (1999) 1013–1020.
reward sites in the anterior hypothalamic area: special attention to [29] R. Nieuwenhuys, L.M.G. Geeraedts, J.G. Veening, The medial the stria medullaris, Brain Res. 483 (1989) 12–16. forebrain bundle of the rat: I General introduction, J. Comp. Neurol.
´
[9] S.M. Boye, P.-P. Rompre, Mesencephalic substrate of reward: axonal 206 (1982) 49–81.
connections, J. Neurosci. 16 (1996) 3511–3520. [30] G. Panagis, E. Miliaressis, Y. Anagnostakis, C. Spyraki, Ventral [10] C. Flores, A. Arvanitogiannis, P. Shizgal, Fos-like immunoreactivity pallidum self-stimulation: a moveable electrode mapping study,
in forebrain regions following self-stimulation of the lateral hypo- Behav. Brain Res. 68 (1995) 165–172.
thalamus and the ventral tegmental area, Behav. Brain Res. 87 [31] G. Paxinos, C. Watson, The Rat Brain in Stereotaxic Coordinates,
(1997) 239–251. 2nd Edition, Academic Press, New York, 1986.
properties of preoptic / anterior hypothalamic neurones following bundle lesions fail to structurally and functionally disconnect the medial forebrain bundle stimulation, J. Physiol. 279 (1978) 347– ventral tegmental area from many ipsilateral forebrain nuclei:
360. implications for the neural substrate of brain stimulation reward, J.
[33] O.T. Phillipson, Afferent projections to the ventral tegmental area of Neurosci. 18 (1998) 8515–8533.
tsai and interfascicular nucleus: a horseradish peroxidase study in [40] L.W. Swanson, An autoradiographic study of the efferent con-the rat, J. Comp. Neurol. 187 (1979) 117–144. nections of the preoptic region in the rat, J. Comp. Neurol. 167 [34] L.J. Porrino, R. Esposito, T. Seeger, A. Crane, A. Pert, L. Sokoloff, (1976) 227–256.
´
Metabolic mapping of the brain during rewarding self-stimulation, [41] M. Trzcinska, C. Bielajew, Functional connections between medial Science 224 (1984) 306–309. prefrontal cortex and caudate–putamen in brain-stimulation reward [35] L.J. Porrino, D. Huston-Lyons, G. Bain, L. Sokoloff, C. Kornetsky, of rats, Behav. Neurosci. 112 (1998) 1177–1186.
The distribution of changes in local cerebral energy metabolism [42] M.P. Vachon, E. Miliaressis, Dorsal diencephalic self-stimulation: a associated with brain stimulation reward to the medial forebrain movable electrode mapping study, Behav. Neurosci. 106 (1992) bundle of the rat, Brain Res. 511 (1990) 1–6. 981–991.
´
[36] P.-P. Rompre, P. Shizgal, Electrophysiological characteristics of [43] J.G. Veening, L.W. Swanson, W.M. Cowan, R. Nieuwenhuys, L.M.G. neurons in forebrain regions implicated in self-stimulation of the Geeraedtss, The medial forebrain bundle of the rat. II. An au-medial forebrain bundle in the rat, Brain Res. 364 (1986) 338–349. toradiographic study of the topography of the major descending and [37] P. Shizgal, C. Bielajew, D. Corbett, R. Skelton, J. Yeomans, ascending component, J. Comp. Neurol. 206 (1982) 82–108.
Behavioral methods for inferring anatomical linkage between re- [44] M.A. Waraczynski, Basal forebrain knife cuts and medial forebrain warding brain stimulation sites, J. Comp. Physiol. Psychol. 94 bundle self-stimulation, Brain Res. 438 (1988) 8–22.
(1980) 227–237. [45] J.S. Yeomans, Principles of Brain Stimulation, Oxford University ´
[38] P. Shizgal, D. Schindler, P.-P. Rompre, Forebrain neurons driven by Press, New York, 1990.
rewarding stimulation of the medial forebrain bundle in the rat: [46] J.S. Yeomans, R. Pearce, D. Wen, R.D. Hawkins, Mapping midbrain comparison of psychophysical and electrophysiological estimates of sites for circling using current-frequency trade-off data, Physiol. refractory periods, Brain Res. 499 (1989) 234–248. Behav. 32 (1984) 287–294.
![Fig. 2. Results of a representative subject, TH21, showing the averageperiod/current trade-off function derived from stimulation at differentdorsoventral electrode positions at an anteroposterior site located 0.4 mmbehind bregma [31]](https://thumb-ap.123doks.com/thumbv2/123dok/3139577.1382793/4.612.315.542.62.418/representative-averageperiod-stimulation-differentdorsoventral-electrode-positions-anteroposterior-mmbehind.webp)