PHOTOGRAMMETRIC AND LIDAR DOCUMENTATION OF THE ROYAL CHAPEL
(CATHEDRAL-MOSQUE OF CORDOBA, SPAIN)
J. Cardenal a, *, J.L. Perez-Garcia a, E. Mata a, M.A. Hernandez a, A. Mozas a, J. Delgado a, A. Lopez-Arenas a, J.E. Meroño b a
Dept. of Cartographic, Geodetic and Photogrammetric Engineering, High Polytechnical School of Jaen. University of
Jaen, Campus Las Lagunillas, s/n, 23071-Jaen, Spain - (jcardena, jlperez, emata, acaro, antmozas, jdelgado,
alarenas)@ujaen.es
bDept. of Graphic and Geomatic Engineering, University of Cordoba, Campus de Rabanales, 14071-
Cordoba, Spain - ir1melaj@uco.es
CIPA, ICOMOS and Commission V, WG VI/4
KEY WORDS: Cultural heritage, orthoimage, rectification, TLS, non-metric camera, calibration
ABSTRACT:
At present, cultural heritage documentation projects use a variety of spatial data acquisition techniques such as conventional surveying, photogrammetry and terrestrial laser scanning. This paper deals with a full documentation project based on all those techniques in the Royal Chapel located in the Cathedral-Mosque of Cordoba in Spain, declared World Heritage Site by UNESCO. At present, the Royal Chapel is under study for a detailed diagnostic analysis in order to evaluate the actual state of the chapel, pathologies, construction phases, previous restoration works, material analysis, etc. So in order to assist the evaluation, a documentation project with photogrammetric and laser scanner techniques (TLS) has been carried out. With this purpose, accurate cartographic and 3D products, by means of the integration of both image and laser based techniques, were needed to register all data collected during the diagnostic analysis.
* Corresponding author.
1. INTRODUCTION
1.1 General description
A complete documentation project has been carried out in the Royal Chapel located in the Cathedral-Mosque of Cordoba in Spain, declared World Heritage Site since 1984 and extended to comprise the Historic Centre of Cordoba in 1994 (Figure 1; UNESCO-WHC, 1994). The Great Mosque, built on the ruins of an old Christian church, was constructed in different phases between the VIIIth and Xth centuries under the Islamic Rule of the Iberian Peninsula. The mosque represents one of the most outstanding examples of Moorish architecture in Al-Andalus, being the most remarkable features the hypostyle arcade with 1300 columns and the two-tier free-standing horseshoe arches resting on columns. At the time of its construction, the Great Mosque, covering an area of nearly 25000 m2, was the second largest mosque in the world behind the Sacred Mosque of Mecca.
Figure 1. Left: aerial view of Historic Centre of Cordoba with the Cathedral-Mosque (centre of the image) near the Roman Bridge on Guadalquivir River. Right: hypostyle hall with horseshoe arches.
After the Christian conquest of Cordoba in XIIIth century, the mosque was turned back into the Christian church and some alterations, mainly in Renaissance style, were accomplished during its conversion in the Cathedral of Cordoba, which partially helped to preserve the monument for the next centuries.
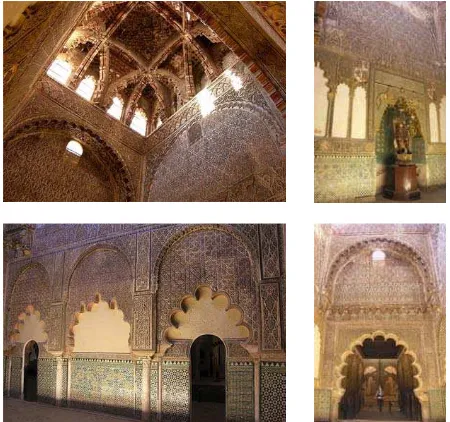
Figure 2. Royal Chapel. Upper left: dome and south and east walls. Upper right: vaulted niche in west wall. Lower left: east side wall. Lower right: south wall with blind and multi foil arches open to the nave of the Cathedral.
The Royal Chapel was added in the XIVth century as a burial place for the Christian kings and it was decorated in mudejar style (Figure 2). The chapel has got a rectangular plan (9 m x 6 m) and the floor level is 2 m higher than the cathedral floor, since the chapel is above the crypt. The walls (10.5 m high) have a tiling skirting board at their base and they are wainscoted with carved stucco full of geometrical decorations. The northern and southern walls (the minor sides) are very similar and they are decorated with a blind arch profusely ornamented resting on a multi foil arch opened to the nave of the cathedral. The walls are crowned by a dome (6.5 x 6.5 m square plan and 6 m high) with eight interlaced cusped arches, also decorated with carved stucco and mocarabes.
1.2 Aims of the work
At present the Royal Chapel is under study for a detailed diagnostic analysis in order to evaluate the actual state of the chapel, pathologies, construction phases and previous restoration works, material analysis, etc. So in order to assist the evaluation, a documentation project based on photogrammetric and laser scanner techniques (TLS) has been carried out. With this purpose, accurate cartographic and 3D products, based on the integration of both image and laser based techniques, were needed to register all data collected during the diagnostic analysis. In this sense, laser and photogrammetric surveys of the chapel and mosaics of orthophotographs and rectified images (at resolutions of 1 and 2 mm) of floor, walls, side of the ribs and vault were made.
2. INSTRUMENTS AND METHODS
At present, cultural heritage documentation projects use a variety of spatial data acquisition techniques such as conventional surveying, photogrammetry and terrestrial laser scanning (Grussenmeyer et al., 2008). The selection of the proper techniques and the appropriate procedures (both data acquisition and reduction methods) was conditioned by the required products, and their metric quality, but also by the constrained workspace and lighting conditions found.
2.1 Data acquisition and reduction instruments
First, a local reference system was established parallel to the main directions of the chapel walls and some control points were measured (with a reflectorless total station, Leica TCRA 1203) for both images and laser point clouds. Natural points clearly identifiable in the images and the point clouds were selected.
Figure 3. Left: Leica TCRA 1203 with diagonal eyepiece for point measurements in the upper part of the chapel. Middle: front and rear views of SLR EOS D5 and Powershot G10 cameras. Right: TLS Scanstation HDS3000 set up on scaffolds at the vault level.
A Leica Scanstation HDS3000 was used for the TLS survey. Point clouds were processed with Leica Cyclone® 5.8 and Maptek I-Site® 3.3 for laser data processing.
Two digital cameras were used: a full frame reflex 12.8 Mp Canon EOS D5 equipped with different fixed focal length lenses (from super wide angle to telephoto lenses) and a 14.7 Mp compact Canon Powershot G10 with a 6.1-30.5 mm zoom lens. So calibration procedures (both at field and laboratory) were needed. With respect to the photogrammetric processing software, two stereoscopic DPW’s (BAE System Socet Set® 5.0 and Leica Photogrammetry Suite® 9.1) for orthophoto generation and DEM edition were employed. Additionally a close range photogrammetry system, Photomodeler Scanner® 6.0, was used for initial approximate image orientation. And besides, some own developed routines for camera calibration and image rectification were also applied. Figure 3 shows all data acquisition instruments.
2.2 TLS survey
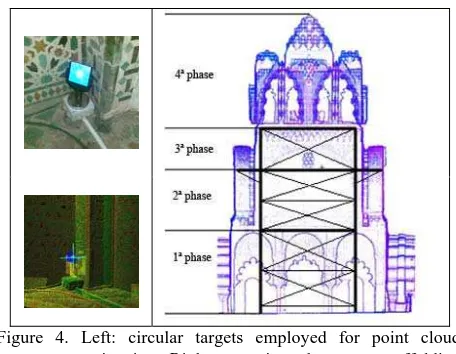
The Scanstation HDS3000 TLS has got a field of view of 360º (horizontal) x 270º (vertical), but because the height of the walls, hidden areas and complexity of the decorations, 30 scan stations were necessary to cover the whole chapel. Point cloud registering and alignment was done by target measurements (Figure 4). A total of 25 targets (white and blue circular targets) were measured, but these targets were only employed for the laser survey, not for photogrammetry.
Scan resolution was set between 2.5 mm and 5 mm, according to the complexity of the scanned surface. Because overlapping scans, real point cloud density ranged between 1-2 mm. This high density allowed the measurement of natural control points at precise details with the total station for both laser data and digital images. So both data set were in the same local reference system and oriented to the North.
Figure 4. Left: circular targets employed for point cloud registering. Right: scanning phases as scaffolding stages were being installed.
The scans were carried out as the diagnostic works were progressing and scaffolds were ascending. Scaffolds were installed at several stages and heights. First, the floor and walls were scanned up to 5 m height. In next phases, three scaffolds stages were sequentially set at 4 m, 8 m and 10 m height from the floor, and progressively walls and vault were scanned (Figure 4). Scanning the vault in the fourth phase required 17 scan stations because large occlusions due to the ribs and
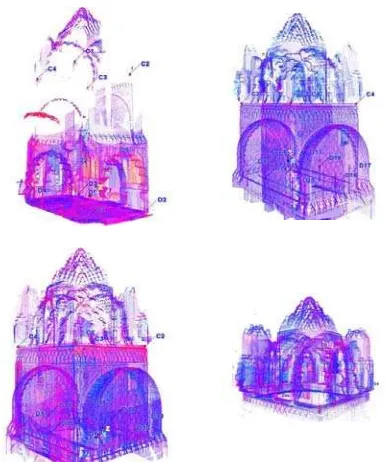
cusped arches in the vault. To avoid vibrations, once the scanner was set up on the scaffold platform and programmed, personnel went out the scaffolds and the TLS was controlled from the floor. Each scan phase was aligned separately by means of the targets (Figure 5), and finally all scans were merged in a global point cloud registered with the measured control points. Mean errors in the final global point cloud of the chapel were in the order of +2 mm.
Figure 5. Scan phases and number of scan stations. 1st phase, 7 scans (upper left); 2nd phase, 5 scans (upper right); 3rd phase, 1 scan (lower left); and 4th phase, 17 scans (lower right).
After completion of the whole scan, artifacts and noise were removed by filtering data and manual edition. The global point cloud was then reduced to a resolution of 2.5-5 mm according to the complexity of the zone. This was necessary in order to reduce the huge data volume.
2.3 Photogrammetric survey
Most of the photogrammetric survey was carried out before scaffoldings were set in the chapel. So first, the floor, side walls and vault were surveyed without any obstacle. After the last scaffolding stage reach the vault base (at 10 m height from the floor), the ribs sides and cusped arches in the vault were also recorded.
2.3.1 Camera calibration: Since the cameras were non metric, calibration procedures were necessary. Calibration methods were adapted to the different situations and lenses used. Previous to the work project, a network design analysis was performed in order to select the different lenses and the work distances according to the final resolution and required accuracy. After a work distance and lens was chosen, that lens, in the case of the EOS D5 reflex camera, was set to manual focus at that distance and locked with tape in order to maintain stable the inner camera-lens geometry. Table 1 shows the different lenses used and the calibration method.
The super-wide angle 20 mm lens used for the floor was calibrated at laboratory, with the lens locked at 2 m distance, by
collinearity self-calibration with minimal inner constraints using usual high convergent multi-photo block (Cardenal et al., 2004) and automatic coded target measurement. This distance was the same work distance used for surveying the floor, where the network (vertical stereoscopic shots) was not appropriate for camera field self-calibration.
Focal length Focus Surveyed area Calibration method 20 mm 2 m Floor Laboratory self-calibration 35 mm 6 m Side walls Field self-calibration 135 mm 10 m Vault Field self- calibration
Table 1. Canon EOS D5 camera lenses and the calibration method employed with manual focus setting locked.
In the case of the side walls (35 mm lens), since stereoscopic shots could be combined with some convergent images, field self-calibration methods were adopted using the measured natural ground control points. These blocks allowed also the densification of the control point network. And finally, the vault was surveyed with a telephoto lens (135 mm) and zenithal shots taken from the floor. Bearing in mind the large depth differences (up to 6 m) and the use of strips with different kappa orientation, a field self-calibration was performed without the use of convergent shots (only the parallel shots).
But additional images were necessary in occluded areas or zones not covered by the previous EOS D5 images blocks. In these cases the work distances were very different. Because the focus rings lenses were locked and objects were out of the lens depth of field, in order to avoid blurred images another camera was used (Powershot G10). In this case the zoom lens could cover those special situations. Because suspected large instability related with the zoom lens, some previous study was performed. The lens distortion was analyzed by means of the plumb line method (Brown, 1971; Figure 6).
Figure 6. Calibration of Canon Powershot G10 zoom lens. Upper: two images of vertical and horizontal lines at 2 m distance with zoom position at 6.1 mm. Lower: Symmetrical radial distortion functions (averaged from repeated calibrations) for the whole range of zoom steps (from EXIF data) in the G10 camera.
Since the camera file include the zoom lens step setting in the EXIF information (Exchangeable image file format), it is possible to know the zoom step used in a particular photo. All zoom steps (from 6.1 mm to 30.5 mm) were calibrated by the plumb line methods. Repeated calibrations during several months have confirmed a high stability in the symmetric radial distortion of the G10 lens at the different zoom steps and work
distances between 1 to 3 m. Figure 6 shows the variation of the radial distortion from the wide angle (at 6.1 mm) to the telephoto position (30.5 mm). If necessary, focal length and principal point could also be calibrated. But since distortion is known, those calculations could be easily performed with less restricted image block geometry.
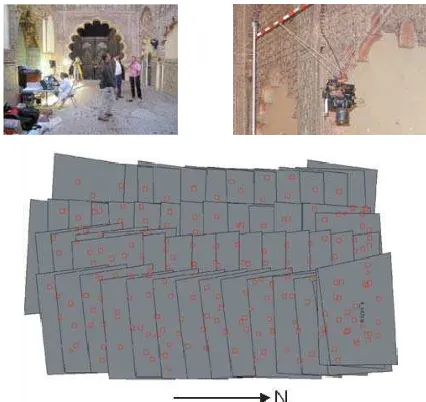
2.3.2 Photogrammetry data capture: according to the project requirement and final products, several networks were designed to meet the accuracy and image resolution needed. First, the floor was surveyed in order to obtain and orthophotograph at 1 mm resolution. That was obtained with the 20 mm lens at a work distance of 2 m. An image block organized in four strips (15 images per strip) with a conventional block geometry arrangement was done. Vertical photographs were achieved by means of a Picavet platform (Picavet, 1912) suspended from a pole attached to other rods (Figure 7). The Picavet system, a typical platform in kite, balloon and blimp photography, is an effective way to obtain conventional image block geometries (Mozas et al., 2012).
Figure 7. Image acquisition in the floor survey was performed with the help of a Picavet platform. Upper: Details of Picavet platform and acquisition procedure. Lower: Image block geometry with control and tie points measured. Photos are slightly tilted because the large and heavy 20 mm lens tipped back the Picavet platform.
In the case of side walls, the 35 mm lens was chosen in order to obtain orthophotographs at 2 mm resolution. In this case the heights of the walls were up to10 m (measured from the floor). Networks of parallel shots (at 5-6 m distances) were designed combined with convergent photographs (which helped to control point densification, camera calibration and avoid hidden areas in the blind arches). The camera was raised with a telescopic mast. The mast head could be remotely controlled and the camera was connected to a laptop with an USB link so there was a full control of exposition conditions. In the longest sides (11m at the east and west sides) the mast was set up at 6 stations and in the shortest sides (6 m at the south and north sides) 5 stations. In each station three photos were taken at approximately 2 m, 6 m and 9 m height covering the whole walls with stereoscopic coverage (Figure 8).
The vault was also surveyed from the floor. The final product was an orthophotograph of 1 mm resolution. That image resolution could be obtained using a telephoto lens (135 mm) set up in a tripod at the floor level. The reason to make photos at that distance, instead of raising the camera with the mast and using a shorter focal length, was related to large difficulties to move the extended mast and because, at longer work distances, large hidden areas (because ribs and arches in vault) could be avoided. Because large depth differences in the vault existed, depth of field was critical and the f-stop ring was set at the maximum value. That meant very large exposition times so camera was mounted on a conventional tripod. The survey covered an area of 6 m x 6 m. It was necessary four strips with 12-14 photographs per strip (Figure 9).
Figure 8. Telescopic mast used in the side wall photographs.
Figure 9. Image block geometry in the vault survey.
With respect to another areas (edge of the floors, arch intrados, side walls of the vault ribs and cusped arches, etc.), photographs were taken with the G10 camera, well set up on tripod or hand held. Details in the vault were registered after the last scaffolding stage reached the vault base at 10 m height. In these cases a large variety of situations were found so parallel, convergent and oblique photographs were taken (Figure 10).
Figure 10. Taking Canon G10 photographs of the sides of the ribs and arches in the vault (left and middle), and oblique shot at the extreme south part of the floor (where vertical shots couldn’t be properly taken).
3. RESULTS
3.1 Ortophotographs at floor, walls and vault
As mentioned, orthophotographs at resolutions of 1-2 mm were required. A previous orientation in Photomodeler software gave the initial orientation parameters to be imported by the DPW used (both Socet Set and LPS). Then a fine orientation (including self-calibration, if necessary, with own developed
software; Cardenal et al., 2004) and automatic point measurement in the DPW were computed. In all cases subpixel accuracy was reached in the final adjustments.
The digital elevation models derived from TLS were imported. Some cautions were needed related with resampling the DEM’s (otherwise the huge data volume could not be managed by the DPW) and splitting the DEM’s in different parts (floor, walls and vault). Also it was convenient the conversion of the global reference system into a local photogrammetric system in each part (except the floor part). In the walls, this was a direct reference system with the heights being the Y-axe, X-axe growing to the right and depths (Z-axe) growing to the camera. Each side (east, west, north and south) had its particular local reference system. In the vault, the height was inverted. Also some additional control points (mainly height control points) were derived from the TLS DEM.
Figure 11 shows the orthophotograph and some details on the floor. The extreme parts at the south and north sides were taken with oblique G10 photographs since the Picavet platform was ineffective to take vertical shots there. The image shows large damages in the tiled floor.
2 m
N
1 2
Figure 11. Orthophotograph (1 mm resolution) of the chapel floor. Some details of the tiled floor are shown.
Next, the vault survey is shown in Figure 12. Indeed the orthophotograph of the vault was much difficult to be obtained because the large depth differences and the presence of the ribs and arches. Because lack of definition on some edges of the ribs in the DEM, it was necessary to add breaklines by plotting them in the DPW. The presence of mocarabes and decorations also complicated the edition of the orthoimage.
Orthoimages of the four side walls were obtained at 2 mm resolution. North and south sides were projected at two different planes which comprise the wall and the upper part of the blind arches. Also the tiling skirting board in the north side was obtained. Figure 13 shows the north side including the windows at the vault, a rib and part of the dome projected onto the north plane.
1 m
Figure 12. Left: Vault point cloud as seen from the floor. Right: orthoimage at 1 mm of resolution.
1
2
3 Figure 13. Orthoimage of north side wall. Windows and central
rib (from mosaics of rectified images) are also projected on the north plane. Point cloud from the dome is also projected on top.
3.2 Image rectification of vault ribs and cusped arches
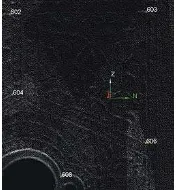
Additionally all side walls of the ribs and arches in the vault were also registered. In this case image rectification was chosen as the main photogrammetric method. Because important workspace constraints restrictions most of ribs were registered with at least 3-4 photographs and mosaics of the rectified images were done. A total of 44 mosaics at the vault level were made. Because impossibility of setting up the total station on the scaffolds, the control point were measured in the laser point cloud in clearly identifiable points. Figure 14 shows the identification of some control points in one arch.
Figure 14. Control points extracted from the point clouds for image rectification.
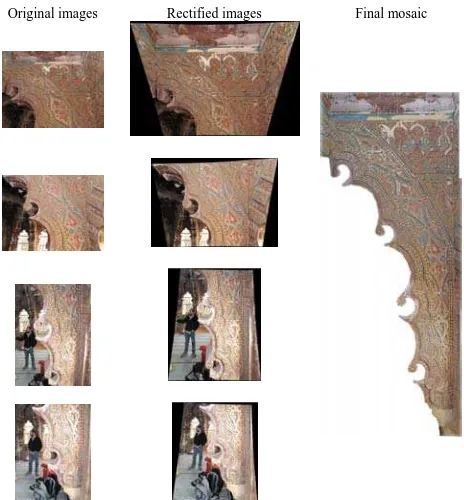
The process of mosaicking rectified images is shown in Figure 15. It is describe an example of an arch in the south part of the wall where the work distance is 1 m because limitations in the workspace. The camera was the Powershot G10. Final resolution in rectified images was 1 mm although accuracy was limited to the rectification plane. Depending of the arch and plane the accuracy was 1-2 cm as average.
Original images Rectified images Final mosaic
Figure 15. Rectification process in ribs and arches at the vault.
4. CONCLUSIONS AND FUTURE WORKS
As conclusion, digital close range photogrammetric and TLS techniques were successfully used for documentation purposes in a diagnostic study in the Royal Chapel of the Cathedral-Mosque of Cordoba, declared by UNESCO as World Heritage Site. Extensive use of non metric images combined with appropriate calibration methods have allowed high resolution image products. In order to obtain accurate orthoimages (resolutions of 1-2 mm) a detailed digital elevation model from a terrestrial laser scanner was used. Both laser and image data were in the same reference system by means of control points surveyed with a reflectorless total station. The TLS point cloud also allowed the measuring of control point for image rectification in non accessible areas (the vault). The image base products have given the cartographic documentation to support the diagnostic analysis for a further restoration work. Additionally, the TLS allowed the construction of a global 3D geometric framework of the whole chapel.
This TLS 3D model is still under exploitation. Next step will be the integration of the orthorectified images and the 3D TLS data in order to obtain a virtual 3D model of the whole chapel. This work is in progress. Also developments of some methods for true-ortho generation and radiometric adjustment are being considered as large problems derived from the complexity of the object (profusely decorated) and illumination problems in the chapel.
REFERENCES
Brown, D.C., 1971. Close-Range Camera Calibration.
Photogrammetric Engineering, vol. 37, No. 8, p. 855-866.
Cardenal, J., Mata, E., Castro, P., Delgado, J., Hernández, M.A., Pérez, J.L. Ramos, M. and Torres, M., 2004. Evaluation of a digital non metric camera (Canon D30) for the photogrammetric recording of historical buildings.
Internacional Archives of Photogrammetry, Remote Sensing and Spatial Information Sciences, Vol. 35(B5), 564-569.
Grussenmeyer, P., Landes, T., Voegtle, T., Ringle, K., 2008. Comparison methods of terrestrial laser scanning, photogrammetry and tacheometry data for recording of cultural heritage buildings. The International Archives of the
Photogrammetry, Remote Sensing and Spatial Information Sciences. Vol. XXXVII (B5), 213-218.
Mozas A, Pérez-García, J.L., Cardenal, J., Mata, E. and Delgado, J., 2012. Method for photogrammetric surveying of archaeological sites with light aerial platforms. Journal of
Archaeological Science, Vol. 39, Issue 2, February 2012, Pages
521-530.
Picavet PL., 1912. Suspension pendulaire elliptique. La Revue
du cerf-volant.
UNESCO-WHC, 1994. Unesco World Heritage List: Historic Centre of Cordoba, Documents.
http://whc.unesco.org/en/list/313/documents/ (11st april 2012).
ACKNOWLEDGEMENTS
The present study has been financed by grant TIN2009-09939 (IFOTEL Project) from the Ministry of Science and Innovation, National Programme R+D+I, 2008-2011, European Regional Development Funds (ERDF-FEDER) and TEP-213 Research Group (PAI, Junta de Andalucía). This work has been carried out in close collaboration with PROTOBA S.L. We acknowledge to ARTELAN for the facilities given for the project development and Kiko Molina (Protoba S.L.) for his support in the TLS data.