CAN SINGLE EMPIRICAL ALGORITHMS ACCURATELY PREDICT INLAND
SHALLOW WATER QUALITY STATUS FROM HIGH RESOLUTION, MULTI-SENSOR,
MULTI-TEMPORAL SATELLITE DATA?
I. Theologou, M. Patelaki, K. Karantzalos
Remote Sensing Laboratory, National Technical University of Athens Heroon Polytechniou 9, 15780 Zographos, Greece
[email protected]; [email protected]; [email protected]
KEY WORDS: Landsat, Reflectance, Earth observation, Monitoring, Environment, Lake
ABSTRACT:
Assessing and monitoring water quality status through timely, cost effective and accurate manner is of fundamental importance for numerous environmental management and policy making purposes. Therefore, there is a current need for validated methodologies which can effectively exploit, in an unsupervised way, the enormous amount of earth observation imaging datasets from various high-resolution satellite multispectral sensors. To this end, many research efforts are based on building concrete relationships and empirical algorithms from concurrent satellite and in-situ data collection campaigns. We have experimented with Landsat 7 and Landsat 8 multi-temporal satellite data, coupled with hyperspectral data from a field spectroradiometer and in-situ ground truth data with several physico-chemical and other key monitoring indicators. All available datasets, covering a 4 years period, in our case study Lake Karla in Greece, were processed and fused under a quantitative evaluation framework. The performed comprehensive analysis posed certain questions regarding the applicability of single empirical models across multi-temporal, multi-sensor datasets towards the accurate prediction of key water quality indicators for shallow inland systems. Single linear regression models didn’t establish concrete relations across multi-temporal, multi-sensor observations. Moreover, the shallower parts of the inland system followed, in accordance with the literature, different regression patterns. Landsat 7 and 8 resulted in quite promising results indicating that from the recreation of the lake and onward consistent per-sensor, per-depth prediction models can be successfully established. The highest rates were for chl-a (r2
=89.80%), dissolved oxygen (r2
=88.53%), conductivity (r2
=88.18%), ammonium (r2
=87.2%) and pH (r2
=86.35%), while the total phosphorus (r2
=70.55%) and nitrates (r2
=55.50%) resulted in lower correlation rates.
1. INTRODUCTION
Water quality is a fundamental aspect of global freshwater resources. Information about water quality is needed to assess baseline conditions and to understand trend for water resource management. Therefore, the importance of evaluating and monitoring water quality in terrestrial reservoirs is clear and self-evident. The most commonly used methodology to examine the quality of water is through in-situ sampling and chemical analysis. In-situ sampling lead to accurate estimations but lacks in several other areas. More specifically:
- In-situ measurements fail to provide the spatial distribution of a phenomenon throughout the water body, since the results correspond to the exact location/region from which the sample was taken.
- Water bodies are usually inaccessible on a regular basis. - In many cases, monitoring one, let alone tens or hundreds of lakes in a region, is a prohibitive process, both financially and logistically.
- The location of the sampling regions usually is not correlated with any phenomena, sensitive regions or management practices.
- Comprehensive monitoring of any crucial phenomena requires a frequent sampling.
To this end, the main advantage of remote sensing technology provides the capability and the required information on a regular basis. Moreover, it provides the means for exploiting information from dates that in-situ sampling was not conducted
(Dekker, Vos, & Peters, 2002, Zheng, Z., Yuanling, 2011). In particular, monitoring the good environmental status through earth observation data is not new but among the first objectives of remote sensing data exploitation (Wrigley and Horne, 1974).
Natural inland waters are optically complex due to the interaction of three main parameters, namely chlorophyll, inorganic suspended solids and dissolved organic matter. The estimation of water concentrations in sensitive shallow systems through the use of multispectral remote sensing imagery can be hindered due to possible errors in consistent correlation. The optical complexity poses many challenges to the accurate retrieval of biogeochemical parameters. The depth of the lake and the aquatic vegetation levels is of significant importance. Many standard chlorophyll-a retrieval algorithms, which are optically dominated by phytoplankton and their breakdown products, tend to fail when applied to more turbid inland and coastal waters whose optically properties are strongly influenced by non-covarying concentrations of non-algal particles and coloured dissolved organic matter (Huang et al., 2015; Palmer et al., 2015; Sass, et al., 2007).
geospatial value-add maps regarding the good environmental statuts of inland systems.
The establishment of relations between in-situ ground truth and earth observation data is usually based on three approaches (Duan and Bastiaanssen, 2015; Giardino et al. 2007, Chen et al. 2008, Alparslan et al., 2007, Hellweger et al, 2007, Tyler et al., 2006, Han et al., 2005, Vincent et al, 2004; Young et al., 2011):
- empirical algorithms, which is based on the creation of a regression models using satellite imagery and water quality parameters,
- semi-empirical approach, which embodies the use of spectral water quality characteristics in the statistical analysis,
- analytical approach, in which key water quality parameters are related to inherent optical properties and therefore to apparent optical properties and top-of-atmosphere radiance.
In this study, we have experimented with multi-temporal Landsat 7 and Landsat 8 high resolution satellite data, coupled with the corresponding hyperspectral data from a field spectroradiometer and in-situ ground truth data with several physico-chemical and key monitoring indicators. All available datasets, covering a 4 years period were processed and fused under a quantitative evaluation framework. The performed comprehensive analysis posed certain questions regarding the applicability of single empirical models across multi-temporal, multi-sensor datasets towards the accurate prediction of key water quality indicators for shallow inland systems. Landsat 7 and 8 resulted in quite promising results indicating that from the recreation of the lake and onward concreate sensor, per-depth prediction models can be successfully established.
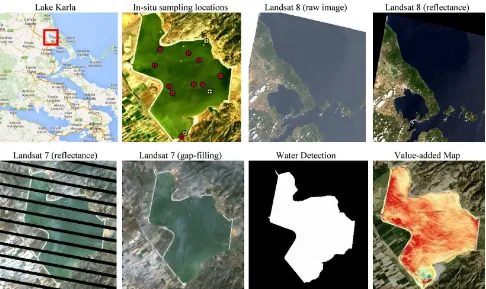
2. MATERIALS AND METHODS 2.1. Study Area
The study area is located in Greece, on the southeast of Larissa, near the northern slopes of Pelion (Figure 1). It was completely desiccated in 1962 as part of a plan to address the flooding of hydrological flow modifications and excessive chemical enrichment (Chamoglou et al. 2014).
The protection, conservation and management of the site was undertaken by the Management Body of Ecodevelopment Area of Karla – Mavrovouni – Kefalovriso – Velestino (E.A.Ka.Ma.Ke.Ve.) which was established in 2003 and conducted frequent water quality sampling until 2013.
2.2. Multi-temporal Remote Sensing Data and Field Campaigns
Multitemporal high resolution satellite data were collected from the recreation of the Lake and onward. In particular, Landsat 7 (L7) and Landsat 8 (L8) data were acquired. Landsat 7 consists of seven spectral bands, from 0.45 to 2.35 micrometers, with spectral resolutions of 0.06-0.20 micrometers and spatial resolution of 30 meters for Bands 1 to 5 and 7. The thermal infrared band has a 60 meter pixel and wavelengths of 10.40-12.50μm. However, the Lake Karla region is heavily affected by
the presence of gaps (approximately 20% of image pixels) in all the corresponding L7 paths and rows (Figure 1). The problem is caused by the early failure of the Scan Line Corrector which compensates for the forward motion of the satellite. In addition, Landsat 8 OLI consists of seven spectral bands with wavelengths from 0.43-2.29μm, spectral resolution from 0.02-0.18μm and spatial resolution of 30m.
In-situ ground-truth sampling data were systematically collected from 2011 an onward from the lake’s Management Body. Among the various field and lab sensors and instruments, the Hach’s HQ40d Portable Multi-Parameter Meter carried out the measurements of the physicochemical parameters, while the quantitative determination of water’s inorganic nutrient compounds and chlorophyll-a’s concentration was performed by applying different determination protocol for each compound, based on standard methods (APHA, 1998) and using the spectrophotometer HACH DR / 3900 (Chamoglou et al. 2014). In-situ hyperspectral reflectance observations were, also, acquired using the GER 1500 (Spectra Vista Corporation, US) portable spectroradiometer which provides spectra with 512 spectral bands distributed in the spectral region from 350nm to 1050nm with 3.2 nm FWHM. The location of every measurement, which was the same with the sampling positions, was recorded using a portable GPS.
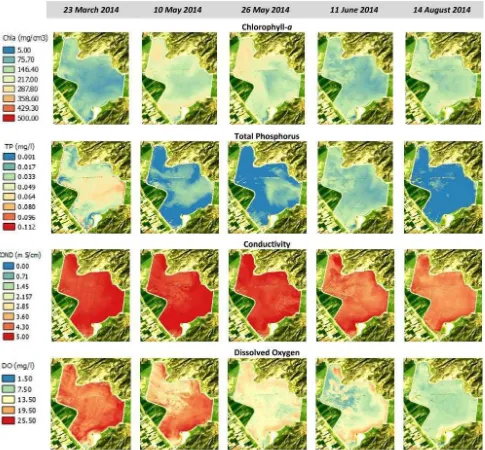
This study is focused mainly on the long term monitoring of the following parameters: chlorophyll-a (mg/lt), NO3 (mg/lt), NH4 (mg/lt), Total Phosphorus (mg/lt), pH, conductivity (mS/cm), Dissolved Oxygen and temperature (Co
). Chlorophyll-a (Chla) is a biological parameter and the necessary pigments used by most photosynthetic organisms for the release of chemical energy. When in vivo form, it exhibits two main absorption maxima positioned at 433nm (blue) and 686 nm (red) of the spectrum (Hunter et al. 2008). The concentration of chl-a is used as an indicator for the description of bioproduction and is linearly related to the biomass, the age of algae communities etc. (Thiemann, et al., 2000).
Dissolved Oxygen (D.O.) is an important physical and chemical parameter which is used by most organisms for respiration and oxidation of organic substances. It primarily originates in the water from the atmosphere, through the phenomenon of diffusion, and secondarily due to the photosynthesis of aquatic flora. It has a seasonal and daily circle. PH is a physico-chemical parameter expressing the negative decimal logarithm of the hydrogen ion, in particular of hydronium (H3O+) in a solution. As most aquatic organisms survive in a relatively small pH range, the parameter is an indicator of the existence of life.
Conductivity is physico-chemical parameter that expresses the ability of the water body to allow the passage of electric current, and gives the total content of water in minerals. Conductivity values are influenced by ion concentration, mobility and electric charge, as well as water temperature. Total Phosphorus (TP) is the sum of the organic and inorganic phosphorus, dissolved or in the form of particles. It is affected by temperature, pH, nitrate and ammonium ions etc. and is usually the limiting factor of
2.3. Pre-processing Procedures and Multitemporal Reflectance
Radiometric and atmospheric corrections were performed on the satellite imagery towards the elimination of solar illumination, atmospheric and terrain effects. Digital numbers were converted to top-of-atmosphere reflectance using the absolute radiometric calibration factors and effective bandwidths for each band. Atmospheric correction was then conducted through ATCOR2 and MODTRAN4 for calculating a radiative transfer model for atmospheric transmittance, direct and diffuse solar flux, and path radiance. Several parameters were employed like the aerosol model, as well as satellite and sun geometry information including the satellite inclination, sun azimuth and zenith.
2.4. Relationships between Reflectance and Concentrations Several empirical regression models were evaluated in order to study and establish consistent relationships between the concentrations of the water quality parameters and the satellite reflectance values.
Several experiments were performed in order to evaluate the potential of establishing relationships between multi-temporal and multi-sensor data. The time difference between the sampling date and the acquisition of the satellite image was up to three days maximum. Three models were developed and evaluated. One containing in-situ sampling locations from the relatively deep parts of the lake, the second containing sampling data from the very shallow parts of the lake and the third
including all in-situ sampling data from all lake depths. From every model, linear regression equations were computed for about 140 combinations of Landsat 8 spectral bands and for about 120 combinations of Landsat 7 spectral.
Moreover, concurrent reflectance hyperspectral data from a field spectroradiometer were calculated. These observations were, also, correlated with both the in-situ ground truth and the satellite images. About 120 band ratios and indices were computed and tested.
The overall analysis and comprehensive evaluation posed certain questions regarding the applicability of single empirical models across multi-temporal, multi-sensor datasets. In accordance with the literature, in all cases there wasn’t a single linear regression model which could establish concrete relations across multi-temporal, multi-sensor datasets. In particular, only the first model managed to provide high correlations for several water quality indicators for such a shallow and sensitive inland system. The shallower parts of the inland system followed different regression patterns, however a consistent empirical model couldn’t be established.
On the contrary, the first model provided quite promising results for most of the examined water quality indicators. The highest correlation rates regarding the hyperspectral reflectance from the field spectroradiometer were for chl-a (r2
=97.6%), ammonium (r2
=88.5%), nitrates (r2
=85.7%), conductivity (r2
=81.7%) and dissolved oxygen (r2
=81.9%).
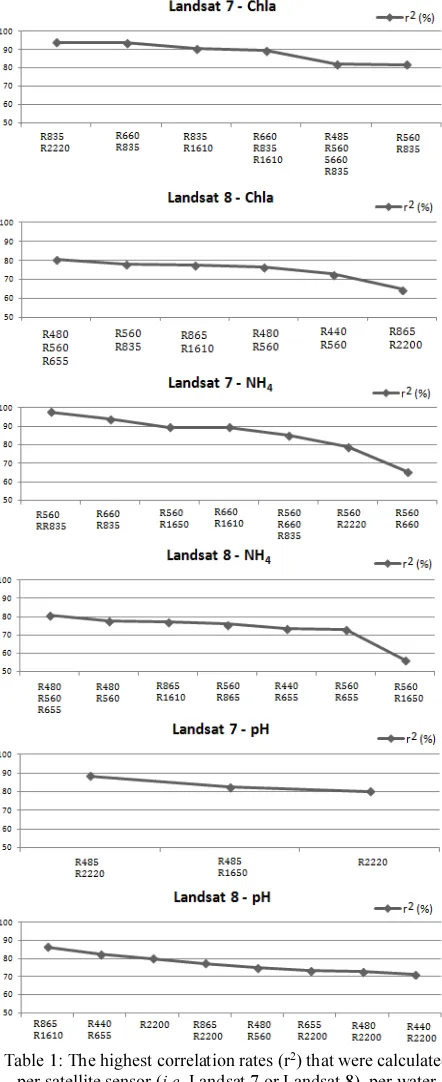
Regarding the satellite datasets a number of band ratios, indices and equations established relationships with correlation rates. In Table 1, the highest correlation rates (r2
) that were calculated per satellite sensor (i.e, Landsat 7 or Landsat 8), per water quality indicator (i.e, pH, Chla, etc) and per spectral band combination (e.g., ratio) are shown. Regarding chlorophyll-a the highest rates were calculated for the EXP(R835/R2220),
EXP(R835/R660), EXP(R835/R1650), R835/R660,
(R835/R660)+R1650, R835/R2220, R835/(R485+R560+R660), EXP(R835/R560), LnR660-LnR835 formulas and for Landsat 7. However, the R835/R660 was selected as was most simple and included bands that seemed to correlated more with chla. For Landsat 8, the higher rates were for the (R480-R655)/R560, R560-R865, EXP(R865/R1610), R480-R560, R560-R480, R440-R560, R560-R440, R560-R655 formulas and the selected of the same reasons was the R480-R560. For both sensors the R835, R660 and R560 spectral bands (and their neighbours) were involved in most high correlated models.
Regarding NH4 concentrations, the high rates for Landsat 7 were the EXP(R600/R835), R600/R835, EXP(R660/R835), EXP(R600/R1650), EXP(R660/R1650), (R600-R835)/R660, EXP(R600/R2220), R660/R835 and R600-R835 formulas, while the one employed was the R600/R835. Regarding Landsat 8, the highest rates were for the (R655)/R560, R480-R560, R560-R480, EXP(R865/R1690), R560-R865, R440-R560, R560-R440, R560-R655, R480/R2200 formulas. The first one was employed for calculating the corresponding maps. For both sensors the R560, R835 and R660 spectral bands (and their neighbours) were involved in most high correlated models.
Regarding the pH parameter, for Landsat 7 the highest rates were for the LnR485-LnR2220, R485-R2220, R485/R2220, R485-R1650, EXP(R2220), R2220, LnR2220 and EXP(R485/R2220) formulas, while for Landsat 8 the highest correlations were for the LnR865-LnB6, R865/R1690, R440-R560, R560-R440, R865/R2200, R480-R440-R560, R560-R480, R655/R2200, R480/R2200 and LnR440-LnR2200. For both sensors the R485 and R2200 spectral bands (and their neighbours) were involved in most high correlated models.
3. EXPERIMENTAL RESULTS AND VALIDATION Regarding the evaluation of the employed empirical algorithms the overall validation indicated that several water quality indicators could quite accurately estimated through high resolution multispectral data. In particular, the highest rates were for chl-a (r2
=89.80%), dissolved oxygen (r2
=88.53%), conductivity (r2
=88.18%), ammonium (r2
=87.2%) and pH (r2
=86.35%), while the total phosphorus (r2
=70.55%) and nitrates (r2
=55.50%) resulted in lower correlation rates.
Note that algorithms which included the EXP form, while in many cases provided high correlations, proved to be sensitive and unable to estimate correctly the corresponding parameters especially in images with a certain cloud cover. In particular, images with important cloud cover had to be excluded due to certain inaccurate reflectance calculations and relative radiometric calibration.
Experimental results regarding chla concentrations demonstrated quite promising correlations i.e, for L7 [r2
=89.80%, (R835/R660)] and L8 [r2
=76.65%, (R480-R565)]. These quantitative results were also verified from the performed
comparison between the delivered maps from L7 and L8 for close dates. In particular, the two sensors and the employed per-sensor model estimated the same concentration levels when only one day temporal difference. Few higher differences were calculated in the quite shallow parts of the lake. In general, when comparing with the in-situ ground truth data the calculated chla levels were slightly overestimated with L7 data and slightly underestimated with L8 data.
Table 1: The highest correlation rates (r2
) that were calculated per satellite sensor (i.e, Landsat 7 or Landsat 8), per water quality indicator (i.e, pH, Chla, etc) and per spectral band
combination (e.g., ratio).
Regarding the DO estimation the experimental results indicated high correlation rates i.e, [r2
= 88.53%, (R560+660)/2 for L7 and r2
=80.49%, (R480/R655) for L8]. This was also confirmed by the comparative analysis between the two sensors for maps of closing dates. The conductivity was estimated, also, for both sensors with high rates [r2
=66.02%, (R485-R835)/(R660-R835) for L7 and r2
=88.18%, (R480-R655)/R560 for L8].
Moreover, regarding the estimation of NH4 concentrations high correlations were established [r2
=94.32%, (R560/R835) for L7 and r2
=80.64%, (R480-R655)/R560 for L8] by the regression models. However, when all the multi-temporal maps were computed for all the acquired data for the 4 years period, some negative values where calculated indicating that the established relation was sensitive to certain optical variations.
The pH parameter was estimated, also, with high correlation rates [r2
=82.46%, (R485/R2220] for L7 and r2
=86.35%,
(R865/R1610)] and delivered consistent and stable maps across the multi-temporal dataset.
The TP and NO3 parameters were calculated with lower rates than the aforementioned ones. In particular, the TP was estimated with a higher rate r2
=70.55% (R660/R835) for the L7 datastes and with a lower one r2
=50.82% (R560-R1610) for L8. For the estimation of NO3 concentrations the calculated correlation was at r2
=55.50% (R835/R2220) for L7 and r2
=55.50% (LnR1610-Ln2200) for L8.
while the models were constructed using genetic algorithms,
multilinear regressionwith correlations ranged from r2
=0.58 to 0.95 (Chen et al. 2008,, Alparslan et al., 2007, Hellweger et al, 2007, Tyler et al., 2006, Han et al., 2005, Vincent et al, 2004).
4. CONCLUSIONS
We have experimented with Landsat 7 and Landsat 8 multi-temporal satellite data, coupled with hyperspectral data from a field spectroradiometer and in-situ ground truth data with several physico-chemical and other key monitoring indicators. All available datasets, covering a 4 years period, in our case study Lake Karla in Greece, were processed and fused under a quantitative evaluation framework. The performed comprehend-sive analysis posed certain questions regarding the applicability of single empirical models across multi-temporal, multi-sensor datasets towards the accurate prediction of key water quality indicators for shallow inland systems. Landsat 7 and 8 resulted in quite promising results indicating that from the recreation of the lake and onward concrete per-sensor, per-depth prediction models can be successfully established. The highest rates were
=55.50%) resulted in lower correlation rates.
ACKNOWLEDGEMENTS
The in-situ ground truth data employed in this study were provided by the Management Body of Ecodevelopment Area of Karla-Mavrovouni-Kefalovriso-Velestino (E.A.Ka.Ma.Ke.Ve.). We would like to thank Dr. I. Kagalou, Dr. M. Chamoglou and Dr. M. Papadopoulou for their significant contribution.
REFERENCES
Alparslan, E., Aydoner, C., Tufekci, V. And Tufekci, H., 2007. Water Quality Assessment at Omerli Dam Using Remote Sensing Techniques. Environmental Monitoring and Assessment, 135, pp. 391–398.
Chamoglou M., Papadimitriou T., Kagalou I., 2014. Key-Descriptors for the Functioning of a Mediterranean Reservoir: The Case of the New Lake Karla-Greece. Environmental Process, 1, pp 127-135.
Chen, L., Tan, C.H., Kao, S.J., and Wang, T.S., 2008. Improvement of remote monitoring on water quality in a subtropical reservoir by incorporating grammatical evolution with parallel genetic algorithms into satellite imagery. Water Research, 42, pp. 296–306.
Dekker, A., Vos, R., Peters, S., 2002. Analytical algorithms for lake water TSM estimation for retrospective analyses of TM and SPOT sensor data. International Journal of Remote Sensing, 23(1), 15–35.
Duan Z., Bastiaanssen, W.G.M., 2015. A new empirical procedure for estimating intra-annual heat storage changes in lakes and reservoirs: Review and analysis of 22 lakes, Remote Sensing of Environment, 156, pp 143-156.
Han, L., Jordan, K., 2005. Estimating and mapping chlorophyll a concentration in Pensacola Bay, Florida using Landsat ETM T. 2008. Spectral discrimination of phytoplankton colour groups: The effect of suspended particulate matter and sensor spectral resolution. Remote Sensing of Environment. 112 (4), pp. 1527-1544.
Sass, G.Z., Creed, I.F., Bayley, S.E., Devito, K.J., 2007. Understanding variation in trophic status of lakes on the Boreal Plain: A 20 year retrospective using Landsat TM imagery.
Remote Sensing of Environment. 109 (2), pp. 127-141.
Shiklomanov, I., 1993. Water in Crisis: A Guide to the World's Fresh Water Resources, (edit) Peter H. G., New York : Oxford University Press.
Simis, S.G.H., Peters, S.W.M., Gons, H.J., 2005. Remote sensing of the cyanobacterial pigment phycocyanin in turbid inland water. Limnology and Oceanography, 50, pp. 237–245.
Thiemann, S., Kaufmann, H., 2000. Determination of Chlorophyll Content and Trophic State of Lakes Using Field Spectrometer and IRS-1C Satellite Data in the Mecklenburg Lake District, Germany. Remote Sensing of Environment. 73 (2), pp. 227-235.
Tyler, A.N., Svab, E., Preston, T., Présing, M. Kovács, W.A., 2006. Remote Sensing of the water quality of shallow lakes: a mixture modelling approach to quantifying phytoplankton in water characterized by high-suspended sediment. International Journal of Remote Sensing, 27, pp. 1521–1537.
Vincent, R.K., Qin, X.M., Mckay, R.M.L., Miner, J., eutrophication. Nature, 250, pp. 213-214.
Zheng, Z., Yuanling, Z., 2011. Research on the Water Quality Monitoring System for Inland Lakes based on Remote Sensing,
Procedia Environmental Sciences, 10, pp. 1707-1711.
Changchun, H., Kun, S., Hao, Y., Yunme,i L., A-xing, Z., Deyong, S., Liangjiang, X., Jun, Z., Xia, C., 2015, Satellite observation of hourly dynamic characteristics of algae with Geostationary Ocean Color Imager (GOCI) data in Lake Taihu,
Remote Sensing of Environment, 159, pp. 278-287.
Palmer, S. C. J., Hunter, P. D. , Lankester, T., Hubbard, S., Spyrakos, E., Tyler, A. N., Présing, M., Horváth, H., Lamb, A., Balzter, H., Tóth, V. R., 2015. Validation of Envisat MERIS algorithms for chlorophyll retrieval in a large, turbid and optically-complex shallow lake, Remote Sensing of Environment, 157, pp. 158-169.
Young, D. J., Winter, G. J., Molot, L., 2011. A re-evaluation of the empirical relationships connecting dissolved oxygen and phosphorus loading after dreissenid mussel invasion in Lake Simcoe, Journal of Great Lakes Research, 37, pp. 7-14. The International Archives of the Photogrammetry, Remote Sensing and Spatial Information Sciences, Volume XL-7/W3, 2015