Wheat demand in Japanese flour milling industry:
a production theory approach
Won W. Koo
∗,1, Weining Mao
2, Takeshi Sakurai
3North Dakota State University, Department of Agricultural Economics, P.O. Box 5636, Fargo, ND 58105-5636, USA
Received 1 September 1998; received in revised form 11 February 2000; accepted 24 February 2000
Abstract
A production approach based on the translog cost function is used to analyze import demand for wheat differentiated by class and country of origin in the Japanese wheat flour milling industry. Results indicate that US wheat faces strong competition in the Japanese wheat market, but its multiple classes and end-use characteristics enable the US to preserve the largest market share in Japan. © 2001 Elsevier Science B.V. All rights reserved.
Keywords: Import demand; Japan; Wheat; Production theory; Translog cost function
1. Introduction
Japan is one of the largest wheat importing coun-tries in the world, accounting for about 6% of world total wheat imports in the early 1990s (International Grains Council, 1989–1994). Japanese wheat imports include both food wheat and feed wheat.4 The US, Canada, and Australia are suppliers to the Japanese wheat import market, with 57.7, 23.5, and 18.8% of
∗Corresponding author. Tel.:+1-701-231-7448; fax:+1-701-231-7400.
E-mail address: [email protected] (W.W. Koo). 1Won W. Koo is Professor of Agricultural Economics at North
Dakota State University.
2Weining Mao is an economist at American Express. He was a
postdoctoral research associate in the Department of Agricultural Economics at North Dakota State University when this study was conducted.
3Takeshi Sakurai is a senior economist at the National Research
Institute of Agricultural Economics of the Ministry of Agriculture, Forestry, and Fisheries, Japan.
4Food wheat is used to produce various types of food products
and feed wheat is used to feed animals.
market share, respectively, in 1998. Japanese domes-tic production only accounted for about 8% of its total wheat supply in 1998 (USDA PS&D, 1994).
Japanese wheat and wheat flour imports have been controlled by the Japanese Food Agency (JFA).5 The JFA determines the quotas on wheat imports each year in consultation with private milling companies and wheat trading companies. Each miller prepares a re-quest for quantities of various classes of wheat. The wheat trading companies licensed by the JFA import wheat at world prices and sell the wheat to the JFA (Love and Murningtyas, 1992). The JFA then resells the imported wheat to domestic flour and bran millers at higher prices.
The Japanese government has been using the sys-tem of import quotas. It also sets high resale do-mestic prices to protect and to subsidize its dodo-mestic wheat production, which was about 15% of domestic consumption in 1993 (Japanese Ministry of
Agricul-5 The JFA also purchases domestic wheat from farmers and sells
domestic wheat to millers. 0169-5150/01/$ – see front matter © 2001 Elsevier Science B.V. All rights reserved.
ture Forestry and Fisheries, 1955–1995). Japan agreed to convert quotas to tariff rate-quotas (TRQ) under the Uruguay Round Agreement for the 1995–2000 period. Thus, wheat and wheat flour above the quota limit could be imported if the tariffs in the TRQ sys-tem are paid. However, wheat and wheat flour im-ports could be under the quota limit until 2000 or even longer, mainly because the tariffs in the TRQ system are not low enough to make wheat imports competitive.
Wheat is not considered to be a consumer-ready food product, but is mainly used by flour millers to produce wheat flour. Wheat flour is used by food man-ufacturers around the world to make bread, noodles, pasta, cake, couscous, and other wheat products. Noo-dles and bread are the favorite wheat products for Japanese consumers. Japan imports different classes of wheat (e.g. hard red winter (HRW), hard red spring (HRS), soft, white and durum) from different import sources, mainly the US, Canada, and Australia. Japan also imports a small amount of low quality wheat to feed directly to animals or to be processed for feed use by bran millers. Due to the difficulties in defin-ing feed wheat and in obtaindefin-ing data, most studies on international wheat trade do not separate trade for food wheat from that for feed wheat. Only a study by
Fig. 1. Shares of food wheat to total wheat in Japanese wheat imports by country.
Riley et al. (1994) provided a market analysis for world feed wheat trade.
Historically, food wheat accounts for about 80% of the Japanese total wheat imports (Food Control Statistical Yearbook, JFA, 1967–1994). Fig. 1 shows the shares of food wheat to total wheat in Japanese wheat imports by exporting country from 1983 to 1994. Japanese feed wheat imports are mainly from Australia and the US. Only small amounts of feed wheat are imported from Canada, mainly because Canadian wheat has fine baking quality associated with high protein. There are separate quotas for food wheat and feed wheat imports in Japan. Therefore, in estimating Japanese import demand for food wheat, it is appropriate to separate Japanese food wheat im-ports from all wheat imim-ports and to treat food wheat as an input in wheat flour production.
The objective of this study is to estimate the Japanese demand for food wheat differentiated by class and country of origin in the Japanese milling industry. Conditional demand for each wheat class is derived from a multiple output multiple input translog cost function for the Japanese flour milling industry.
production theory. However, most previous studies used traditional approaches based on consumer de-mand theory. Capel and Rigaux (1974), Greenshields (1986), and Gallagher et al. (1981) used the direct demand and market share models to analyze wheat import demand under an assumption of different wheat classes in import markets. Some studies used the Armington model to analyze trade flows of wheat between importing and exporting countries by differ-entiating wheat by country of origin and other studies used the almost ideal demand system (AIDS) and the Rotterdam demand model to analyze import de-mand for wheat classes (Henning, 1986; Alston et al., 1990). Davis and Jensen (1994) argued that a pro-duction approach is conceptually more plausible than utility-based demand models in estimating demand for agricultural commodities used as inputs in the processing industry, but it is not an empirical panacea. They concluded that the bridge between theory and empirics is stronger for the production approach than the utility maximization approach.
Unlike previous studies in estimating import de-mand for wheat, our study focuses on estimation of Japanese demand for imported wheat at the industrial level using a production approach. Since the JFA im-ports wheat for the Japanese wheat flour milling in-dustry, it is important to estimate Japanese demand for wheat to analyze the industry’s consumption be-havior for different classes of wheat imported from different import sources. The JFA imports wheat at world prices from exporting countries through its trad-ing companies and resells the wheat to its wheat flour millers. Although the JFA imports wheat based on wheat flour industry’s request for quantities of various classes of wheat, the JFA’s import decision is influ-enced by Japanese trade and agricultural policies and its import behavior differs, to some extent, from the industry’s response to prices of different wheat classes. This study applied a dual translog cost function to derive wheat demand for imported wheat in the Japanese flour milling industry. Imported wheat dif-ferentiated by class and country of origin are treated as inputs, along with domestic wheat, labor, capital and other inputs, to produce wheat flour. Duality pro-vides a convenient approach to identify substitutability between wheat classes and to measure effects of price changes on import demand for wheat classes in the Japanese flour milling industry.
2. Structure of the Japanese wheat milling industry
Although, rice has been the most important staple food in Japan, noodles made from wheat flour are also an important food item. It is considered that wheat cultivation was brought into Japan during fourth or fifth century (Isayama, 1982). However, wheat flour products became one of the staple foods in Japan after World War II, mainly because of the avail-ability of cheap imported wheat from USA and the diversification of the Japanese diet into bread, cake, Chinese noodles, spaghetti and instant noodles. This diversified diet demanded foreign wheat since domes-tically grown wheat is not suitable for making those non-traditional flour products.
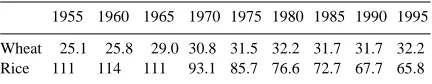
Wheat flour consumption per capita increased until the mid-1970s and since then has been relatively stable (Table 1). Total consumption of wheat flour has been growing at the rate of population growth for the last two decades. The trend of wheat flour consumption contrasts the case of rice consumption, which has been constantly declining since the 1960s (Table 1).
Both imported and domestic wheat sales in Japan have been controlled by the government through the JFA. Flour millers purchase wheat from the JFA at the pre-announced prices, process it, and sell wheat flour in the domestic market to food processing companies and households. The JFA monopolizes the Japanese wheat market, but its net revenues are used to pay costs of the domestic wheat subsidy program (Love and Murningtyas, 1992).
The number of millers decreased from 434 in 1965 to 180 in 1995. Many small inland mills were closed between 1965 and 1975. In this period domestic wheat production declined because the government purchase price of domestic wheat did not cover the produc-tion cost for the average producers (Yokoyama, 1993).
Table 1
Wheat and rice consumption per capita (kg/year)a
1955 1960 1965 1970 1975 1980 1985 1990 1995 Wheat 25.1 25.8 29.0 30.8 31.5 32.2 31.7 31.7 32.2 Rice 111 114 111 93.1 85.7 76.6 72.7 67.7 65.8
aSource: Ministry of Agriculture, Forestry and Fisheries.
Table 2
Structural change in Japanese wheat flour industrya
1965 1970 1975 1980 1985 1990 1995
Number of mills 434 343 225 220 207 193 180
Total number of employers 11785 11170 7682 7001 6269 5381 4745
Flour production (1000 ton/year) 2977 3402 3996 4184 4425 4652 4947
Flour production per employer (kg/year) 253 304 520 598 705 742 1041
Percentage of domestic wheat in total wheat processed 9.3 8.0 2.9 8.1 11.4 13.2 7.1 Real wage index of food processing industry (100 in 1995) 46.2 65.7 89.5 91.6 89.6 103.5 100
aSource: Japanese Food Agency. Wheat flour and feed processors: current situations. Tokyo: various issues, 1965–1995.
On the other hand, the number of large-scale mills increased at the same time period. They are located at ports to process imported wheat. Since large mills are generally more efficient than small mills, labor pro-ductivity in the milling industry has improved signif-icantly (Table 2).
Domestic wheat production increased since 1973 because of high international wheat prices in early 1970s and government subsidies for wheat production to implement the rice acreage reduction program. Do-mestic wheat production decreased again since 1990 as a result of cutbacks in the rice land diversion target. During the 20-year period between 1975 and 1995, the number of mills and total number of workers em-ployed in the milling industry decreased constantly (Table 2) and consequently, average size of mills increased (Table 3) with further increases in labor productivity. The efficiency gain in this period can be explained by competition in the domestic flour market. The competition was not only among millers, but also with imported processed products of wheat flour. Only 29.7% of total number of mills are smaller than 50 tons of daily capacity in 1995, while 29.1% of them are more than 200 tons of daily capacity. In
Table 3
Distribution of mills (categorized by daily ability to process)a
Capacity 1965 1970 1975 1980 1985 1990 1995 Less than 50 ton (%) 70.7 51.9 46.6 40.1 34.2 31.2 29.7 50–100 ton (%) 17.3 17.2 13.8 11.2 10.9 11.8 10.2 100–150 ton (%) 7.1 14.9 13.8 17.8 17.9 17.1 18.4 150–200 ton (%) 2.1 4.4 6.7 6.6 9.2 11.8 12.7 Above 200 ton (%) 2.8 11.7 19.1 24.4 27.7 28.2 29.1
aPercentages are based on the number of mills for each size
category. Source: Japanese Food Agency. Wheat flour and feed processors: current situations. Tokyo: various issues, 1965–1995.
terms of annual flour production, however, the share of the former mills is only 0.2% and that of the latter mills is 85.2% (JFA, 1967–1995). Those small mills are surviving because they typically specialize in pro-ducing specific types of flour from domestic wheat, and sometimes millers themselves are secondary pro-cessors who produce final products from their flour.
In December 1994, the GATT agreement became effective. As a part of the agreement, Japan accepted to import a minimum access of 5566 thousand tons of wheat (including processed products except for the wheat equivalent of imported wheat flour) in 1995, and agreed to increase it to 5740 thousand tons in 2000. Once the quota levels are met, additional wheat can be imported directly by millers after paying the ap-propriate tariffs. In 1995, the amount of the tariff was set at 63U/kg, and that level is scheduled to decrease to 55U/kg by 2000.
However, the Japanese milling industry may not im-port more than its minimum access mainly because the tariff rate was set too high to import wheat privately. In addition, the imported wheat under the minimum access commitments did not directly affect domestic production since the import commitments are much smaller than domestic demand for wheat.
3. Model specification
A translog specification is used to represent the cost function of the Japanese flour milling industry. The translog cost function is well-known for its flexible functional form in terms of the local-order approxi-mation to any arbitrary functional form.
Following Ray’s specification Ray (1982), a
wheat flour production can be written as
of input i (j). The translog cost function is positive, symmetric, and linearly homogeneous in input prices. The restrictions on parameters imply that
λrs =λsr, δij=δji,
Given the level of output under the assumption of perfect competition in the factor market, the cost min-imizing input demand functions can be simply derived by differentiation of the cost function according to Shephard’s lemma:
input demand function can be expressed in a share form as
where xi is the quantity of input i used in the
produc-tion process.
With the assumption of marginal cost pricing for the outputs under perfect competition, we obtain the following relationship for each output r
∂lnC
This leads to the revenue share equations
yr =
Following Uzawa, the Allen partial elasticities of substitution (AES) Allen (1938) can be calculated from the cost share function as
σij=
The price elasticities of conditional demand for indi-vidual inputs can be obtained as
εij =
The Japanese milling industry mainly produces three types of wheat flour: weak, standard and strong flour. Different classes of wheat used by the Japanese millers are domestic soft wheat, US soft wheat, US semi-hard wheat, US hard wheat, Canadian hard wheat and Australian soft wheat.6 Because durum wheat imports account for only 1.3% of the Japanese wheat imports in value, durum wheat was not included in this study. The other input variable included in this study is labor.7
6 Based on the classification system used by the Japanese Food
Agency, the imported food wheats are classified into five categories as follows: (1) US soft (WW), (2) US semi-Hard (HRW, 11.5% protein), (3) US hard (HRW, 13% protein; HRS, 14% protein), (4) Canadian hard (CWRS, 13.5% protein) and (5) Australian soft (ASW).
7 Capital, energy and labor are additional aggregate inputs,
A 7-input-3-output translog cost function for the Japanese flour milling industry was specified in this study. Cost share equations (Eq. (3)) and rev-enue share equation (Eq. (5)) were derived from the translog cost function. The parameters of the equa-tions were estimated with time series data from 1968 to 1997. The Allen partial elasticities of substitution and price elasticities of demand for different wheat classes were calculated from the estimated structural parameters.
4. Data descriptions and estimation procedure
Annual time series data from 1967 to 1997 were used in this study. All price and quantity data for do-mestic and foreign wheat were from the Food Con-trol Statistical Yearbook (JFA, 1967–1994). Data on prices of three wheat flour classes were also taken from the same source. The number of workers em-ployed in the Japanese milling industry and the output quantities of wheat flour by class was collected from the Wheat Flour and Feed Processors: Current Situ-ations (JFA, 1967–1995). The wage index of work-ers in the Japanese food industry was obtained from the Japanese Statistical Yearbook (Statistics Bureau of Japan, 1967–1998).
Japanese flour millers purchase domestic and for-eign wheat classes used for wheat flour production from the JFA. The prices of domestic and foreign wheat paid by millers were used as input prices in wheat flour production, while the wholesale prices of wheat flour were used as output prices.
Adding the error term ei to Eqs. (3) and (5)
re-sults in a system of cost and revenue share equations for the Japanese wheat flour industry. This system was first estimated with the symmetry and linear ho-mogeneity restrictions imposed. Since the sum of the
Sis is equal to unity, the cost share equation for
la-bor (S7) was dropped to ensure the non-singularity of the disturbance covariance matrix, and the price of la-bor was used as the numèraire. The remaining system was estimated using Zellner’s iterative seemingly un-related regression (ISUR) Zellner (1962) with param-eter restrictions. The paramparam-eters associated with the dropped cost share equation were derived from the re-lationships with the estimated parameters. However, the resulting cost share functions failed to be
con-cave for some observations of the data. To ensure the concavity restrictions implied by microeconomic the-ory, the Wiley et al. (1973) re-parameterization proce-dure outlined by Kohli (1991) was used in the model estimation. The global concavity was ensured by im-posing the concavity restrictions in 1990. This was done by re-estimating the model with input prices and output quantities normalized for 1990. Because of the reparameterization, the model becomes nonlinear in the parameters. The nonlinear system of cost and rev-enue share equations with the concavity restriction im-posed was estimated using the nonlinear seemingly unrelated regression procedure from the SHAZAM, Version 7.0 (White, 1993).
After estimating coefficients of the nonlinear system of cost and revenue share equations, point estimates for the structural coefficients were estimated using Monte Carlo integration as illus-trated by Chalfan et al. (1991). With the consistent coefficient estimates and variance-covariance matrix from Zellner’s ISUR procedure, a random generator was employed to obtain a random sample for this multivariate normal distribution. From each draw for the parameter vector of the nonlinear system of cost and revenue share equations, the structural param-eters were estimated, and the Allen elasticities of substitution and the price elasticities of the import demand were derived by wheat class and by origin of exporting country. The mean values of the derived parameters and elasticities of total draws became the estimated structural parameters and elasticities. The asymptotic standard errors were also obtained from the Monte Carlo integration through the standard statistical procedure.
5. Empirical results
Table 4 presents the estimated coefficient of cost and revenue share equations. Most of the estimated parameters (53 of 87) are significant at the 5% level. Own price variables have negative sign as expected on the basis of economic theory and are significant at the 5% level in all cost share equations except for the labor equation, indicating that the Japanese milling industry is sensitive to prices of wheat classes.
signif-icant at the 5% level. The positive signs of the AES indicate substitute relationships between any pairs of wheat classes. Strong substitution suggests a high level of competition. The negative signs of the off-diagonal AES imply complementary relationships between any pairs of wheat classes. This could be mainly because Japanese millers blend different classes of wheat for many different types of wheat flour production. The AES between any pairs of soft wheats (Japanese soft, US soft, and Australian soft) are positive, indicat-ing that they compete in the Japanese millindicat-ing indus-try. However, the AES between soft and hard wheats are negative, indicating that they are complementary to some extent. The AES between any pairs of hard wheats (US hard, US semi-hard, and Canadian hard) positive, indicating that they are competing in the Japanese milling industry.
Table 6 present price and cross price elasticities of demand for wheat classes and labor. The elasticities es-timated in this study are much more elastic than those estimated by Wilson (1994) and Lee et al. (1994). This is mainly because (1) this study used a produc-tion theory approach by treating wheat as an input in the Japanese milling industry, while Wilson (1994) and Lee et al. (1994) used a translog demand system and the AIDS, respectively, by treating wheat as a consumer good and (2) this study focused on demand for different wheat classes in the Japanese milling in-dustry, while the other studies analyzed Japanese im-port demand for different wheat classes from foreign sources.
Own-price elasticities are elastic for all the wheat classes, but the demands for imported soft wheat classes are less elastic than all the hard wheat classes and Japanese soft wheat. These relationships also re-flect the substitutability between wheat classes; US and Canadian hard wheat can be substituted for each other, but other wheat classes are less substitutable. Calculated own price elasticities range between−7.86 for demand equation for US semi-hard wheat and −3.23 for Australian soft wheat. The own price elas-ticity of labor is −0.97. These elasticities clearly indicate that the Japanese milling industry is very sensitive to prices of wheat classes, but not sensitive to labor costs, mainly because substitutes for labor are limited in the industry.
Both Japanese and US soft wheat have a negative relationship with US and/or Canadian hard wheat in
Japanese wheat flour production, indicating that the soft and hard wheats are complements. However, the complementary relationship is not significant at the 5% level. Soft wheat is seldom blended with hard wheat and has different uses. US and Canadian hard wheat is primarily used to produce bread, while Japanese and US soft wheat are used to produce Chinese style noo-dle, cookies and cakes. On the other hand, Japanese and US soft wheat have a positive relationship with US semi-hard and Australian soft wheat in the Japanese milling industry, indicating that they compete with each other. However, the substitution elasticity be-tween Japanese soft and Australian soft wheat is not significant. These two wheat types are very similar and are often mixed to produce Chinese style noo-dles. Thus, they are to some extent complements, but also compete with each other. This relationship de-pends upon supply conditions for domestic soft wheat. When supply of the domestic wheat is short, they are complements, but when supply is sufficient, they compete.
US hard and semi-hard wheats compete with Cana-dian hard wheat in the Japanese wheat flour milling industry. However, the competitive relationship be-tween Canadian hard and US hard wheat is stronger than that between Canadian hard and US semi-hard wheat, mainly because semi-hard wheat is not a per-fect substitute for hard wheat. US hard and semi-hard also compete with each other, but the relationship is not significant at the 5% level due to imperfect substi-tutability. The negative significant elasticities between Australian soft and US semi-hard wheat indicate that they are blended together in the Japanese milling in-dustry.
Cross price elasticities presented in Table 6 are con-sistent with AES in Table 5. In general, cross elastic-ities between hard wheat classes (e.g. US hard wheat, US semi-hard wheat and Canadian hard wheat) and those between soft wheat classes (e.g. US soft, Aus-tralian soft, and Japanese soft) are elastic, while those between hard and soft wheat classes are inelastic. This is because similar wheat classes compete with each other, while different classes are to some extent com-plements.
with Japanese soft wheat, but other wheat classes pro-duced in the US are complementary with Japanese soft wheat. In general, US wheat exports to Japan benefit from the existence of multiple classes and multiple end-use characteristics. If Japan liberalizes its do-mestic wheat market, the milling industry would use more imported wheat instead of domestic soft wheat because prices of domestic wheat is higher than those of imported wheat. US market share of soft wheat could increase faster than other wheat classes since US soft wheat is a good substitute for Japanese soft wheat.
6. Summary and conclusions
This study applied a multiple output and multi-ple input translog cost function for the Japanese flour milling industry to analyze Japanese demand for food wheat. Unlike previous studies, Japanese demand for food wheat was separated from that for feed wheat be-cause the JFA sets up separate quotas for food wheat and feed wheat imports. Wheat is considered as an in-put in Japanese wheat flour production. A production theory approach was used to derive Japanese demands for imported wheat differentiated by class and origin of country. The system of cost and revenue share equa-tions for Japanese wheat flour production was esti-mated using the nonlinear seemingly unrelated regres-sion with symmetry, linear homogeneity and concav-ity restrictions.
The results suggest that Japanese demand for food wheat is highly elastic. US soft wheat mainly competes with Japanese domestic soft wheat in the Japanese wheat market. US hard and semi-hard wheats face strong competition from Canadian hard wheat. Australian soft wheat also competes with US soft and hard wheat, but the competition is less intense.
The multiple classes and the multiple end-use char-acteristics of US wheat enable the US to maintain its large market share in the Japanese wheat market. If Japan liberalizes its domestic wheat market, the milling industry would use more imported wheat in-stead of domestic soft wheat and US market share of soft wheat could increase faster than other wheat classes.
References
Allen, R.G.D., 1938. Mathematical Analysis for Economists. Macmillan, London.
Alston, J.M., Carter, C.A., Green, R., Pick, D., 1990. Whither Armington trade model? Agric. J. Agric. Econ. 72, 455–467.
Capel, R.E., Rigaux, L.R., 1974. Analysis of export demand for Canadian wheat. Can. J. Agric. Econ. 22, 1–14.
Chalfan, J.A., Gray, R.S., White, K.J., 1991. Evaluating prior beliefs in a demand system: the case of meat demand in Canada. Am. J. Agric. Econ. 73, 476–490.
Davis, G.C., Jensen, K.L., 1994. Two-stage utility maximization and import demand systems revisited: limitations and an alternative. J. Agric. Resou. Econ. 19, 409–424.
Economic Research Service, 1994. PS&D View, Commodity Database. U.S. Department of Agriculture, Washington, DC.
Gallagher, P., Lancaster, M., Bredahl, M., Ryan, T.J., 1981. The US wheat economy in an international setting: an econometric investigation. ESS/USDA Tech. Bull. No. 1644. U.S. Department of Agriculture, Washington, DC.
Greenshields, B.L., 1986. Impact of a resale price increase on Japan’s wheat imports. Foreign Agricultural Economic Report No. 128. Economic Research Service, U.S. Department of Agriculture, Washington, DC.
Henning, John C., 1986. An econometric model of the world wheat market by class: evaluating alternate Canadian export regimes. Ph.D. dissertation, University of Guelph, Guelph, Ont., unpublished.
International Grains Council, 1989–1994. World Grain Statistics, London.
Isayama, Tadayuki (Ed.), 1982. Wheat Industry in Japan. Chikyusha, Tokyo, Japan.
Japanese Food Agency, 1967–1994. Food Control Statistical Yearbook. Tokyo, Japan.
Japanese Food Agency, 1967–1995. Wheat Flour and Feed Processors: Current Situations. Tokyo, Japan.
Japanese Ministry of Agriculture, Forestry and Fisheries, 1955–1995. Tables of foods supply and demand. Tokyo, Japan.
Kohli, U., 1991. Technology, duality, and foreign trade: The GNP function approach to modeling imports and exports. The University of Michigan Press, Ann Arbor.
Lee, J.H., Koo, W.W., Krause, M.A., 1994. Japanese wheat import demand. Agricultural Economics Report No. 317. Department of Agricultural Economics, North Dakota State University, Fargo, ND.
Love, H.A., Murningtyas, E., 1992. Measuring the degree of market power exerted by government trade agencies. Am. J. Agric. Econ. 74, 546–555.
Ray, S.C., 1982. Translog cost function analysis of U.S. Agriculture, 1937–77. Agric. J. Agric. Econ. 64, 490–498. Riley, P., Schwartz, S., Ackerman, K., 1994. World feed
Statistics Bureau of Japan, 1967–1998. Japanese Statistical Yearbook. Tokyo, Japan.
White, K.J., 1993. SHAZAM Econometrics Computer Program, Version 7.0. Computational Statistics & Data Analysis.
Wiley, D.E., Schmidt, W.H., Bramble, W.J., 1973. Studies of a class of covariance structure models. J. Am. Stat. Assoc. 68, 317–323.
Wilson, W.W., 1994. Demand for wheat classes by pacific rim countries. J. Agric. Res. Econ. 19, 197–209.
Yokoyama, H., 1993. Political indirect control of wheat demand-supply and its character after World War II. Tohoku J. Rural Econ. 12, 17–33.