PROBABILISTIC RECONSTRUCTION OF ORTHODOX CHURCHES FROM PRECISION
POINT CLOUDS USING BAYESIAN NETWORKS AND CELLULAR AUTOMATA
M. Chizhovaa∗, D. Korovinb, A. Gurianovc, M. Brodovskiid, A. Brunne, U. Stillaf, T. Luhmanng a
University of Applied Sciences W¨urzburg-Schweinfurt, R¨ontgenring 8, 97070, W¨urzburg, Germany - [email protected], bIvanovo State University of Power Engineering, Rabfakovskaya Str. 34, 153003, Ivanovo, Russia - [email protected],
c
Ivanovo State University, Ermak Str. 39, 153025, Ivanovo, Russia - [email protected]
dIvanovo State University of Power Engineering, Rabfakovskaya Str. 34, 153003, Ivanovo, Russia - [email protected], eUniversity of Applied Sciences W¨urzburg-Schweinfurt, R¨ontgenring 8, 97070, W¨urzburg, Germany - [email protected],
f
Technische Universit¨at M¨unchen (TUM), Arcisstr. 21, 80333, M¨unchen, Germany - [email protected],
gJade University of Applied Sciences Wilhelmshaven/Oldenburg/Elsfleth, Ofener Str. 16, 26121, Oldenburg, Germany - [email protected] Commission II
KEY WORDS:reconstruction from point cloud, cellular automaton, Bayesian network, orthodox churches
ABSTRACT:
The point cloud interpretation and reconstruction of 3d-buildings from point clouds has already been treated for a few decades. There are many articles which consider the different methods and workows of the automatic detection and reconstruction of geometrical objects from point clouds. Each method is suitable for the special geometry type of object or sensor. General approaches are rare. In our work we present an algorithm which develops the optimal process sequence of the automatic search, detection and reconstruction of buildings and building components from a point cloud. It can be used for the detection of the set of geometric objects to be reconstructed, independent of its destruction. In a simulated example we reconstruct a complete Russian-orthodox church starting from the set of detected structural components and reconstruct missing components with high probability.
1. INTRODUCTION 1.1 Motivation
The development of science, technology and equipment as well as the human ability to invent new constructions has allowed for the creation of different unique objects in the real world. In the course of time, a lot of information about former cultural objects got lost, some objects were strongly damaged or ruined. The dig-ital reconstruction makes the understanding of building principles easier, especially for partly destroyed or no more existing objects.
The reconstruction of lost historical and architectural objects is an up-to-date topic in many researches. With 3D laserscanning we are able to create the 3D construction plans of real scenes with high precision and completeness. Complex geometry reconstruc-tion from point clouds in the context of the big data problem is not a trivial duty and needs methods and algorithms for the opti-mization of data processing. Due to the large amount of data, the choice of efcient methods is an important task.
As a standard rule, object reconstruction begins with feature de-tection, in case of building reconstruction with geometrical fea-tures. The existing methods are mostly appropriate for simple objects such as recognition of planes or spheres. For complex objects, combining different geometric entities, the choice of one particular detection method is not always appropriate because each method offers its own advantages for specic types of geo-metric entities.
In this article, we develop the mathematical model of a new method, which allows an optimized extraction of geometrical information from laserscanning point clouds and its efcient interpretation for
∗
Corresponding author.
further reconstruction. This method is suitable for object recon-struction from incomplete data which can be the result of missing object parts.
This work is carried out in the context of recent research in virtual reconstruction of destroyed orthodox churches, which are known by their complex architecture.
1.2 Previous works
Considering previous work, we focus two aspects:
1. point cloud interpretation and
2. reconstruction from precision point clouds.
In our case, point cloud interpretation means extraction of analyt-ical, geometrical and semantical information from point clouds. Here, geometry extraction is relevant to our work. The most com-mon techniques of geometry extraction from point clouds are:
• RANSAC and its variations ((Schnabel et al., 2007), (Al-Durgham et al., 2013), (Rusu et al., 2009));
• Hough transformation ((Vosselman et al., 2004), (Overby et al., 2004), (Rabbani and Heuvel, 2005), (Maltezos and Ioannidis, 2016));
• least-squares fitting ((Ahn, 2004), resumed by (Liu and Wang, 2008), (Wang et al., 2004), (Fleischmann et al., 2005));
Even though these methods are quite robust, some of them are dependent on the number of processing iterations, need start sam-pling and are not always correct for complex objects, which can be a combination of different geometries. In case of complex architecture, which cannot be approximated only with geometri-cal primitives, the detection method of one geometric object can differ from others. Chosen method determines further reconstruc-tion of the whole object.
There are different reconstruction approaches based on interpreted information from point clouds. Some reconstruction methods use a strict prototype model. In many articles about reconstruction of cultural heritage objects a library of typological architectural elements taking in account construction canons is used.
In (Quattrini et al., 2015) a destroyed architectural object has been completely reconstructed from the TLS point cloud as well as single classied archaeological samples according to practical and theoretical canons of roman architecture. (Dore and Murphy, 2013) generated digital historical models using Historic Building Information Modelling (HBIM) containing parametric library ob-jects and procedural modelling techniques. Further on, ((Dore et al., 2015)) have developed a set of rules and algorithms for the automatic combination of parametric library objects and genera-tion of HBIMs from survey data (historic surveys and recent laser scan survey as segmented point cloud and cut sections). A con-ceptual framework is based on the denition of shape grammar, which allows for the automatic generation of 2D and 3D geome-tries from a basic vocabulary of shapes. The reconstruction is supported by architectural rules and proportions. There are some program applications allowing for a semi-automatic modeling of architectural forms according to library of structural elements, in which the model parameters of structure element are estimated from user dened keypoints ((Kivilcim and Duran, 2016)).
(Huang et al., 2011) developed roof decomposition rules for re-construction of LoD2 buildings. Based on a predefined library of primitives a generative modeling has been conducted to con-struct the target roof that fits the data. Extracted primitives from a point cloud were composed and merged. (Nguatem et al., 2013) extracted a ridgeline from the highest points of the point cloud, which was bounded with ground plan, for roof model tting using likelihood principle.
The reconstruction of single architectural models is considered in (Canciani et al., 2013). The method is based on the extrusion path modeling of architectural elements from point cloud section, which have been compared with a knowledge based model.
In many articles, a building reconstruction is based on integration of extracted geometrical information about single object parts ac-cording to different composition rules.
Extracted straight lines and planes (e.g. using RANSAC, Hough transform) solve often for planar object reconstruction and de-composition of its elements (e.g. roofs - (Nizar et al., 2006), (Arefi et al., 2010), buildings - (Rusu et al., 2009)). (Verma et al., 2006) detected planes and rectangular outlines for roof composi-tion using Roof Topology Graph. (Kada and Wichmann, 2013) generated complex building shapes using Boolean intersection of half-spaces, which dene convex building components. (Xiong et al., 2015) represented roofs with topological graphs and applied the Minimum Cycles Method for roof decomposition using ex-tracted geometrical primitives from airborne LiDAR data.
In the last years, probabilistic approaches are widely used in recog-nition processes. Probabilistic graphical models (PGM), devel-oped by (Koller and Friedman, 2009), integrate schematic graph-ical object representation (e.g. as graph) with different stochastic
statistic models, like Hidden Markov Model (HMM), Conditional Random Field (CRF) and Bayesian nets, allowing for probabilis-tic decision-making.
(Ruiz-Sarmiento et al., 2015) integrated PGMs as Conditional Random Fields (CRF) with Semantical Knowledges (SK) for rep-resentation of object relations in context of input scene.
(Xiong and Huber, 2010) extracted and classied planar regions for further object recognition using CRF. In (Anand et al., 2013) used an isomorphic to MRF (Markov Random Fields) model for object recognition and classication in certain scene (e.g. ofce, house).
(F¨orstner, 2013)showed the efciency of object parameter estima-tion and classicaestima-tion, which are optimized through implementa-tion of Bayesian nets and MRF in context of exible construcimplementa-tion of graphical models.
In all cases, a big data problem is relevant for point cloud pro-cessing. The role of high mechanism complexity and the creation of self-reproducing intelligent automates for acceleration of tech-nological processes has been discussed already for many years (e.g. (v. Neumann, 1966)). An additional example from such automates is a cellular automaton (CA), which can be based on varies rules (using for example Bayes theory and Bayesian net-works ((Wolfram, 1983), (Neapolitan, 2004))).
This way is favored in our actual work.
2. NEW METHOD 2.1 Outline of algorithm
The developed method is based on a probabilistic approach and discrete mathematics methods, namely Bayesian networks and cellular automata theory. Let us consider an algorithm which makes an automatic choice of an acceptable method for detec-tion of different geometrical entities in a complex object and its further automatic reconstruction from incomplete data. Thus, we consider a-priori known object conguration with its pre-dened se-mantic information, which is organized like a graph. A combina-tion of Bayesian nets with cellular automata allows to dene an optimal
• geometric candidate for object detection,
• recognition way,
• decision-making for reconstruction from incomplete data.
2.2 Research object
Our research objects are stone orthodox churches. There is the large number of such churches in the territory of Russia, Belarus and Ukraine. Several churches have been destroyed and are not used as religious institution any more. There is a huge interest in the restoration of these objects.
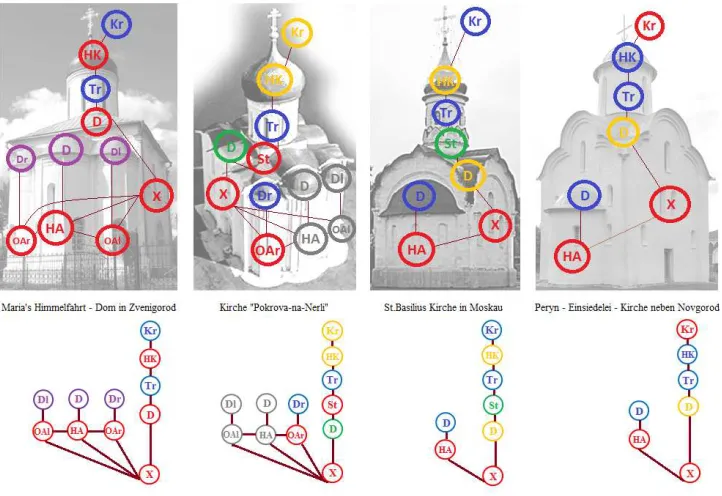
Figure 1: Church representation with colored graph.
2.3 Knowledge representation
We model our objects - orthodox churches - with colored-oriented topological graphsG = (V,E). The vertices V are the struc-tural components of the church, like a cupola or a crucix with arbitrary geometries. The edges E are the neighboring relations between the elements of V, which are attributed by conditional probabilities to the edges. The objects differ in their complexity (cf. Fig. 1).
We take in account the following encoding for the representation of some components:
• The letters in the vertices are the specic structural compo-nents with a specic geometry and localization.
• The edges, coded with a line, show the topological and prob-abilistic connection or the probprob-abilistic inuence of the com-ponents on each other (for example: if one component was detected, then we can claim, with a dened probability, that another component must be detected or reconstructed and vice versa).
• For the visual comfort we represent the different geometry types with different colors, i.e. each class of detected geom-etry type has its own color.
A database of certain amount of churches with classication of structural elements was built for derivation of probabilistic rela-tions between elements and solves as a base for further construc-tion of Bayesian network. In our case, the abbreviaconstruc-tions of the church parts are:Kr- crucifix,HK- main cupola,T r- cylin-der,St- prop,D- roof,X- nave,OAr- sacrifice altar right,Dr - sacrifice altar roof (right),HA- main altar;D- main altar roof, OAl- sacrifice altar left,Dl- sacrifice altar roof (left).
2.4 Mathematical background
Let us consider a mathematical method solving a correct decision problem. This means in the context of our research, that we have
checked the information about some parts of our object, we can apply the arbitrary method of recognition and search an object in a certain place. Consider a method based on the use of Bayesian networks as one method to guide this search process.
We use the basic formula (Bayesian Theorem)
P(θ|I) = P(θ)P(I|θ)
P(I) , (1)
where
• Iis the information about those parts of object, which were detected;
• P(I)is the probability of I, dened as the frequency of ob-jects occurs as identied as I in all the set of the churches;
• θare the identiers of those geometrical objects, which we want to detect;
• P(I|θ)is the posterior probability: the distribution element of objects identiers under the assumption of already detected objects;
• P(θ)is the prior probability: it is the formalization of our intuition about the possibility of the detection of an object. In our case the value of this probability is dened statistically after the quantitative data analysis, after the supervision of such parts in orthodox churches.
All conditional probabilities are learned from training datasets.
The expressionP(I|θ)is called likelihood; it is a probability of a known data supervision by the xation of certain identiers. Thus, our task is to nd the maximum a posterior hypothesisθ, by which
If we setP(I|θ) of likelihood functions according to equation ( 1), the decision problem will be solved correctly. However, the establishment process of these functions is not a trivial procedure. These distributions can be rather difcult.
If we add some additional restrictions, the problem ofP(I|θ) -function calculation can be simplied. By the conditional indepen-dencea1,a2,. . .,anof the objects identiers, which deneI, we have:
P(a1, a2, . . . , an|θ=θk) =
=P(a1|θk)P(a2|θk). . . P(an|θk) (2)
IfI contains information in our case thatX = X1 (an event
a1),HK−St=HK−St1(an eventa2), andθ=θkmeans thatD = Dk, thenP(I|θ = θk) is the multiplication of the two probabilities ofP(a1|θ =θk)andP(a2|θ =θk). Each of these probabilities will be defined from the set of those churches, at whichX1, HK−St1respectively among those churches, at
whichD=Dk.
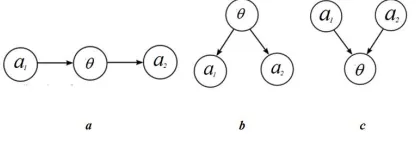
In our example, we can find the subgraphs shown in Fig. 2. The
Figure 2: Subgraphs of the probability connections.
pointers on the graph edges are suspended in most of the cases of this article.
The graph of Fig. 2acorresponds to the expression in eq. (2):
P(a1, θ, a2) =P(a1)P(θ|a1)P(a2|θ).
From this follows
P(I|θ) = P(a1, a2|θ) =
P(a1, θ, a2)
P(θ)
= P(a1)P(θ|a1)P(a2|θ)
P(θ) = P(a1|θ)P(a2|θ),
because
P(a1)P(θ|a1)
P(θ) =P(a1|θ)
according to the Bayes Theorem (cf. eq. 1).
The graph of Fig. 2bdefines the following equality:
P(θ, a1, a2) =P(θ)P(a1|θ)P(a2|θ),
resulting in
P(I|θ) = P(a1, a2|θ) =
P(θ, a1, a2)
P(θ)
= P(θ)P(a1|θ)P(a2|θ)
P(θ) = P(a1|θ)P(a2|θ)
This simplifies the likelihood functions.
Whena1 and a2 influence onθ at the same time (fig. 2c) it is possible to express it as
P(a1, a2, θ) =P(a1)P(a2)P(θ|a1, a2)
In this case we receive a likelihood function which depends on the intended value, that, obviously, does not yield the correct de-cision. In this case the likelihood- function will be directly calcu-lated directly.
A similar approach will allow us to optimize the procedure of method choice for object extrapolation.
2.5 Processing principles
Let us consider the graph which describes an input church as a special type of a cellular automaton. This graph is a lattice of cellular automaton, in which vertices are the automata cells. The cellular automaton can be defined as a set of final automatas with concrete state in discrete timet:
σ∈Σ ={0,1,2. . . k−1, k}
A detection of component geometries changes the automaton states of each cell in the neighborhood according to the transition rule:
σi,j(t+ 1) =φ(σk,l(t)|σk,l(t)∈ N)
Nis the set of automatas that constitute a neighborhood. At time twe have 3 kinds of cells:
1. cells with unambiguously defined state (e.g. detected geom-etry);
2. “pending” cells which incident (but do not belong) to de-fined cells;
3. “empty” cells which do not incident and do not belong to defined cells.
In our case, we set an initial state randomly. It is reasonable to set the most probable state as initial state: it means, the search is statistical driven starting with the most likely geometry for each component.
The transition function will be defined: if the vertexBdoes not belong toN, there are edges from the vertexBincidental to the vertices fromN(“pending cells”):
The state of the vertex is
B=
B1, p1 =P(B1|N)
B2, p2 =P(B2|N)
. . .
Bk, pk=P(Bk|N)
If the vertexBbelongs toN, the state of a vertex remains the same with the probability of1(almost sure event).
Applying the Maximum-Likelihood method, we choose the state in the pending vertices respectively to the maximum of the cor-responding probabilitiesBk ={Bi,max(pi) =pk}and check for the correctness. It denes appropriate processes in all pending vertices, in which we detect the geometry of church structural el-ement by the method chosen according to a state. The following results are possible:
1. The geometry in the pending vertex has been detected. In this case we attach a vertex to the N-set.
2. The geometry in the pending vertex has not been detected with the method chosen according to a state (we define this state asB1without loss of generality).
Let us transform the transition function: If the vertex B does not belong toN, there are edges from the vertexBincidental to ver-tices fromN (“pending vertices”) and on the previous step this vertex was not a pending vertex:
The state of the vertex is
B=
If the vertexBdoes not belong toN, there are edges from the vertexB incidental to the vertices fromN (“pending vertices”) and on the previous step this vertex was a pending vertex:
The state of the vertex is
B=
( B
2, p2=P(B2|N, notB1)
· · ·
Bk, pk=P(Bk|N, notB1)
If the vertexB belongs toN, the state of a vertex remains the same with the probability of1.
If the vertexBhas no edge with any vertex fromN, the state of a vertex remains the same with the probability of1.
This iterative process yields to a distinct solution since all cells will nally change its state to “unambiguously dened”. In our case it is convenient to visualize the state of a vertex with a color. To each state of Bk a specic color is assigned. Thus, the presented probabilistic automaton presents the process of vertex coloring in the graph.
3. EXAMPLE
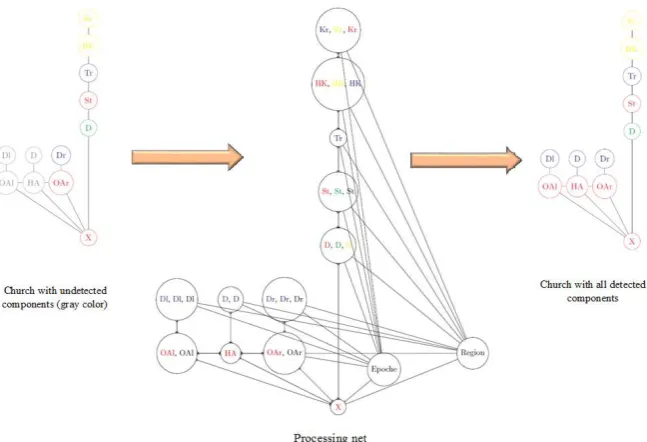
Let us consider the example of algorithm realization. In this sec-tion we will present the workow of the version of our probabilistic automaton. At the moment our probabilistic automaton is single-step. Unlike classical probabilistic automatas we make actions on the correctness control of the automaton state changes between processing steps. We check, whether the offered extrapolation method is correct (in other words, whether the vertex is painted in the correct color on a processing step). The task of the au-tomaton is to paint all vertices in a correct color. We will dene transition functions according to the Bayesian network rules.
It will be taken into account, that the topology and geometry of some vertices is already known. The verticesKr,HK,T r,St, D, X, OAr, Dr are painted in the color that corresponds to
their certain geometry. The verticesHA,D,OAl,Dlhave not been detected yet. Therefore the lack of color (or the lack of any knowledge about the geometry of this object) is represented with the gray color of the vertices (cf. Fig. 3).
The operation principle of the cellular automaton in our case is as follows: we start the parallel operation of nal automaton for each gray vertex. But only for two vertices the automatic functions, which transforms a vertex color, will be uncommon. In our case we have two such gray tops: HAandOAl. There are no inci-dental edges for them, which connect gray and colored vertices. Other gray vertices actions of automatic functions will lead to the coloring of those vertices in the same gray color.
Let us consider the case when we need to dene theHA-vertex geometry. We will describe the operation of the corresponding automaton by identifying the color of this vertex. There are three approaches or three ways of extrapolation for its identication. It means that it is necessary to dene which of the three colors - e.g. red, blue or green - will correspond to the real existing geometry. In our algorithm we will apply the Bayesian rules.
Let us define the following variations:θ1- is the event (or
inci-dent), which determines the red color ofHA- vertex, the color ofθ2- blue or the color ofθ3- green.
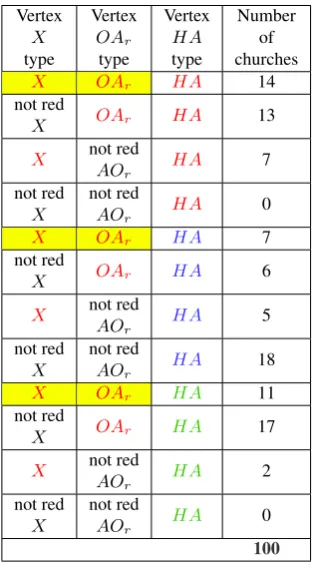
Table 1: Simulated statistical data: each line of the table contains the number of examples to generate the conditional probabilities.
The choice ofi-vertex will be conditioned by the maximum of the expressionP(θ|I), i = 1,2,3. TheI - event means in our case that incidental toHA-vertex detected verticesX andOAr are painted in red color. ProbabilitiesP(θ1), P(θ2), P(θ3), P(I)
can be found using the statistical data presented in Table 1. Then it is necessary to find the likelihood functionsP(I|θi), i= 1,2,3 using the properties of Bayesian networks, which we have de-scribed in section 2. It is important to notice thatP(I|θ)is equal toP(X|θ)×P(OAr|θ)in our case.
The maximum of likelihood functionP(θ|I)is reached atθ =
θ1. Therefore the vertexHAhas to be painted in red color. Thus,
Figure 3: Processing principle.
likelihood function
θ P(θ) X|θ P(X|θ) OAr|θ P(OAr|θ) P(I|θ) P(θ|I)
θ1 HA 34 34/100 21 21/34 27 27/34 0,490 0,521
θ1 HA 36 36/100 12 12/36 13 13/36 0,120 0,135
θ1 HA 30 30/100 13 13/30 28 28/30 0,404 0,379
P(I)
X+OAr 34 34/100
Table 2: Deduction of the Likelihood function.
Further the following cases are possible.
1. The color has defined a correct object extrapolation and we have received a geometry as the red color ofHA-vertex by the detection process. The quantity of vertices (not detected objects) has been decreased and the next cycle of detection process have to been started.
2. It was a mistake and the offered extrapolation method was incorrect. It leads to the recalculation of Tab. 1 (the amount of sequences decreases because we do not consider a wrong steps), values in the Table 2 will be recalculated conditioned by the refusal of a line with an incorrect color. The further searching procedure of theP(θ|I)- maximum proceeds.
The quantity of lines in the Table 2 is final. Therefore, this pro-cess is final by the cycle iteration and will lead to the final detec-tion of the object.
The second nal parallel started automaton will dene the color of OAl-vertex. Let us state thata1 is an event thatOAl-vertex is “red”,a2-OAl-vertex is “blue”,a3- “green”. As there is only
one vertex -X, painted in red color is incidental toOAlvertex, we will consider three conditional probabilities
P(OAl=a1|X=red) =
P(a1, X)
P(X) ,
P(OAl=a2|X=red) =
P(a2, X)
P(X) ,
P(OAl=a3|X=red) =
P(a3, X)
P(X) ,
P(X = red)means the selection of those churches, which are described in our knowledge base, with the attributeX=red. In our case ofP(X=red) = 0,46.
P(OAl=ai, X=red)withi= 1,2,3is the selection of those churches from the knowledge base, which haveOAl =aiand X =redat the same time.
FromP(OAl=a1, X =red) = 0,413,P(OAl =a2, X =
red) = 0,282, andP(OAl=a3, X =red) = 0,305follows
P(OAl = a1|X = red) = maxTherefore, we identify the
color of OAl as red, and further, we apply the corresponding way of extrapolation. If the way corresponding to red color is confirmed, the vertex is recolored in a red color, if not, then in the following step the number of alternatives decreases by one and the process repeats. The process is final (Fig. 4).
4. CONCLUSION
Figure 4: Automatical object reconstruction after automaton steps.
Further work will concentrate in two directions. On the one hand, the empirical work on the analysis of the historical development of the churches will be continued. On the other hand, the cellular automaton will be realized for larger and more complex building models.
Acknowledgements: We thank the Free State of Bavaria, who made this research possible by a grant for the visit of Prof. Ko-rovin at the FHWS.
REFERENCES
Ahn, S., 2004. Least Squares Orthogonal Distance Fitting of Curves and Surfaces in Space. Springer Berlin.
Al-Durgham, K., Habib, A. and Kwak, E., 2013. Ransac ap-proach for automated registration of terrestrial laser scans using linear features. ISPRS Annals of the Photogrammetry, Remote Sensing and Spatial Information Sciences, II (5/W2): 13-18.
Anand, A., Koppula, H., Joachims, T. and Saxena, A., 2013. Contextually guided semantic labeling and search for three-dimensional point clouds. The International Journal of Robotics Research, 32(1): 19-34.
Arefi, H., Hahn, M. and Reinartz, P., 2010. Ridge based decom-position of complex buildings for 3d model generation from high resolution digital surface models. The International Archives of the Photogrammetry, Remote Sensing and Spatial Information Sciences, 34 (XXX): 15 - 22.
Becker, R., 2005. Differentialgeometrische Extrak-tion von 3D-Objektprimitiven aus terrestrischen Laser-scannerdaten. PhD thesis, Ver¨offentlichungen des Geod¨atischen Instituts der Rheinisch-Westf¨alischen Tech-nischen Hochschule Aachen, N63, https://www.deutsche-digitale-bibliothek.de/binary/WI6IH566CY75KXJY3QX JBTG-MXWKJI5TS/full/1.pdf.
Canciani, M., Falcolini, C., Saccone, M. and Spadafora, G., 2013. From point clouds to architectural models: algorithms for shape reconstruction. International Archives of the Photogrammetry, Remote Sensing and Spatial Information Sciences, XL (5/W1): 27 - 34.
Dore, C. and Murphy, M., 2013. Semi-automatic modeling of building facades with shape grammars using historic building in-formation modeling. International Archives of the Photogram-metry, Remote Sensing and Spatial Information Sciences, XL (5/W1): 57-64.
Dore, C., Murphy, M., McCarthy, S., Brechin, F., Casidy, C. and Dirix, E., 2015. Structural simulations and conservation analysis -historic building information model (hbim). The International Archives of the Photogrammetry, Remote Sensing and Spatial In-formation Sciences XL (5/W4): 351 - 357.
Fleischmann, S., Cohen-Or, D. and Silva, C., 2005. Robust mov-ing least-squares fittmov-ing with sharp features. Proceedmov-ings of ACM SIGGRAPH, 24(3): 544-552.
F¨orstner, W., 2013. Graphical models in geodasy and photogram-metry. PFG Photogrammetrie, Fernerkundung, Geoinformation, 4: 255-267.
Huang, H., Brenner, C. and Sester, M., 2011. 3d building roof reconstruction from point clouds via generative models. Proceed-ings of the 19th ACM SIGSPATIAL International Conference on Advances in Geographic Information Systems: 16 - 24.
Kada, M. and Wichmann, A., 2013. Feature-driven 3d build-ing modelbuild-ing usbuild-ing planar. International Annals of the Pho-togrammetry, Remote Sensing and Spatial Information Sciences, II-3/W3: 37-42.
Kivilcim, C. and Duran, Z., 2016. A semi-automated point cloud processing methodology for 3d cultural heritage documentation. The International Archives of the Photogrammetry, Remote Sens-ing and Spatial Information Sciences, XLI (B5): 293 - 296.
Koller, D. and Friedman, N., 2009. Probabilistic Graphical Mod-els: Principles and Techniques. MIT Press, Massachusetts.
Liu, Y. and Wang, W., 2008. Advances in Geometric Modeling and Processing. Springer Berlin Heidelberg, chapter A Revisit to Least Squares Orthogonal Distance Fitting of Parametric Curves and Surfaces (pp. 384 - 397).
Maltezos, E. and Ioannidis, C., 2016. Automatic extraction of building roof planes from airborne lidar data applying an ex-tended 3d randomized hough transform. International Annals of Photogrammetry, Remote Sensing and Spatial Information Sci-ences, III(3): 209 - 216.
Neapolitan, R. E., 2004. Learning Bayesian Networks. Pearson Prentice Hall, 2004.
Nguatem, W., Drauschke, M. and Mayer, H., 2013. Roof recon-struction from point clouds using importance sampling. In: Inter-national Annals of Photogrammetry, Remote Sensing and Spatial Information Sciences, II (3/W3): 73 - 78.
Overby, J., Bodum, L., Kjems, E. and Ilsoe, P. M., 2004. Auto-matic 3d building reconstruction from airborne laserscanning and cadastral data using hough transform. International Archives of Photogrammetry and Remote Sensing, XXXV(B3): 296-301.
Quattrini, R., Malinverni, E. S., Clini, P., Nespeca, R. and Orlietti, E., 2015. From tls to hbim. high quality semantically-aware 3d modelling of complex architecture. The International Archives of the Photogrammetry, Remote Sensing and Spatial Information Sciences XL (5/W4), pp. 367 – 374.
Rabbani, T. and Heuvel, F., 2005. Efficient hough transform for automatic detection of cylinders in point clouds. International Archives of the Photogrammetry, Remote Sensing and Spatial In-formation Sciences, XXXVI (3/W19): 60-65.
Ruiz-Sarmiento, J., Galindo, C. and Gonzalez-Jimenez, J., 2015. Scene object recognition for mobile robots through semantic knowledge and probabilistic graphical models. Expert Systems with Applications, 42(22): 8805 - 8816.
Rusu, R., Blodow, N., Marton, Z. C. and Beetz, M., 2009. Close-range scene segmentation and reconstruction of 3d point cloud maps for mobile manipulation in domestic environments. Proc-ceding of the International Conference on Intelligent Robots and Systems in St. Louis: 1-6.
Schnabel, R., Wahl, R. and Klein, R., 2007. Efficient ransac for point-cloud shape detection. Computer Graphics Forum, 26 (2): 214 - 226.
v. Neumann, J., 1966. Theory of self-reproducing Automata. University of Illinois Press Champaign, IL, USA, 1966.
Verma, V., Kumar, R. and Hsu, S., 2006. 3d building detction and modeling from aerial lidar data. Proceedings of the 2006 IEEE Computer Society Conference on Computer Vision and Pattern Recognition, 2: 2213-2220.
Vosselman, G., Gorte, B., Sithole, G. and Rabbani, T., 2004. Recognising structure in laser scanner point clouds. International Archives of Photogrammetry, Remote Sensing and Spatial Infor-mation Sciences, XXXVI (8/W2): 33 - 38.
Wang, W., Pottmann, H. and Liu, Y., 2004. Fitting b-spline curves to point clouds by squared distance minimiza-tion. Technical report, HKU CS Tech Report TR-2004-11, http://www.cs.hku.hk/research/techreps/ document/TR-2004-11.pdf.
Wolfram, S., 1983. Statistical mechanics of cellular automata. Reviews of Modern Physics, 55 (3): 601 - 644.
Xiong, B., Jancosek, M., Elberink, S. O. and Vosselman, G., 2015. Flexible building primitives for 3d building modeling. IS-PRS Journal of Photogrammetry and Remote Sensing, 101: 275 - 290.