Comparison of test-day and lactation models for genetic
evaluations of Icelandic dairy cows for production traits and
somatic cell score
Jón H. Eiríksson1, Ágúst Sigurdsson1, Gudmundur Jóhannesson2 & Emma Eythórsdóttir1
1 Agricultural University of Iceland, Hvanneyri, 311 Borgarnes, Iceland 2 Icelandic Agricultural Advisory Centre
E-mail: nonnikotinu@gmail.com; agust@kirkjubaer.is; mundi@rml.is; emma@lbhi.is ABSTRACT
Predicted genetic progress in production traits was compared using three different models for genetic evaluation of Icelandic dairy cows. The models were: a random regression (RR) test-day model, model using lactation yields until day 305 from calving (LAC1), and the model currently used for the national evaluation, based on lactation yield from calving to the end of lactation regardless of the length of the lactation (LAC2). Additionally, genetic evaluation for somatic cell score with RR and LAC1 were compared. Predicted genetic progress for protein yield was highest when using RR, or 0.170 σa/yr, compared with 0.167 σa/yr and 0.158 σa/yr for LAC1 and LAC2, respectively. Results for other production traits were similar. The main reason could be the shorter generation interval when records can be utilized before the end of lactation and reliable estimated breeding values thus obtained earlier. Application of an RR model will be beneficial for genetic evaluation for production traits and somatic cell score.
Keywords: Daily yield, genetic trend, lactation, protein yield, random regression
YFIRLIT
Samanburður á notkun mælidagalíkans og mjaltaskeiðslíkana við kynbótamat fyrir afurðir og frumutölu íslenskra kúa
Möguleg erfðaframför fyrir framleiðslueiginleika hjá íslenskum kúm var borin saman út frá þremur reiknilíkönum við útreikninga kynbótamats, þ.e. reiknað með slembiaðhvarfs mælidagalíkani, mjaltaskeiðslíkani fyrir afurðir að degi 305 frá burði og mjaltaskeiðslíkani sem hefur verið notað við opinbert kynbótamat og byggir á afurðum allt mjaltaskeiðið óháð lengd þess. Möguleg erfðaframför fyrir frumutölu var metin með tveimur fyrrnefndu líkönunum. Möguleg erfðaframför fyrir próteinafurðir var metin 0,170 staðalfrávik erfða á ári með því að byggja á niðurstöðum mælidagalíkansins, samanborið við 0,167 með mjaltaskeiðslíkani að degi 305 og 0,158 með mjaltaskeiðslíkani sem byggir á öllu mjaltaskeiðinu. Sambærilegar niðurstöður fengust fyrir aðra eiginleika. Munurinn skýrist einkum af mun á því hvenær naut í afkvæmaprófun fá nógu öruggt kynbótamat til þess að fara í framhaldsnotkun og þar með kynslóðabilinu. Innleiðing mælidagalíkans væri til bóta fyrir íslenska nautgriparækt.
INTRODUCTION
The Icelandic dairy cow is believed to have been mostly isolated for centuries (Adalsteinsson 1981, Kantanen et al. 2000). It is the only dairy breed used for milk production in Iceland. Increased protein yield (PY) is the main breeding goal, with 37.4% weight in the total merit index, and 6.6% weight is also placed on protein percentage. Fertility, somatic cell count, longevity, temperament, milking ease, udder and teat conformation are also included in the total merit index with 8% weight each (Ráðgjafarmiðstöð landbúnaðarins, n.d.). The breeding program was initially described by Jónsson and Jónmundsson (1974). Bull calves from planned matings of selected bull-sires and bull-dams are brought to the artificial insemination station. About half of the semen doses used each year is from young bulls for progeny testing and the rest from proven bulls. The system has undergone some changes since it started, the most prominent being that more traits have been added to the breeding goal and the implementation of BLUP methods and animal models for genetic evaluations (Sigurdsson & Jónmundsson 2011). Sigurdsson (1993) introduced lactation models for milk yield (MY), fat yield (FY), PY, fat percentage and protein percentage in the first three lactations for genetic evaluations of the population, and Sigurdsson (1997) presented animal model genetic evaluation for somatic cell score (SCS), calculated as (SCS) = log2(SCC/100) + 3 where SCC is the somatic cell count in thousands. In 2000 to 2009 genetic progress was confirmed for all traits in the breeding goal except that very limited progress was observed for fertility, measured as calving interval (Sigurdsson & Jónmundsson 2011).
Random regression (RR) models have been implemented for production traits in many countries since being introduced by Schaeffer and Dekkers (1994), and more recently for multinational genetic evaluations (Lidauer et al. 2015). RR models have several advantages, including better use of records from lactations in progress and the ability to select for the shape of the lactation curve (e.g. Ptak & Schaeffer
1993, Schaeffer & Dekkers 1994). The current procedure for genetic evaluation only includes information on yields when the lactation has ended and the next calving is recorded or the cow is culled. This results in a long lag from the first records on the lactation until the information can be utilized in the breeding program. The use of an RR model could shorten this lag and also gives better modelling of the environmental effects.
Eiríksson et al. (2019) showed that heritability of lactation yields and SCS is higher using the RR model compared to the lactation model and higher than earlier estimates for the breed. Higher heritability alone should improve genetic evaluations in addition to earlier use of information.
The aim of this study was to investigate the effects of implementing a random regression model for genetic evaluation of production traits and somatic cell count for Icelandic dairy cows. The results were compared to a lactation model, considering yield from days 5-305 from calving (LAC1) in order to estimate the gain from the RR model. It was also compared to the lactation model currently in use for the genetic evaluation (LAC2) for the yield traits to estimate how much the breeding program is expected to gain from the new model.
MATERIALS AND METHODS
Data
Test-day data on MY, FY, PY and SCS from the first three lactations of recorded cows in 1995-2016 was obtained from the database of the Farmers Association of Iceland. Milk yield was recorded monthly but milk samples for measuring somatic cell count as well as fat and protein content were collected 8 times per year. In 2004 and later, farmers were allowed to collect samples up to 12 times per year and a proportion of the farmers did so. Lactation data on MY, FY, and PY came from the same database. For both the test-day and lactation data only records from animals born in 1993 and later were included. Pedigree information included 513,913 animals, the oldest born in 1911 and youngest in 2017. An overview of the data is presented in Table 1.
Models
Genetic evaluation was carried out with three different models for MY, FY and PY, an RR model and two lactation yield models (LAC1 and LAC2). Somatic cell count was converted to SCS as SCS=log2(SCC/100)+3 where SCC is the somatic cell count in thousands. The SCS was evaluated with two models, RR and LAC1. The RR model used was the same as described in Eiríksson et al. 2019, including a random effect of herd-test-day, fixed effects of calving month and calving age, fixed regression on standardized Legendre polynomials of order five within herd-year groups, random regression on standardized Legendre polynomials of order five for permanent environment effect, random regression on standardized Legendre polynomials of order four for additive genetic effects, and random residuals. The herd-year groups had a minimum of 30 records; groups with fewer records were combined over years.
Only records within 5-305 days of lactation were included in the analysis. TD records were
considered abnormal or erroneous and removed if calving age was not within 540-1350 days of age for the first lactation, 840-1800 days for the second lactation and 1140-2250 days for the third lactation. Records of daily MY were only included if they were within 1 to 55 kg, daily FY from 0.1 to 2.5 kg, daily PY from 0.1 to 1.8 kg and somatic cell count from 1,000 to 10,000,000/ml. If only one record was available for a lactation, that record was not included. Records from second and third lactations were only included if records from previous lactations were also available. If more than 11 records were in the database for a cow within 305 days from calving, they were considered erroneous and removed.
LAC1 was calculated as 305-day lactation yields from the TD data. Lactation MY, FY, PY and SCS were calculated when 6 or more MY test-day records were available, as described in Eiríksson et al. 2019. Lactations that were shorter than 305 days but had 6 or more records were extended based on the last available record
Table 1. Number of records (N), mean and standard deviation (SD) of test-day yields (TD), lactation yields from days 5 to 305 (LAC1) together with somatic cell score (SCS), and lactation yields from calving to the end of the lactation (LAC2) in the datasets used for genetic evaluation.
Lactation
TD LAC1 LAC2
N Mean SD N Mean SD N Mean SD
Milk yield [kg] 1 1 262 456 15.13 5.10 129 421 4 413 1 118 106 119 4 645 1 379 2 874 632 18.89 6.93 88 510 5 459 1 376 74 345 5 722 1 566 3 543 904 20.38 7.41 54 652 5 871 1 435 44 174 6 245 1 716 Fat yield [kg] 1 648 151 0.629 0.23 100 370 183.6 52.3 106 119 189.8 61.2 2 463 261 0.783 0.31 62 644 227.7 64.8 74 345 237.0 71.7 3 292 553 0.842 0.34 35 494 244.4 67.6 44 174 260.2 79.4 Protein yield [kg] 1 648 151 0.507 0.16 100 370 148.8 37.0 106 119 155.1 47.0 2 463 261 0.633 0.21 62 644 185.4 46.2 74 345 193.5 54.6 3 292 553 0.680 0.22 35494 199.3 48.0 44 174 211.6 60.2 Somatic cell score 1 648 151 2.94 1.64 117 844 2.68 1.31 2 463 261 3.38 1.69 77 928 2.89 1.32 3 292 553 3.59 1.71 46 676 3.16 1.31
and a fixed lactation curve. When information about PY and FY were lacking for a test-day, but MY records were available, milk sample records from the closest test-day were used to calculate PY and FY. If less than three milk samples were recorded in one lactation, PY and FY were regarded as missing. The model was the same as presented in Eiríksson et al. (2019), including fixed effects of herd-year group, calving age and calving month, random additive genetic effect, and random residuals. Assumed variance components were based on the estimates of Eiríksson et al. (2019) and are presented in Table 2.
For the LAC2 model the data were lactation MY, FY and PY as calculated by the recording system and used in the current national evaluation. Lactation yields were calculated when next calving or culling of the cow was recorded. Monthly measurements were multiplied with the average number of days in
one month. If milk component information was missing on a TD, results from up to the three last samples were used and weighted according to the time from the sample. If no samples were available, average values of 3.40% for protein and 4.00% for fat were used. The number of days from calving until the first measurement used for calculation was reduced by one if 7-9 days were from calving to measurement, two if 10-14 days were between, and three days if the number of days was more than 14. Records from cows that were culled less than 295 days from the previous calving or had a recorded calving within that time were discarded. Records with lactation MY less than 800 kg or more than 17,000 kg were also excluded.
The model used was based on the model presented by Sigurdsson (1993), including herd period groups, month of calving, age at calving and current calving interval as fixed effects, random additive genetic animal effect,
Table 2. Assumed variance components for the evaluation with the three models compared; random regression (RR), lactation yields from days 5 to 305 (LAC1), and lactation yield from calving until drying up/culling of the cow (LAC2). Numbers for RR and LAC1 were based on Eiríksson et al. (2019) and LAC 2 was estimated in this study. All numbers for somatic cell score are for daily averages, numbers for herd-test-day and residual variance for the RR model are for daily yields, other numbers are for whole lactation.
Random regression LAC 1 LAC 2
Trait Lactation G PE HTD R G R G R h2 Milk yield [kg] 1 250 983 346 150 0.46 1.29 249 700 356 600 360 500 789 700 0.31 2 281 548 556 417 0.70 1.88 267 900 564 600 253 500 1 160 000 0.18 3 322 094 669 459 0.79 2.22 306 000 670 600 282 700 1 536 000 0.16 Fat yield [kg] 1 429 679 0.22 0.82 397 829 609 1 654 0.27 2 508 1 057 0.34 1.26 456 1 289 414 2 427 0.14 3 686 1 219 0.39 1.56 626 1 478 501 3 298 0.13 Protein yield [kg] 12 240299 349552 0.07 0.170.10 0.24 239282 380603 319350 1 362 0.19938 0.27 3 364 653 0.11 0.28 331 703 418 1 783 0.19 Somatic cell score 12 0.260.25 0.870.85 0.08 0.610.10 0.65 0.200.18 1.031.01 3 0.24 0.88 0.12 0.67 0.19 1.06
and random residuals. One calving interval group included all cows culled before the end of lactation.
Genetic parameters for the first three lactations were estimated using a subset of the
data, 32,743, 18,708 and 8,800 records in first,
second and third lactations, respectively. The subset was chosen by eliminating lactation records based on fewer than 6 monthly records and from herds with information on fewer than 500 milk samples in the dataset. The pedigree file for the parameter estimation included animals with records and their ancestors up to 12 generations back. Eight phantom parent groups based on year of birth were included for the missing parents. The REML method with the EM algorithm was implemented using the REMLF90 package (Misztal et al. 2016). SCS was not estimated with LAC2 because the method that was used for LAC1 is similar to the current evaluation.
Inbreeding was ignored in building the relationship matrix for the genetic evaluations.
Missing parents were assigned to phantom parent
groups by year of birth. Each group covered 2 years for animals born in 1960 and later, but all animals born before 1960 were placed in one group. DMU5, the iteration on data procedure of the DMU package from Madsen & Jensen, (2012) was used in all evaluations.
Model comparison
The results of the three models were compared on a lactation yield basis. In order to obtain lactation yields from the results of the RR model, EBVs of daily yields of days 5-305 were summed up. The Pearson correlation and Spearman rank correlation between EBVs from different models of 75 bulls with at least 1000 daughters with records with the three models were calculated.
In order to compare the ability of the different models to accurately predict the genetic merit of animals, evaluations with different amounts of information, mimicking records accumulating in the database with time, were compared to evaluations using the whole dataset. The evaluations with information
from 1995 to 2016, using each model, were considered to give accurate estimated breeding values (AEBV), close to the true breeding values. Then data from the last 24 months was first excluded and the same evaluation repeated, followed by 23 additional evaluations carried out excluding 3 more months at a time. This resulted in estimated breeding values (EBV) for every quarter of the year from 1 April 2009 until 31 December 2014.
Approximated accuracy (AA) of EBVs was estimated as the Pearson correlation between EBVs and AEBVs based on the same model and was investigated for two groups. Firstly, 78 progeny tested AI bulls born in the period April 2005 to September 2008 were investigated with available information corresponding to the age 50 to 83 months. Secondly, 13,106 cows with known parents and born in the years 2006 to 2010, with first calving from 1 March 2009 to 31 December 2011 and records for all traits with all methods in first lactation were investigated. For all comparisons EBVs for the three lactations were combined within traits with weights of 0.5, 0.3 and 0.2 on first to third lactation, respectively. Spearman rank correlations between EBV and AEBV were also calculated but the results were not used for accuracy estimation because they were almost identical to those from the Pearson correlation and thus did not provide additional information.
The baseline for predicting genetic progress was the situation closest to the current one, using the LAC2 model and selecting proven bulls at 83 months of age. Yearly genetic progress for PY in this situation was assumed to be 0.16 genetic standard deviations as Sigurdsson & Jónmundsson (2011) estimated to be true in the years 2000-2009, with a generation interval for the sire of bull pathway of 7.9 years and selection intensity 1.44. A one-year lag was assumed from the selection of bulls until the birth of offspring. The proportional differences in generation interval and AA between the baseline situation
and the other situations were used to update
the predicted genetic progress from the sire of bull pathway. The values from the sire of dam pathway were modified with half of the
proportional difference. The overall genetic progress was then summed up, assuming no change on the dam of bull and dam of cow pathways. Genetic progress of MY and FY was predicted with the same method as for PY assuming the same selection pressure was applied as on PY.
RESULTS
Variance components and heritability estimated by the LAC2 model are presented in Table 2. Heritability of MY was higher (0.31) than of PY and FY (0.27) for the first lactation. Heritability of yields for the second and third lactation was lower than for the first lactation for all traits and ranged from 0.13 to 0.19. Genetic correlations between lactations were 0.9 or higher for all traits.
The RR model and LAC2 did not measure exactly the same traits, as the Pearson correlation between the AEBVs of progenytested bulls based on the two models ranged from 0.78 to 0.82 for the production traits (Table 3). The Spearman rank correlations were slightly lower. Higher correlations were obtained between the AEBVs with the RR and LAC1 models and LAC1 and
LAC2 models. The correlation between AEBVs for SCS based on the RR model and the LAC1 model was 0.94.
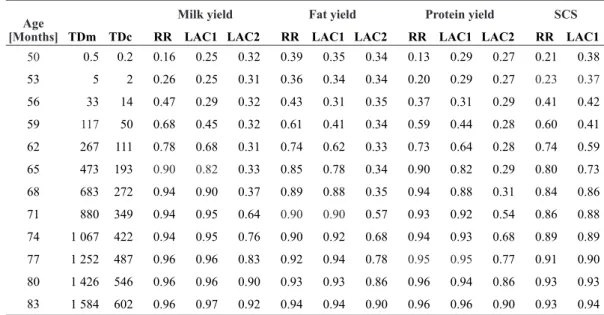
The first TD records of daughters of bulls in progeny testing became available around 50 months of age of the bulls (Table 4). At that age AA was low for all traits based on all models. With additional records the AA increased, fastest in the beginning for MY using the RR model. The AA of EBVs based on LAC2 increased later than when based on the other models for the production traits. The AA of EBVs for SCS increased earlier based on the RR model than on the LAC1 model. The level of AA when it reached a plateau was similar between the results from the RR model and the LAC1 model for all traits, while the AA of results from LAC2 did not reach a plateau within the study period.
Figure 1 shows predicted genetic progress for PY when bulls selected as proven at different ages and with the three different models. The progress was predicted highest when bulls were selected at 68 months of age with the RR model or 0.170 σa/yr, 8% higher than the highest predicted genetic progress using LAC2, which was 0.158 σa/yr for 83 months old bulls. The highest progress using LAC1 was predicted to be only slightly lower than with RR, 0.167 σa/
yr for bulls 71 months of age. For MY results from LAC1 and LAC2 gave 99% (71 months) and 94% (80 months), respectively, of the highest predicted progress using the RR model
Table 3. Pearson correlations (rp) and Spearman rank
correlation (rs) between EBVs of bulls with 1000 or more protein test-day records of daughters (n=75), using the complete dataset and comparing random regression (RR) model to the lactation yields from days 5 to 305 model (LAC1) and the lactation model used for routine genetic evaluation (LAC2).
RR - LAC1 RR-LAC2 LAC1-LAC2
Trait r p rs rp rs rp rs Milk yield 0.920 0.924 0.802 0.766 0.913 0.886 Fat yield 0.893 0.886 0.779 0.744 0.897 0.871 Protein yield 0.905 0.918 0.825 0.808 0.914 0.907 SCS 0.944 0.942
SCS: Somatic cell score
Figure 1. Predicted genetic progress (σa per year) for protein yield using the random regression mod-el (RR), lactation yimod-elds from days 5 to 305 modmod-el (LAC1) and the lactation model currently in use (LAC2) at different ages of selecting bulls as proven after progeny testing.
0.10 0.12 0.14 0.16 0.18 0.20 50 53 56 59 62 65 68 71 74 77 80 83 Ge ne tic pr og re ss [ σa ] Age [Months] RR LAC1 LAC2
Table 4. Mean number of test-day records of daughters of bulls for milk yield (TDm) and milk components (TDc) and Pearson correlation between EBVs and AEBV of AI bulls in progeny testing (n=78) at different ages.
Age [Months]
Milk yield Fat yield Protein yield SCS
TDm TDc RR LAC1 LAC2 RR LAC1 LAC2 RR LAC1 LAC2 RR LAC1
50 0.5 0.2 0.16 0.25 0.32 0.39 0.35 0.34 0.13 0.29 0.27 0.21 0.38 53 5 2 0.26 0.25 0.31 0.36 0.34 0.34 0.20 0.29 0.27 0.23 0.37 56 33 14 0.47 0.29 0.32 0.43 0.31 0.35 0.37 0.31 0.29 0.41 0.42 59 117 50 0.68 0.45 0.32 0.61 0.41 0.34 0.59 0.44 0.28 0.60 0.41 62 267 111 0.78 0.68 0.31 0.74 0.62 0.33 0.73 0.64 0.28 0.74 0.59 65 473 193 0.90 0.82 0.33 0.85 0.78 0.34 0.90 0.82 0.29 0.80 0.73 68 683 272 0.94 0.90 0.37 0.89 0.88 0.35 0.94 0.88 0.31 0.84 0.86 71 880 349 0.94 0.95 0.64 0.90 0.90 0.57 0.93 0.92 0.54 0.86 0.88 74 1 067 422 0.94 0.95 0.76 0.90 0.92 0.68 0.94 0.93 0.68 0.89 0.89 77 1 252 487 0.96 0.96 0.83 0.92 0.94 0.78 0.95 0.95 0.77 0.91 0.90 80 1 426 546 0.96 0.96 0.90 0.93 0.93 0.86 0.96 0.94 0.86 0.93 0.93 83 1 584 602 0.96 0.97 0.92 0.94 0.94 0.90 0.96 0.96 0.90 0.93 0.94
RR: Random regression model, LAC1: Model based on lactation until day 305 from calving, LAC2: Whole lactation model used for routine genetic evaluation, SCS: Somatic cell score.
Table 5. Mean number of test-day records of cows for milk yield (TDm) and milk components (TDc) and approximated accuracy of estimated breeding values of cows (n=13,106) at different times from first calving.
Months from first
calving
Milk yield Fat yield Protein yield SCS
TDm TDc RR LAC1 LAC2 RR LAC1 LAC2 RR LAC1 LAC2 RR LAC1
0 0.0 0.0 0.59 0.59 0.63 0.60 0.57 0.64 0.60 0.57 0.64 0.58 0.72 3 2.5 1.5 0.80 0.61 0.64 0.75 0.59 0.65 0.78 0.58 0.65 0.68 0.74 6 5.6 3.6 0.87 0.77 0.66 0.83 0.71 0.66 0.85 0.71 0.66 0.78 0.81 9 8.6 5.5 0.88 0.89 0.67 0.85 0.85 0.68 0.88 0.86 0.67 0.81 0.88 12 9.7 6.2 0.89 0.90 0.72 0.87 0.87 0.72 0.88 0.89 0.71 0.81 0.90 15 11.2 7.2 0.90 0.90 0.85 0.88 0.88 0.85 0.90 0.89 0.84 0.83 0.90 18 13.8 8.9 0.92 0.91 0.92 0.90 0.89 0.92 0.92 0.90 0.90 0.88 0.92 21 16.3 10.6 0.93 0.93 0.94 0.91 0.91 0.93 0.92 0.92 0.92 0.89 0.94 24 17.8 11.6 0.94 0.94 0.94 0.92 0.92 0.94 0.93 0.93 0.92 0.92 0.94 27 19.2 12.4 0.94 0.94 0.95 0.93 0.93 0.95 0.94 0.93 0.94 0.93 0.95 30 21.0 13.7 0.95 0.95 0.96 0.95 0.93 0.95 0.94 0.94 0.94 0.94 0.96 33 22.9 15.0 0.96 0.96 0.96 0.96 0.95 0.96 0.95 0.95 0.95 0.95 0.96
RR: Random regression model, LAC1: Model based on lactation until day 305 from calving, LAC2: Whole lactation model used for routine genetic evaluation, SCS: Somatic cell score.
(65 months). For FY the same proportions were 100% (68 months) and 96% (83 months), respectively, of RR at 68 months of age. Possible genetic progress was not estimated for the SCS, but the ratio of AA divided by generation length, which is proportional to expected genetic progress, was highest at 68 months of age based on the results of both models and almost identical in value.
In the 12 months after first calving on average 9.7 MY records and 6.2 milk component records (Table 5) were obtained. The AA measure was higher, before any records were obtained, for the cows than the bulls (Tables 4 and 5). The AA increased for the results of the RR model already three months after first calving. With LAC1 an increase was not notable until 6 months after first calving, and the results from LAC2 did not show an increase until 12 months after calving. The AA of EBVs was at the same level using the three models after 18 months from first calving. DISCUSSION
The heritability of LAC2 was lower than the heritability of lactation yields presented in Eiríksson et al. 2019 for all traits in all lactations, but higher than reported in previous studies for the breed (Sigurdsson 1993, Sigurdsson & Jónmundsson 2011). Other studies (Eiríksson et al. 2019 & Sigurdsson 1993) have also shown first lactation yields to be more heritable than later lactations, but the difference here is greater than presented before.
The three methods did not measure
exactly the same trait and did not result in identical ranking of animals (Table 3). The correlation between the results of the LAC2 and RR models was considerably lower than Lidauer & Mäntysaari (1999) presented when comparing RR model to official lactation model evaluations. The models were supposed to be evaluating the same trait, lactation yields, but some differences were present regarding which information entered into the evaluation that could affect the exact genetic trait they were evaluating. LAC2 included information on yields later than 305 days in milk, which was not included in LAC1 and RR. Genes making
prolonged lactation possible could thus have had more effect on LAC2 than LAC1 and RR. Another difference was the correction for calving interval in LAC2 that was not included in the other models. Additionally, the three models did not treat records from TD when milk samples were missing in the same manner; the RR model always assumed PY, MY and SCS missing in these cases, LAC1 used close samples to some extent and LAC2 did not allow for missing records, using average values rather than leaving records missing. The high genetic correlation between EBVs for SCS between RR and LAC1 models suggests that these two
methods did measure the same characteristics
of the cows regardless of the difference in heritability presented in Eiríksson et al. 2019.
The genetic evaluation considered to be the AEBV obviously does not represent the true breeding value and the correlation between that and EBVs is thus not reliable as an absolute measure of accuracy. However, for progeny tested bulls the difference should be negligible. In addition, the absolute values were not of primary interest, and the comparison between methods was not dependent on those. The AEBVs for cows were only to a limited extent based on progeny so only a cow´s own records in addition to pedigree information contributed to the estimates considered to be AEBV here. This AEBV was thus further away from the true breeding value and relied more on pedigree information. This resulted in higher accuracy estimates in the beginning (Table 5) than was expected. However, the different rates of increase in AA still illustrated the difference between the three models.
For the bulls investigated, the initial EBVs (Table 4) resulted in lower AA values than would be expected for animals whose parents had accurate EBVs, especially for MY, PY and SCS with the RR model. The dams of bulls chosen for progeny testing did not all have accurate EBVs, which could partly explain these low numbers, but not the difference between the RR results and the other. Biased estimates for some groups of animals in the RR results could yield this lower numbers. Bias
testing was not performed, but we have no other reason to believe the results could be biased. First records of cows should become available 2 months after first calving for the RR model, 6 months after first calving for LAC1, and at second calving for LAC2. This was probably the main explanation for the earlier increase in AA using RR and LAC1 compared to LAC2. Sigurdsson and Jónmundsson (2011) found the realized generation interval for sires of bulls to be 7.9 years. Assuming one year on average from selection of sire until birth of offspring, then selection is performed when the bulls are 6.9 years old or 82.8 months of age. At that age the difference in AA between the models was minor. Keeping the same generation interval and implementing a new model is thus not likely to result in a major increase in genetic progress. The predicted genetic trend for PY using the LAC2 model (Figure 1) was highest when the bulls were 83 months of age, which is in agreement with the realized generation interval. The highest predicted genetic trend for the RR and LAC1 models occurred at a younger age and was higher than for LAC2 (Figure 1). The faster predicted progress thus resulted predominantly from a shorter generation interval by selecting proven bulls at a younger age. This is in agreement with the results of Padilha et al. (2016) which found a greater increase in average reliability of EBVs of bulls with a small number of progeny than for bulls with a great number of progeny when comparing the results of an RR model and a 305-day lactation model for FY and PY.
The genetic progress estimated here only considered the sire of cows and sire of bull pathways. Selection decisions on calves from cows from 3 to 18 months after first calving (Table 5) will be based on EBVs with higher AA using the RR model compared to LAC2 and should thus contribute to faster progress from the dam of bull pathway. Padilha et al. (2016) found more gain in the reliability of the EBV of cows with 6-10 test-day records than they did for bulls with varying progeny size when comparing results of an RR model to a 305-day lactation model. Consequently, the potential
progress is likely to be considerably higher than was estimated here.
The RR model did show considerable advantage over LAC1 in terms of predicted genetic progress for PY, but for other traits practically no difference was evident. The advantage of applying RR rather than LAC1 could however be more than the predicted progress indicates because of other benefits of RR, such as selection for persistency (e.g. Dzomba et al. 2010). LAC1 can lead to a downward bias in EBVs of bulls giving daughters with persistent lactations because the model extrapolates lactations in progress or if cows are culled before the end of lactation.
The official breeding goal includes other traits that were not considered in this study. The main objective of the breeding plan is to increase
PY and no weight is put on MY and FY in the
total merit index. The weight on PY is 37.4% and in order to keep protein content stable, a 6.6% weight is placed on protein percentage, based on estimates of genetic correlation. The SCS has a weight of 8% in the index. The other 48% is divided equally between fertility, longevity, udder, teats, milking ease and temperament. Udder, teats, milking ease and temperament are all evaluated in first lactation and the accuracy of the EBVs for these traits should thus not be compromised if bull selection is made earlier, and progress could also benefit from a shorter generation interval. Fertility is currently defined as the calving interval in the genetic evaluation. In 2000-2009 selection for this trait resulted only in minor improvement (Sigurdsson & Jónmundsson 2011). Fertility and production are known to be unfavourably correlated in other breeds (Van Raden 2006) and selection pressure on fertility becomes more important if selection emphasis on production is increased. Low heritability and late availability of information on calving interval could result in even poorer progress in selection for fertility if the bulls are selected at a younger age. Another concern is that the RR model did not include correction for days in gestation, which could increase the risk for higher production EBV to be connected to low fertility compared
to LAC2, which includes calving interval in the model. These negative effects could be reduced or eliminated by changing the genetic evaluation of fertility to traits measured earlier in the lifespan of the cow rather than the calving interval. Days open measures the same trait and provides information earlier and Ragnarsdóttir (2011) found that trait having similar heritability to that of calving interval. Traits measured on heifers give results even earlier in the lifespan and Ragnarsdóttir (2011) estimated higher heritability of age at first insemination than for other traits included in her study. Heifer fertility is not as unfavourably correlated to production as fertility during lactation (Roxström et al. 2001). Other options include number of inseminations on different lactations, non-return rates, and days from first insemination to the last (Ragnarsdóttir 2011, Roxström et al. 2001). A combination of two or more traits in a multitrait analysis is likely to be the way to go, as Ragnarsdóttir (2011) suggested.
Longevity is currently estimated with survival analysis, which can give estimates earlier than many other methods to describe the trait (Benjamínsson, 2003). Still the earlier selection of bulls results in much less information about longevity and could therefore reduce progress for the trait. However, tools for more improvement in SCS could increase progress in udder health, which is the most common cause of culling of dairy cows in Iceland.
Genomic selection has not yet been implemented for the Icelandic dairy population and this study is focused on the current progeny testing methods. The ability of genomic selection to shorten generation intervals and increase genetic progress (Schaeffer, 2006) is expected to result in much faster progress than is possible, based on the results of this study. However, good genetic evaluations are important to successfully implement genomic selection and RR models for production traits can be a part of that.
CONCLUSIONS
Implementing an RR test-day model for production traits for the Icelandic dairy cow
population could increase the rate of genetic progress of PY by more than 8% compared to the current lactation model. The main pathway of this increased progress is a shorter generation interval from sire to offspring because records can be utilized earlier. There is a risk that implementing the RR model could have a negative impact on selection for fertility unless the genetic evaluation for these traits is improved simultaneously.
ACKNOWLEDGEMENT
Financial support from the Cattle Productivity Fund is gratefully acknowledged.
REFERENCES
Adalsteinsson S 1981. Origin and conservation of farm animal populations in Iceland. Jounal of Animal Breeding and Genetics98, 258–264. Benjamínsson BH 2003. Kynbótamat fyrir endingu
mjólkurkúa [Estimated breeding for longevity of dairy cows]. Ráðunautafundur 2003, 149-167. [In Icelandic].
Dzomba EF, Nephawe KA, Maiwashe AN, Cloete SWP, Chimonyo M, Banga CB, Muller CJC & Dzama K 2010. Random regression test-day model for the analysis of dairy cattle production data in South Africa: Creating the framework. South African Journal of Animal Science 40, 273–284. https://doi.org/10.4314/sajas.v40i4.65235
Eiríksson JH, Sigurdsson Á, Jóhannesson G & Eythórsdóttir E 2019. Genetic parameters for Icelandic dairy cows using a random regression test-day model. Icelandic Agricultural Sciences
32, 3-16.
https://doi.org/10.16886/IAS.2019.01
Jónsson MB & Jónmundsson JV 1974. Kynbótaskipulag fyrir íslenska kúastofninn [Breeding plan for the Icelandic dairy population].
Íslenskar Landbúnaðarrannsóknir 6, 49–60. [In Icelandic]
Kantanen J, Olsaker I, Holm L-E, Lien S, Vilkki J, Brusgaard K, Eythorsdottir E, Danell & B Adalsteinsson S 2000. Genetic diversity and population structure of 20 North European cattle breeds. Journal of Heredity 91, 446–457.
Madsen P & Jensen J2012. A Users Guide to DMU: A package to analysing multivariate mixed models. Version 6, release 5.1. University of Aarhus, Research Center Foulum, Denmark, 32 p.
Misztal I, Tsuruta S, Lourenco D, Masuda Y, Aguilar I, Legarra A & Vitezica Z 2016. Manual for BLUPF90 Family of Programs. Athens, USA: University of Georgia. Accessed 15.11.2016 at http://nce.ads.uga.edu/wiki/lib/exe/fetch. php?media=blupf90_all2.pdf
Lidauer MH & Mäntysaari EA 1999. Multiple trait reduced rank random regression test-day model for production traits. Interbull Bulletin 22, 74–79. Lidauer MH, Pösö J, Pedersen J, Lassen J, Madsen
P, Mäntysaari, EA, Nielsen US, Eriksson J, Johansson K, Pitkänen T, Strandén I & Aamand, GP 2015. Across-country test-day model evaluations for Holstein, Nordic Red Cattle, and Jersey. Journal of Dairy Science 98, 1296–1309. https://doi.org/10.3168/jds.2014-8307
Padilha PH, Cobuci JA, Daltro DdS & Neto JB 2016. Reliability of breeding values between random regression and 305-day lactation models.
Pesquisa Agropecuária Brasileira 51, 1848-1856. https://doi.org/10.1590/S0100-204X2016001100007 Ptak E & Schaeffer LR 1993. Use of test day yields
for genetic evaluation of dairy sires and cows.
Livestock Production Science 34, 23–34.
Ragnarsdóttir JÞ 2011. Frjósemiseiginleikar íslenskra kúa – Þættir til að meta frjósemi [Fertility traits of Icelandic dairy cows – factors for evaluation of fertility]. B.Sc. thesis. Agricultural University of Iceland, 34 p. Accessed 05.04.2017 at http://hdl.handle.net/1946/9255 [In Icelandic]
Ráðgjafarmiðstöð landbúnaðarins n.d.
Ræktunarmarkmið f. ísl. kúakynið [Breeding objective for the Icelandic dairy cow]. Accessed 22.06.2017, at https://www.rml.is/is/kynbotastarf/ nautgriparaekt/raektunarmarkmid-f-isl-kuakynid [In Icelandic]
Roxström A, Strandberg E, Berglund B, Emanuelson U & Philipsson J 2001. Genetic and environmental correlations among female fertility traits and milk production in different parities of Swedish Red and White dairy cattle. Acta Agriculturae Scandinavica, Section A — Animal Science 51, 7-14
Schaeffer LR 2006. Strategy for applying genome-wide selection in dairy cattle. Journal of Animal Breeding and Genetics123, 218–223.
https://doi.org/10.1111/j.1439-0388.2006.00595.x Schaeffer LR & Dekkers JCM 1994. Random
regressions in animal models for test-day production in dairy cattle. In: Proceedings of the 5th World Congress of Genetics Applied to Livestock Production. Vol. 18, 443–446. Guelph: University of Guelph.
Sigurdsson Á 1993. Estimation of genetic and phenotypic parameters for production traits of Icelandic dairy cattle. Acta Agriculturae Scandinavica, Section A — Animal Science 43, 81–86.
Sigurðsson Á 1997. Kynbótamat fyrir frumutölu [Estimated breeding values for somatic cell count].
Nautgriparæktin 14, 9–17. [In Icelandic]
Sigurdsson Á & Jónmundsson JV 2011. Genetic potential of Icelandic dairy cattle. Icelandic Agricultural Sciences 24, 55–64.
Van Raden PM 2006. Fertility trait economics and correlations with other traits. Interbull Bulletin 34, 53-56.
Manuscript received 20 November 2018 Accepted 26 August 2019