ANALYSIS OF INDONESIA’S AUTOMOTIVE
COMPONENT EXPORT BY COUNTRY OF
DESTINATION USING MULTIVARIATE
ANALYSIS
Dedy Sugiarto, Triwulandari S. Dewayana, Dorina Hetharia, Tiena Gustina A
Trisakti University, Faculty of Industrial Technology
Kyai Tapa 1, Jakarta 11550, Indonesia
[email protected]
Abstract
The aim of this paper was to present an overview of Indonesia’s automotive component
export by the country of destination. The data were taken from the Statistics Indonesia (Badan
Pusat Statistik/BPS) of 2014, particularly the code of HS8708. Descriptive statistics, cluster
analysis and principal component analysis were used in the analysis. The results showed that
histogram of total export value indicated that the curve was skewed to the right which means
there were some extreme values on the right. The largest export value, subsequently, came
from Thailand, Japan, and Malaysia. Based on dendogram of the cluster analysis, there were
five clusters of country of destination. Meanwhile the countries of destination include
Thailand, Japan, Malaysia, Brazil, Mexico, and others. Biplot principal component analysis
identified the diverse characteristics of export destination countries among clusters. Gear
boxes, clutches, and chasis frames were mostly demanded by Thailand; most of road wheels
and part of radiators were exported to Japan; numbers of fuel tanks were sent to Malaysia;
drive axles were mostly exported to the cluster of China, United Kingdom, and Philippines;
while high demand of radiator spare-parts were obtained from United States.
Keywords: automotive component export, cluster analysis, principal component
analysis, biplot.
Presenting Author’s biography
Dedy Sugiarto is a lecturer in Master Program of Industrial Engineering, Faculty of Industrial Technology, Trisakti University, Jakarta. He obtained a bachelor degree from Department of Statistics Bogor Agricultural Institute, Master of Management from Trisakti University. and PhD from the Department of Agriculture Industrial Technology Bogor Agricultural Institute. The research topics of interest are applied statistics and knowledge management. E-mail : [email protected] and [email protected]
1. Introduction
are joint venture with high-level technological dependence [1]. The ability of the automotive component industry in Indonesia can be seen through its export capability. Classification code commonly used in world trade is based on the HS code (Harmonized System).
Overally, Indonesia’s automotive industry has been exporting automotive products ranging from motorcycles, cars and a wide range of components to many countries. In 2013, total export of automotive products (HS 87) reached the value of US $ 4.6 billion. Of the total value of the automotive component belonging to the group HS 8708 in the form of components and accessories contributed 31.04% of the total exports [2].
Export data of HS 8708 is in the form of a matrix of quite complex data because it consists of a wide range export commodities as well as many destination countries. To extract information from the data, statistical techniques are required. Thus, the aim of this paper was to present an overview of Indonesia’s automotive component export by country of destination using some descriptive statistical and multivariate analysis techniques. The objectives were to describe variation of total value of export among country of destination using histogram, to identify groups of country of destination using cluster analysis (CA), and to identify the clusters by graphing the clusters and commodities in a single display using biplot principal component analysis (PCA).
Both techniques were performed to explain the situation in the export of automotive components and furthermore can be used as a basis for decision and policy considerations associated with exports to the countries of destination. Research on the use of cluster analysis and PCA in the data analysis of export destinations has been caried out by Handoko and Sunaryo [3]. They used data of various export commodities such as palm oil and rubber.
2. Methods
This study consisted of several stages. The first is collecting export data from Statistics Indonesia
(Badan Pusat Statistik/BPS). The data was based on Indonesia’s Export Statistic in 2014 [4]. The
next stage was to develop data matrix with rows which elaborated the destination countries and columns described the group HS with code 8708. There was a total of 116 countries and 96 commodities. Descriptive statistical analysis was used to analyze the total value of automotive component export to various destinations. Cluster analysis was used to determine the group of 116 countries based on their similarity. CA is one of multivariate technique that can produce a classification scheme of individual observations, depending on their relative similarity or nearness to an array of different variables. The basic idea is one of dividing a specific data profile into segments by creating maximum homogeneity within and maximum distance between groups of observations [5].
Principal component analysis and biplot then ware used to explain the grouping. PCA is a technique for forming new variables which are linear composites of the original variables [5]. PCA is a reduction data technique because compress a large number of variable to small data. The maximum number of new variables that can formed is equal to the number of original variables, and new variables are uncorrelated among themselves [5].
3. Results and Discussion Descriptive Statistics
was in the 3rd rank in the world, Thailand in the 12th, Indonesia in the 15th, and Malaysia in 23rd [6].
The first was China and the second was USA. Based on those data, Thailand was the largest car production in ASEAN and of course requires a lot of components from both domestic and imported from neighboring countries including Indonesia. Malaysia with its national car project also requires components from Indonesia. While Japan and Indonesia has a long history dealing with the development of the automotive industry.
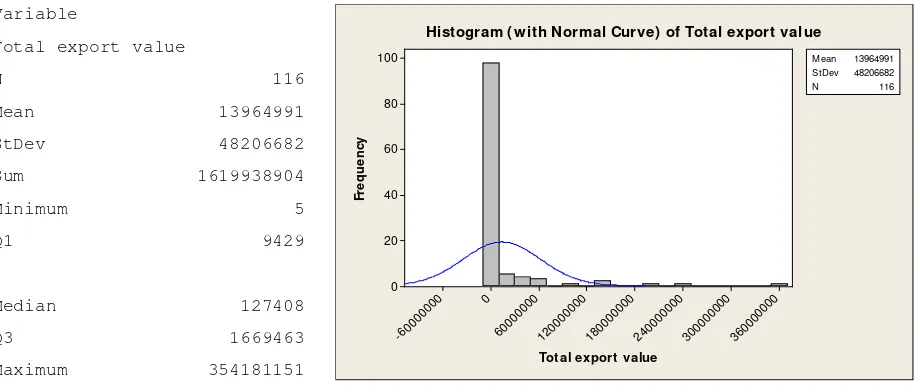
Variable
Histogram ( with Normal Curve) of Total export value
Fig. 1 Descriptive statistics and histogram of total export value
Tab. 1 Top fifteen largest HS 8708 export destination
No Country of Destination Export Value (US
$)
7 UNITED STATES 57,714,054
8 INDIA 52,770,301
14 UNITED KINGDOM 22,036,017
15 PAKISTAN 13,831,630
Indonesia to serve the needs of the automotive vehicle assembly or replacement of component (after sales service). Meanwhile, based on the type of commodity, it can be seen that the gear boxes is ranked first in terms of export value, followed by road wheels, clutches and other parts (Tab. 2).
Tab. 2 Top ten largest export HS 8708 commodity
No HS Code Commodity
Export Value (US$)
1 8708402600 Gear boxes assembled for transport of persons 532,920,055
2 8708999000
Other parts, accessories for other vehicles of heading
8701-8705 112,645,140
3 8708701600 Road wheels of hub-caps for transport of person 112,468,889
4 8708703200
Road wheels of wheels not fitted with tyres for transport
of person 105,965,317
5 8708299500 Other parts and accessories for transport of person 71,932,475
6 8708936000
Clutches and parts there of for vehicles transport of
persons 67,938,381
7 8708997000 Other chasis frames or parts- 67,488,298
8 8708502600
Drive-axles with differential, assembled for transport of
persons 64,334,685
9 8708919900
Part of radiators for vehicles of person, goods, special
purpose 47,067,712
10 8708992100 Fuel tanks for vehicles transport persons or goods 46,085,572
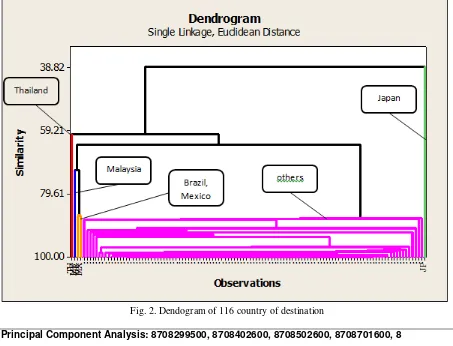
Cluster Analysis
Grouping of country of destination was analyzed by cluster analysis. Dendogram or classification tree is the standard output of hierarchical cluster and can be seen if Fig. 2. The number of clusters can be easily determined by specifying the cutting point horizontally. Based on dendogram, there were 5 clusters consisting of: Cluster 1 (Thailand), Cluster 2 (Japan), Cluster 3 (Malaysia), Cluster 4 (Brazil and Mexico), and Cluster 5 (other countries of destination).
Principal Component Analysis
PCA then was used to explain the clusters. It showed that the first principal component and the second principal component can illustrate the diversity of data at 68.2 %. This figure shows that 68.2% of the diversity that occurs in the data can be explained through the first and second axis of the principal components. When the three major components were included, the percentage of the diversity that can be explained reached 90.6 % as shown in Fig. 3.
Fig. 2. Dendogram of 116 country of destination
Principal Component Analysis: 8708299500, 8708402600, 8708502600, 8708701600, 8
Eigenanalysis of the Correlation Matrix
Eigenvalue 3.6493 3.1671 2.2438 0.9398 0.0000 0.0000 0.0000 -0.0000 Proportion 0.365 0.317 0.224 0.094 0.000 0.000 0.000 -0.000 Cumulative 0.365 0.682 0.906 1.000 1.000 1.000 1.000 1.000
Eigenvalue -0.0000 -0.0000 Proportion -0.000 -0.000 Cumulative 1.000 1.000
Variable PC1 PC2 8708299500 0.387 -0.188 8708402600 0.059 0.487 8708502600 0.400 -0.183 8708701600 -0.169 -0.456 8708703200 -0.059 -0.512 8708919900 0.331 -0.413 8708936000 0.225 0.104 8708992100 -0.274 0.003 8708997000 0.453 0.189 8708999000 0.464 0.084
Fig. 4 Biplot of clusters and top ten export commodity (HS 8708)
4. Conclusion
1. The total value of exports of HS 8708 commodities (automotive parts) to all country of destinations in 2014 had reached 1.62 billion USD. Histogram of total export value indicated that curve was skewed to the right which means there were some extreme values on the right. They were total value of export to Thailand, Japan, and Malaysia. The high value indicated the special trade relations between Indonesia with these three countries particularly on automotive components
2. In 2014, Thailand was the largest export destination with the total value of 354.18 million USD, and was followed by Japan, Malaysia, and other countries.
3. The highest demand in export was gear boxes, followed by road wheels, clutches, and other parts. 4. Grouping of country of destination resulted five major clusters, namely, Cluster 1 Thailand, Cluster
2 Japan, Cluster 3 Malaysia, Cluster 4 Brazil and Mexico, and Cluster 5 other countries of destination.
5. Biplot principal component analysis indicated that the export destination countries among clusters showed different characteristic. Gear boxes, clutches and chasis frames were mostly exported to Thailand. Road wheels and part of radiators were mostly exported to Japan. Fuel tanks were mostly exported to Malaysia. Drive axles were mostly exported to the cluster of (China, United Kingdom, Philippines), while a high number of radiator spare-parts was sent to United States.
Acknowledgment
This study is part of research that aims to develop a map of Indonesian automotive components industry funded by Ministry of Research, Technology and Higher Education Republic of Indonesia 2015.
References
[2] Ministry of Trade. Perkembangan Komponen Otomotif di Indonesia. Warta Ekspor. Ditjen PEN/MJL/005/7/2014. 2014.
[3] J. Handoko, S. Sunaryo. Analisis Pengelompokkan Negara-Negara Importir Produk Indonesia Berdasarkan Faktor Barang Industri. Jurnal Sains dan Seni POMITS. Vol 3, No 2, 2337-3520. 2014.
[4] Badan Pusat Statistik. Statistik Ekspor Indonesia 2014. 2014. http://www.bps.go.id/
[5] S. Sharma. Applied Multivariate Technique. New York : John Wiley & Sons. 1996.