GENOTYPE ENVIRONMENT INTERACTION OF YIELD
COMPONENTS, YIELD, AND AROMA IN AROMATIC
NEW PLANT TYPE (NPT) PROMISING RICE LINES
ANGELITA PUJI LESTARI
GRADUATE SCHOOL
BOGOR AGRICULTURAL UNIVERSITY
BOGOR
DECLARATION OF AUTHENTICATION
I hereby declare that this thesis of “Genotype Environment Interaction of Yield Components, Yield, and Aroma in Aromatic New Plant Type (NPT) Promising Rice Lines” is my original work with the guidance from advisory committee and has never been proposed to any other university or institution. Information cited from either published or unpublished reference were explicitly mentioned in the manuscript and listed in the reference at the end part of the thesis.
Bogor, August 2010
ABSTRACT
ANGELITA PUJI LESTARI. Genotype Environment Interaction of Yield Components, Yield, and Aroma in Aromatic New Plant Type (NPT) Promising Rice Lines. Under supervision of HAJRIAL ASWIDINNOOR (Chairman), BUANG ABDULLAH, and AHMAD JUNAEDI (members of advisory committee).
Quality of rice grain is determined by physical appearance and chemical content of the grain. Generally, consumers prefer good quality rice grain. Therefore, rice breeding program will focus on not only quantity, but also on quality of rice grains. Good quality of rice grains in the market is identified by consumers from their aroma and taste. The objectives of this research were to evaluate the level of grain yield and aromatic character of rice grain of breeding lines, to study the stability of yielding ability aromatic character, and yield potential of NPT lines in response to different environmental condition. The study was conducted from July 2009 through April 2010, at two planting seasons (2009 DS and 2009/2010 WS), in two locations, Bogor (200 m ASL) and Pusakanagara (8 m ASL). The design used was Randomized Complete Block Design (RCBD), with three replications. The study tested 35 NPT aromatic lines and two varieties Ciherang and Sintanur as check varieties. The 21 day-old seedlings were planted one seed per hole, at a spacing of 20 cm x 20 cm. The size of experiment plots planted to NPT lines was 2 x 5 m2 per line. Stability of all characters was analyzed using regression coefficient (bi), average value of yield and AMMI. Aroma was analyzed by using three methods, namely: leaf aroma with KOH, rice aroma test in the test tube, and cooked rice. Crops protection against pests and diseases were controlled optimally. Coefficient of genetic variation (CGV), heritability, and genetic advance were high for productive tillers, number of filled and total grain per panicle. There was a positive correlation between those characters and grain yields. There were lines yielded more than Ciherang, but mostly did not differ significantly, i.e. IPB 116-F 3-1, IPB 116-F 46-1, IPB 1F 14-2, IPB 1F 17-4 and MR-B11738-1-2-Si -1-2. Stability analysis of Finlay-Wilkinson and AMMI did not show the same results of lines stability. Four lines that were aromatic identified by different methods, were: IPB 140-F-6, B11249-9C-PN-3-3-2-2-MR-1, B11742-RS*2-3-MR-34-1-2-B11249-9C-PN-3-3-2-2-MR-1, and B11955-MR-84-1-4. Lines which parents were introduced from the high altitude of South Sulawesi did not show consistent aroma when tested using different aroma testing methods. All lines tested had good grain quality.
ABSTRAK
ANGELITA PUJI LESTARI. Genotype Environment Interaction of Yield Components, Yield, and Aroma in Aromatic New Plant Type (NPT) Promising Rice Lines (Interaksi Genotipe Lingkungan dari Komponen Hasil, Hasil, dan Aroma pada Beberapa Galur Harapan Padi Tipe Baru (NPT) Aromatik. Dibawah bimbingan HAJRIAL ASWIDINNOOR (ketua komisi pembimbing), BUANG ABDULLAH dan AHMAD JUNAEDI (anggota).
Kualitas gabah ditentukan oleh penampilan fisik dan kandungan kimia nya. Umumnya, konsumen lebih memilih gabah berkualitas baik. Oleh karena itu, beras hasil pemuliaan tidak hanya berfokus pada kuantitas, tetapi juga kualitas beras. Kualitas beras yang baik dilihat dari aroma dan rasa. Tujuan penelitian ini adalah untuk mengevaluasi tingkat hasil gabah dan karakter aromatik gabah, untuk mempelajari stabilitas dan adaptabilitas, serta karakter aromatik, dan potensi hasil beberapa galur padi tipe baru (PTB) sebagai respon terhadap kondisi lingkungan yang berbeda. Penelitian dilaksanakan pada bulan Juli 2009 - April 2010 di dua musim tanam dan dua lokasi, Bogor (250 m dpl) dan Pusakanagara (8 m dpl). Rancangan yang digunakan adalah rancangan acak lengkap (RAK), tiga ulangan. Bahan yang digunakan adalah 35 galur harapan NPT aromatik dan dua varietas pembanding, Ciherang dan Sintanur. Bibit yang berumur 21 hari, ditanam satu biji per lubang, dengan jarak tanam 20 cm x 20 cm, ukuran plot 2 x 5 m2. Aroma dianalisis dengan tiga metode, yaitu: aroma daun dengan KOH, uji aroma beras dalam tabung reaksi, dan uji nasi. Budidaya tanaman dan pengendalian terhadap hama penyakit dilakukan secara optimal. Stabilitas dianalisis menggunakan nilai koefisien regresi (bi) dan rata-rata hasil serta analisis AMMI. Hasil penelitian menunjukkan bahwa nilai koefisien keragaman genetik (KKG), heritabilitas, dan kemajuan genetik tinggi untuk karakter jumlah anakan produktif, jumlah gabah isi per malai, dan jumlah total gandum, dan terdapat korelasi positif antara karakter tersebut dengan hasil. Beberapa galur memiliki hasil lebih dari Ciherang tapi sebagian besar tidak berbeda nyata, yaitu IPB F-3-1, IPB 116-F-46-1, IPB 117-F-14-2, IPB 117-F-17-4 dan B11738-MR-1-2-SI-1-2. Analisis stabilitas Finlay-Wilkinson dan AMMI tidak menunjukkan galur-galur dengan stabilitas hasil yang sama. Terdapat empat galur yang teridentifikasi aromatic berdasarkan ketiga metode uji, yaitu: IPB 140-F-6, B11249-9c-PN-3-3-2-2-MR-1, B11742-RS*2-3-MR-34-1- 2-1, dan B11955-MR-84-1-4. Galur dengan tetua yang berasal dari dataran tinggi Sulawesi Selatan tidak menunjukkan konsistensi aroma saat diuji dengan berbagai metode pengujian aroma. Seluruh galur yang diuji memiliki mutu beras baik.
SUMMARY
ANGELITA PUJI LESTARI. Genotype Environment Interaction of Yield Components, Yield, and Aroma in Aromatic New Plant Type (NPT) Promising Rice Lines. Under supervision of HAJRIAL ASWIDINNOOR, BUANG ABDULLAH, and AHMAD JUNAEDI.
There are two major programs to increase yielding ability and quality of rice grain and the stability of both characters through rice breeding. Resistances against biotic and abiotic stresses are prerequisite for rice variety having high yielding ability and good grain quality. The program to increase yield potential has been pursued by creating new plant type (NPT) and hybrid rice varieties. This research tested NPT rice lines that might have different productivity and grain quality. Aroma is one major indicator of good quality of rice grains. Consumer preference to aromatic rice is considered by traders in the rice market. 2 AP, 2-acetyl-1-pyrroline is a compound determining aroma of rice grain. Individual phenotype is affected by genotype (G), environment (E), and their interaction (G x E interaction). Stability analysis is important to characterize the appearance of varieties in different environmental condition.
The objectives of this research were to evaluate the level of rice grain aroma of NPT lines, to observe stability of the aromatic character under various environmental conditions (seasons and locations), and to investigate yielding ability of NPT lines in different environmental condition. Research tested 35 aromatic NPT promising lines, with Ciherang and Sintanur as the check varieties, in two locations (Bogor and Pusakanagara) and in two season, 2009 dry and wet season (DS and WS). The lines were resulted from breeding program of Bogor Agricultural University and Indonesian Center for Rice Research. Agronomic characters, yield components and yields were data collected. Aroma was analyzed utilizing three methods, i.e. leaf aroma using KOH solution, rice aroma tested in the test tube, and rice aroma of cooked rice grains. Grain quality was tested at laboratory in the Muara experimental farm. Finlay-Wilkinson and AMMI (Additive Main Effects and Multiplicative Interaction) were used for stability analysis.
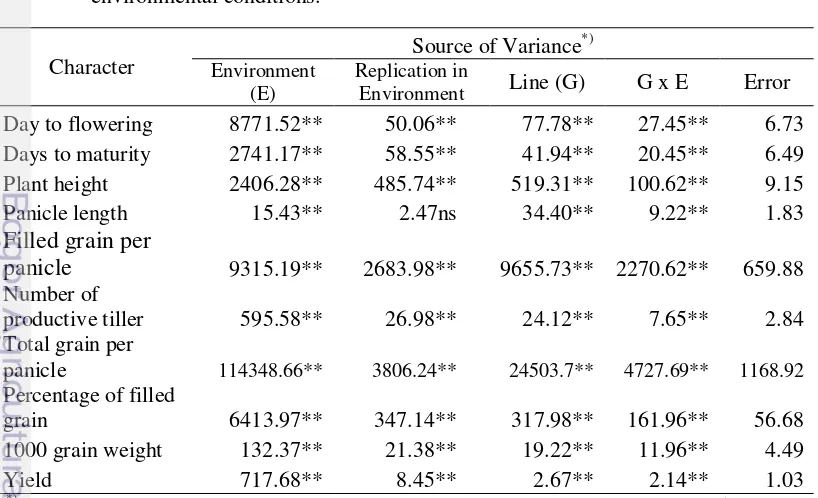
Results of combined analysis of variance of all characters showed that lines, the environment, and the interaction between lines and the environment were significantly different. In another words, the characters of individual lines reacted differently to the environmental conditions. There was no significant different of panicle length of each replication in a single environment.
Some early duration NPT lines started flowering 85 days after sowing (DAS), while medium duration of NPT lines was 116 – 127 DAS. Plant height in Bogor in 2009 WS was taller than the other environmental conditions but they were not significantly different in Pusakanagara in 2009 DS. Panicle length, on the average, was significantly longer in Pusakanagara in 2009 WS than the other compared with those in the other seasons.
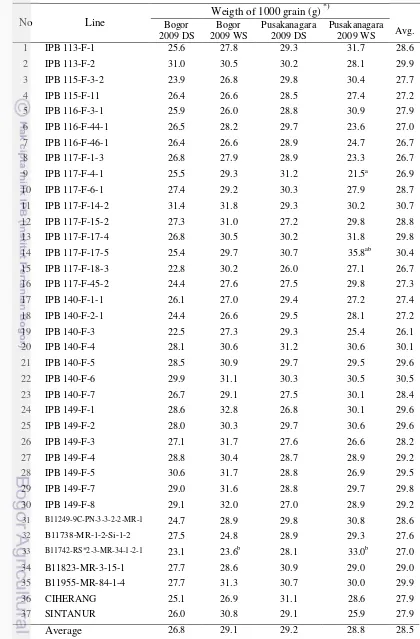
2009 WS/DS and in Pusakanagara in 2009 WS; it ranged from 28 to 29 grams. Percentage of filled grain was relatively low.
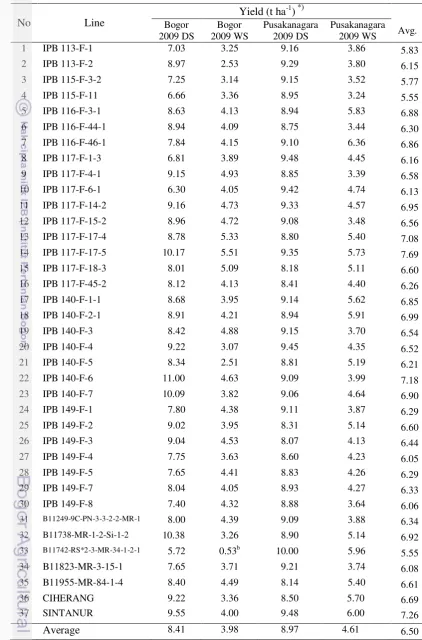
The coefficient of genetic variability (CGV), heritability, and genetic advance were high for the number of productive tillers, number of grains per panicle, and grain total. There was significant positive correlation between grain yield and the three characters. Stability analysis of Finlay-Wilkinson of several lines showed the regression coefficient that was not significantly different from one, with yield above the general mean, i.e. 116-F-3-1, IPB 117-F-4-1, IPB-117-F-14-2, IPB 117-F-15- 2, IPB-117-F-17-5, IPB 140-F-1-1, IPB 140-F- 2-1, IPB 140-F-3, and IPB 149-F-2, including Ciherang and Sintanur. Those lines were stable in different environmental conditions and widely adaptable. AMMI method showed lines adapted to specific location, namely: IPB 117-F-17-5, IPB 140-F-6, IPB 140-F-7 lines adapted to environment 1 (Bogor, 2009 DS); IPB 140-F-3 was specific to environment 2 (Pusakanagara, 2009 DS); lines specific to environment 3 (Bogor, 2009 WS) were IPB 113-F-1, IPB 117-F-6- 1, IPB 117-F-1-3; IPB 116-F-46-1 and B11742-RS*2-3-MR-34-1-2-1 were specific to environment 4 (Pusakanagara, 2009 WS). Four aromatic lines identified by different methods, were: IPB 140-F-6, B11249-9C-PN-3-3-2-2-MR-1, B11742-RS*2-3-MR-34-1-2-1, and B11955-MR-84-1-4.
Percentage of milled rice grains was above 65%; range of head rice yields varied from 38% to 74%. Levels of amylose content were between medium to high. The highest amylose content owned by B11742-RS*2-3-MR-34-1-2-1 (26.3%) with cooked rice texture was hard. Gelatinization temperature of some lines were intermediate (70 – 74 oC) and some were relatively low (55 – 69 oC).
Copyright@2010, Bogor Agricultural University
Copyright are protected by law,
GENOTYPE ENVIRONMENT INTERACTION OF YIELD
COMPONENTS, YIELD, AND AROMA IN AROMATIC
NEW PLANT TYPE (NPT) PROMISING RICE LINES
ANGELITA PUJI LESTARI
Thesis
submitted as partial fulfillment for the degree of Master of Science
at the Major of Plant Breeding and Biotechnology
GRADUATE SCHOOL
BOGOR AGRICULTURAL UNIVERSITY
BOGOR
Thesis Title : Genotype Environment Interaction of Yield Components, Yield, and Aroma in Aromatic New Plant Type (NPT) Promising Rice Lines
Name : Angelita Puji Lestari
SRN : A253080011
Approved by Advisory Committee
Chairman
Dr. Ir. Hajrial Aswidinnoor, M.Sc.
Dr. Ir. Buang Abdullah, M.Sc. Dr. Ir. Ahmad Junaedi, M.Si.
Member Member
Approved by
Coordinator of Major of Plant Dean of the Graduate School Breeding and Biotechnology
Dr. Ir. Trikoesoemaningtyas, M.Sc. Prof. Dr. Ir. Khairil A. Notodiputro, M.S.
ACKNOWLEDGEMENTS
The author wishes to express gratitude to the Chairman of the Supervisory Comittee Dr. Ir. Hajrial Aswidinnoor, M.Sc, and Co-Chairman Dr. Ir. Buang Abdullah, M.Sc and Dr. Ir. Ahmad Junaedi, M.Si for their active guidance and valuable advice during the research work with the title Genotype Environment Interaction of Yield Components, Yield, and Aroma in Aromatic New Plant Type (NPT) Promising Rice Lines. I also would like to express my great gratitude to Dr. Ir. Trikoesoemaningtyas M.Sc and Dr. Ir. Darda Efendi, M.Sc for the correction and suggestion during the defense.
I gratefully acknowledge the SEAMEO-SEARCA (Southeast Asian Regional Center for Graduate Study and Research in Agriculture), Philippines for the scholarship and the opportunity given to me in pursuing my master program at the Major of Plant Breeding and Biotechnology, Department of Agronomy and Horticulture, Bogor Agricultural University (BAU). I also gratitude the Competency Grant 2009 No. 219/SP2H/PP/DP2M/V/2009 and 2010 No. 224/SP2H/PP/DP2M/III/2010 from Directorate General of Higher Education, Department of National Education and I-MHERE B.2.C Bogor Agricultural University, 2010 No. 14/1324.4/SPP/I-MHERE/2010, to Dr. Ir. Hajrial Aswidinnoor, M.Sc.
I would like to appreciation Bogor and Pusakanagara Experimental Farm, the research assistants and laboratory technicians during the observations, collecting data, as well as testing the flavor and qua lity of rice and to all person who I cannot list one by one, thank you for your cooperation.
Last but not least, I would like to express my deepest thanks to my beloved husband Yudi Lani Aljawas Salampessy, my sons Yusran Mirqalam Ririsow Salampessy and Manaf Imam Kunuwa Salampessy, my father Achmad Mudzakir Fagi, my mother Aniek Tuti Rochiani, my father and my mother in law ASB Salampessy and Djariah Latuconsina, my sisters Dyah Pitaloka and Sri Endang Wijayanti, and my brother Prihasto Setyanto for their encouragement, patients, moral support, and inspiration given to me during the period of my study at BAU.
And above all, Allah SWT, the Most Gracious and Merciful who gave me the strength to complete the work and made all things well.
Bogor, August 2010
BIOGRAPHY
The author was born at Karawang, West Java, Indonesia on May 25th
The author graduated from the Faculty of Agriculture of Bogor Agricultural University (BAU) in the year 2003. By the scholarship from SEAMEO-SEARCA (Southeast Asian Regional Center for Graduate Study and Research in Agriculture), Philippines the author accomplished master study at Major of Plant Breeding and Biotechnology, BAU since September 2008. The author conducted the research from June 2009 to April 2010.
1981 as fourth and the youngest child of the couple of Achmad Mudzakir Fagi and Aniek Tuti Rochiani.
The author work as an assistance of rice breeder at the Indonesian Center for Rice Research (ICRR) based in Bogor Experimental Farm since 2004 and had published some scientific articles during the career.
viii
CONTENT
Page
LIST OF TABLES .. ... x
LIST OF FIGURES ... xii
LIST OF APPENDICES ... xiii
INTRODUCTION Background ... 1
Rationales ... 5
Objectives ... 5
LITERATURE REVIEW New Plant Type ... 6
Grain Quality ... 8
Aromatic rice ... 10
Genotype x Environment Interaction ... 11
MATERIALS AND METHODS Time and Place ... 14
Parameters Observed ... 14
Grain Quality Testing ... 16
• Milled rice (MR) ... 16
• Head rice (HR) ... 16
• Length, shape, and chalkiness ... 17
• Amylose content analysis... 17
• Gelatinization temperature ... 17
Aroma Sensory ... 18
• Leaf aroma tested with KOH ... 18
• Rice aroma tested in the test tube ... 18
• Tested of cooked rice ... 19
Data Analysis ... 19
RESULT AND DISCUSSION Field Conditions ... 24
Agronomic Characteristics ... 26
Yield Components and Grain Yield ... 35
GENERAL DISCUSSION Plant Growth Variables ... 46
ix
Genetic Parameters ... 49
Yield Stability of NPT Lines ... 54
Identification of Aroma and Grain Quality ... 57
• Leaves aroma ... 57
• Rice aroma ... 59
• Cooked rice aroma ... 59
• Grain quality ... 63
CONCLUSION AND SUGGESTION ... 67
REFERENCES ... 69
x
LIST OF TABLES
Page
1. Genetic materials for research on developing NPT lines ... 15
2. Combine analysis of variance ... 21
3. Analysis of variance random models in each environment ... 22
4. Average daily temperature, monthly precipitation, and humidity 5. A in Bogor during June 2009 through March 2010 ... 24
verage daily temperature, monthly precipitation, and humidity in Pusakanagara during June 2009 through March 2010 ... 25
6. Days to flowering of NPT lines in four environmental conditions ... 28
7. Days to maturity NPT lines in four environmental conditions ... 29
8. Plant height of NPT lines in four environmental conditions ... 31
9. Panicle length of NPT lines in four environmental conditions ... 33
10. Filled grain per panicle of NPT lines in four environmental conditions ... 34
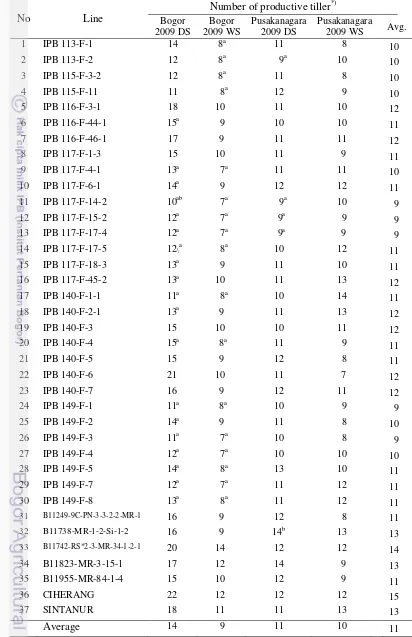
11. Number of productive tiller of NPT lines in four environmental conditions ... 37
12. Total grain per panicle of NPT lines in four environmental conditions ... 38
13. Percentage of filled grain of NPT lines in four environmental conditions ... 39
14. Weight of 1000 grain of NPT lines in four environmental conditions ... 41
15. Yield of NPT lines in four environmental conditions ... 42
16. Yield Potential of NPT lines in four environmental conditions ... 44
17. Mean square of combined analysis of variance of NPT lines in four environmental conditions ... 46
18. Mean of plant growth variables of NPT lines in four environmental conditions ... 47
19. Mean of yield components and yield of NPT lines in four environmental conditions ... 48
20. Genetic parameters and correlation between characters and yield of NPT lines in four environmental conditions ... 51
21. Criteria of value for genetic parameters of NPT lines ... 52
xi 23. Aroma NPT lines tested by leaf method ... 58 24. Aroma of NPT lines tested using test tube method ... 60 25. Cooked rice aroma of NPT lines in three environmental
xii
LIST OF FIGURES
Page
1. (a) Eggs of snail stick to the rice stem, (b) symptoms of rice whorl maggot, (c) the symptoms of BLB, (d) symptoms of tungro... 26 2. Line B11742-RS*2-3-MR-34-1-2-1 was flowered earlier
than the other lines, in Bogor in 2009 WS... 27 3. Lines with different plant height; B11742-RS*2-3-MR-34-1-2-1
xiii
LIST OF APPENDICES
Page
1. Factors that influence the aroma of rice aromatic by
farmer’s opinion ... 78 2. Average daily temperature, monthly precipitation, and humidity in
Bogor during June 2005 through March 2009 ... 79 3. Average daily temperature, monthly precipitation, and humidity in
Pusakanagara during June 2005 through March 2009 ... 80 4. Field condition in Bogor and Pusakanagara ... 81 5. Activities of aroma test ... 81 6. Analysis of variance crop growing parameter of NPT lines in each
environment ... 82 7. Analysis of variance yield components and yield of NPT lines in each
environment ... 83 8. Combined analysis of variance crop growing parameters... 84 9. Combined analysis of variance in yield components and yield
of NPT lines ... 85 10. Correlation between characters of NPT lines in four environmental
1
INTRODUCTION
Background
Rice is one of the important food crops in the world and is the staple food of nearly half of the world's population. Milled rice consumption increased by 40 percent in the last 30 years, from 61.5 kg per capita to about 85.9 kg per capita (UNCTAD 2010). Demand for rice depends on quality, both physical and chemical qualities. Among various carbohydrate sources, especially in Indonesia,
rice plays an important role in the provision of food to support national food security and economic empowerment of farmer households. Most of the rice-producing countries are located in Asia, where rice is not only a major food source but also as a commodity for economic activity that provide employment
opportunities for rural households (Adnyana et al. 2008). Thus, future
development of rice cultivation has to be focused not only on quantity or increase in productivity, but also on improvement of quality of rice grains in the form of a combination of taste, aroma, and nutritive value to be able to compete in the domestic and international markets.
High yielding varieties as one of component technologies remains a priority to support food security programs. Two major programs in rice improvement, namely increasing yield potential and yield stability. High yield potential improvement programs could be promoted through the establishment of a new plant type of rice (NPT) and hybrid rice (Widiarta et al. 2003). NPTs are designed to have more efficient assimilate distribution to the grain. The desired NPT characteristics: 80 - 100 cm plant height, sturdy stem, 8 - 10 productive tillers, erect leaves, thick, dark green leaves, long panicle, total grain of 200-250/panicle, mature at 100 - 130 days, resistant to pests and major diseases. The heterosis of F1 of hybrid rice can increase the yield potential up to 15 - 20% than
2 began to breed the second generation NPT by crossing tropical japonica NPT lines
with the elite indica lines to increase the number of tillers (Peng et al. 2008). New rice varieties, that have better benefits than existing rice varieties, will be more accepted if their characteristics are in accordance to consumer’s preferences (Zen 2007). Therefore, rice breeders should consider about the better
quality of new rice varieties in addition to higher yield potential. Consumers will pay more for good quality rice and this implicate better income for farmers (Adnyana et al. 2008). Rice varieties have different productivities and qualities, grain appearance and aroma. Many aromatic rice varieties are produced in Thailand, India, Pakistan, Bangladesh, Nepal, Iran, Afghanistan, Myanmar, and Indonesia. Aromatic rice cultivars that are popular in Thailand are Thai Hom Mali Rice, Jasmine Rice, and Thai Fragrant Rice. In India the famous aromatic rice is Basmati, which has medium texture, with a slender shape and long grain and less chalkiness (Kamath et al. 2008). In Indonesia, the type of aromatic rice that widely cultivated is tender-texture rice. Farmers cultivate local aromatic rice in irrigated land, such as Pandanwangi and Rojolele. However, these local varieties have long maturity (more than 125 days) and susceptible to major pests and diseases.
In the international markets, demands for rice based on quality are very diverse. Aromatic rice having aroma similar to popcorn are numerous in India, Pakistan, and the Middle East. Consumers in Pakistan and India prefer Basmati rice varieties which are aromatic with long grain. Popularity of this type of rice is
growing in the United Stated and Europe. European Community imports large quantity of aromatic Basmati rice from India. Italy has also aromatic rice varieties, namely Apollo, Asia, Gange, Giano, and Fragrance which have high productivity and good grain quality (Lupotto et al. 2005).
3 ones. Aromatic Basmati rice with a slim grain (length > 6.5 mm) is the most
famous variety (Singh 1997). Basmati from India, Pakistan, and Nepal as well as Sadri from Iran has a higher price than common rice, therefore, there is a lot of support for developing aromatic rice varieties with high yield potential (Garris et al. 2004; Dong et al. 2001).
There are 114 compounds that affect the aroma of rice. However, the most common compound found in aromatic rice was 2-acetyl-1-pyrroline (2AP), a compound that also present in pandan leaves (Pandanus amaryllifolius). These compounds that cause the smell of popcorn or pandan identified in Basmati, Jasmine and most aromatic rice in Asia (Weber et al. 2000). The presence of 2AP compounds in milled rice can be analyzed using gas chromatography mass
spectrometry (GC-MS) (Widjaja et al. 1996). GC-MS methods, PCR, and the
KOH test were used by Sarhadi et al. (2009) to distinguish aromatic rice from a non-aromatic.
Some aromatic rice varieties have been released in 2001, including Sintanur and Batang Gadis with high yield potential (7 - 7.5 t.ha-1), growth duration are 110 - 125 days, and are resistant to brown planthoppers biotype 1 and 2 (Suprihatno et al. 2006). The upland rice Situ Patenggang, was released in 2002. Aromatic upland rice with good grain quality have been developed since 2000 from crossing between varieties Mentik Wangi (aromatic rice) with Danau Tempe and Poso (high yielding upland rice, drought tolerant, hard-texture of cooked rice) (Haryanto et al. 2008). Results of multi location trials, showed four lines that can
be proposed as new aromatic upland rice varieties, are: G10 with the yield of 4.5 t.ha-1, G19 (4 t.ha-1), G39 (4.18 t.ha-1), and G136 (4.11 t.ha-1
High qua lity rice, uniform shape of grains, whiteness and translucency are major factors of market value (Fitzgerald et al. 2008). NPT promising line
developed by the Indonesian Center for Rice Research (ICRR) is BP360E-MR-79-PN-3 having a good grain quality, high percentage of head rice and a strong aroma, which will soon be released as a new plant type of high yielding varieties (HYNPT). In addition there are several other lines with good quality but still in the stage of observation, preliminary and advanced yield trials. (Widiarta et al. 2003).
4 Appearance of a plant called phenotype is the expression of plant genotype
in a particular environment and its interactions (Allard 1960). Phenotype of a plant is influenced by genotype, the environment, and genotype environment interaction (G x E). The environment is one of components that can affect the quality of grain and rice productivity and production. Environmental components
that affect the quality of grain of rice, among others are: altitude, air temperature, humidity, and biotic factors like pests and diseases, abiotic factors such as drought, floods, irrigation, soil type, or rain. Study on the aromatic rice that was exposed to cold weather from the early stages to 4 weeks after flowering (afternoon 25oC per night 30oC) have high concentrations of 2AP. The 2AP concentrations decreases 20 - 40% if the harvest is delayed (8 weeks after flowering) and in high temperature conditions (afternoon 35oC per night 30o
Interaction of G x E must be considered by plant breeders. To develop high yielding varieties, plant breeders dealing with the G x E interaction, which means responses of rice varieties or breeding lines are not necessarily suitable to every environment. Macro-environment that affects the physical plant adaptation including: soil type, altitude, and temperature, location in latitude, climate, and seasons. G x E interactions greatly affect the phenotype of a variety, so the stability analysis is required to characterize the performance of varieties in different environmental conditions, it help breeders in selecting location specific varieties. Instability is the result adaptability of cultivars to different
environmental conditions which usually indicates a high interaction between genetic and the environmental factors (Lone et al. 2009; Jusuf et al. 2008).
C) (Itani et al. 2004).
Information regarding G × E interaction is important for countries such as Indonesia with wide variability of geographic characteristics. Breeders can take
5
Rationales
The existence of interaction between genotype with the environment must be considered in the development of superior plant varieties. Some genotypes show specific reaction to a particular environment. G × E may occur if the phenotype changes at different environments due to the genotype responses. Based on the results of analysis of variation the presence or absence of G × E will be known.
Genotype ability to adapt to the environment can be measured by the interaction of G x E. Instability is the result of a cultivar adaptation to different environments which usually indicates a high interaction between genetic and environmental factors. Based on the response of genotype to the environment, varieties of plants could be grouped into: (1) Varieties that are adaptable to the broad environments, in which the interaction between genotype and environment is relatively small; and (2) Varieties that are adaptable to the particular
environment; this entry shows large interaction with the environments.
The development of rice breeding lines having aromatic character still continues. In this effort, Bogor Agricultural University (BAU) has used aromatic upland rice from South Sulawesi as parental source of the aroma gene. These local rices are Pulu Mandoti, Pinjan, Pare Bau, Lambau, besides Sintanur varieties.
Indonesian Center of Rice Research (ICRR) has currently developed breeding lines for aromatic NPT with gene source from Gilirang. Aromatic advanced lines have been obtained. However, the yield stability of the aromatic rice parents from different sources in different environments is still unknown. Yield stability of these lines is necessary to be examined across different locations and seasons.
Objectives
1. To study the yield components, yields, and response of NPT lines to different environment condition.
2. To study the stability of yields and aromatic character of NPT lines in different environmental condition.
6
LITERATURE REVIEW
New Plant Type
The demand for rice is continuously increasing, making the researchers continue to search for and breed new varieties with higher yields. In Indonesia, breeding program to increase yield potential follows two approaches development of hybrid rice and new plant type (NPT) with productivity estimation up to 10 - 20% higher than existing rice varieties (Suhartatik 2003). Agronomically, grain yield is determined from yield components, namely: the number of panicles, number of grains per panicle, percentage of grain filled out, and 1000 grain weight (Yoshida 1981).
The NPT breeding programs have been initiated by IRRI since 1989 (Khush 2000). NPT has important characters, namely (a) small number of tillers (7 - 12 tillers per hill) and all are productive, (b) longer panicles and dense spikelets (> 300 grains per panicle), (c) large and sturdy stems, (d) erect, thick,
and dark green leaves, and (e) long and thick roots. The potential yield of NPT is 10 - 25% higher than the common yielding varieties (Las et al. 2003). These characters are in accordance to morphological criteria of the rice plant that will produce high yield according to Siregar (1981), including upright leaves (leaf angle ± 30o
The program of NPT rice development in Indonesia started in 1995. Genetic materials used as the parents crossing were introduced from IRRI NPT varieties, local varieties improved varieties, elite lines, and wild rice. Standard selections methods in plant breeding that have been used for the development of NPT are pedigree, bulk, a combination of both, and recurrent selection. Anther
7 culture methods have also been used to develop pure line more rapidly through the
formation of double haploid plants (Abdullah et al. 2008).
From more than 3000 cross combinations, three varieties of semi new plant types (SNPT) have been released, namely Cimelati (2001), Gilirang (2002), and Ciapus (2003) as well as a new high yielding new plant type (HYV),
Fatmawati (2003). Fatmawati is a progeny of a single cross between upland rice, BP68C-MR-4-2, with sturdy stem and deep roots and Maros. Fatmawati has strong stems, medium number of productive tillers (8-14 stems) with total grain 200-400 grains per panicle, resistant to brown plant hopper biotype 2 and 3, resistant to bacteria leaf blight disease (BLB) strain 3, the range of yield 6 - 9 t.ha
-1
and has tender texture, amylose content of 23% (Suprihatno et al. 2006). However, NPT varieties have high unfilled grains, susceptible to major pests and diseases, such as brown plant hopper, stem borer and gall midge, as well as major diseases, such as bacterial leaf blight and tungro. Yang et al. (2007) stated that the average yields of NPT were still lower than hybrid rice. This is because the hybrids produce more number of filled grains per panicle and per m2
Several promising lines that have uniformity, low number of unfilled grains, more resistant to pests’ major diseases, and good grain quality, are BP360E-MR-79-PN-2, BP205D-KN-78-1-8, BP138F-KN-23, and BP-355E-MR 45 lines. The four lines are proposed to be released as new varieties (Abdullah et al. 2008).
.
IR64 and other varieties have been improved for NPT by crossing between
indica types; NPTs have also been developed through the cross between javanica (tropical japonica) rice with japonica types. Javanica parents were used because they have a long and dense panicle, less tillers, solid stems and vigorous root system. However japonica rice grain has a rounded shape, while consumer in the
tropics prefer slender grains. NPT lines that are resistant to major pests and diseases, such as brown plant hoppers, green leaf hoppers, tungro, blast and leaf blight derived from crosses with indica rice have been obtained through backcross and selection methods with molecular marker-aided (MAS) (Khush 2000).
8 the production of biomass (Peng et al. 1999). This small number of tillers and
vulnerable to pest attack was suspected to be the main factors causing lower yield (Peng and Khush 2003). Since 1995, the International Rice Research Institute (IRRI) began to breed the second generation of NPTs by crossing between elite tropical japonica varieties with indica varieties. NPTs improvement is aimed to
increase the percentage of filled grain and high biomass production. Improvement of the second-generation NPT has been initiated to increase number of productive tillers and number of filled grain per panicle and total biomass production compared with inbred varieties indica, IR72. Number of productive tillers and number of grains per panicle were a key to develop the second generation NPT lines, so that the target of increasing yield up to 10% could be achieved (Peng et al. 1999; Peng et al. 2008).
Grain Quality
Development of new varieties has not intended only to obtain high yielding varieties but also for grain quality. Good grain quality of rice varieties will increase demand and price of these varieties. Criteria of grain quality of rice in the international market are: (1) the color of husk; (2) the size, shape, weight, uniformity and general appearance; (3) yield and milling degree; (4) chalkiness and color; (5) cooking characteristics, taste, and processing; and (6) cleanliness, integrity, and purity. Quality of rice can be classified as a physical quality, cooking quality, and quality of taste (Damardjati 1987). Webb (1991) classifies the quality of rice into four, there were: (1) the milled quality; (2) cooking quality and processing; (3) the nutrition quality; and (4) have standards of cleanliness and purity. The quality of rice is influenced by several factors, namely: (1) genetics, (2) environmental condition and pre-harvest activities, (3) treatments during harvesting and (4) post-harvest treatment (Damardjati 1987).
9 amounts of dietary fiber, vitamins, minerals and other health-related components
than the white center portion of the kernel (endosperm).
Consumers prefer rice grains that are transparent and not chalky. Chalky areas of the grain are a result of air spaces in between the starch granules that make up the endosperm. Variation in kernel whiteness and transparency can be
due to differences in rice varieties, cultural management methods, weather conditions during the crop year, and storage conditions of the harvested rice. Milling rice resulted in a loss of vitamins, minerals and dietary fiber. In less developed countries, where rice is major component of the people’s diet, such nutritional losses may significantly impact human health (Bergman et al. 2006).
Taste and cooking quality are generally determined by consumer subjectivity. It differs among ethnic, environmental condition, education, employment and income. Assessment of the characteristics of rice consumers was positively correlated to the price of rice and based on the physical properties of rice (white degree, the percentage of head rice, rice grain size and chalkiness) and the nature of such gel consistency, but negatively correlated with levels of amylose (Suismono et al. 2003 ). In the tropics, consumers prefer rice having grains that are long, slim (slender) and low amylose content and gelatinization temperature levels (intermediate). Rice with these characters will be soft and sticky when cooked. Short sized rice grains, with low amylose content and low gelatinization temperatures will be sticky or tender when cooked and preferable in Japan, Korea, and China (Kush 2000).
Grouping of rice based on amylose content does not only represent consumers preferences in determining the texture of rice but also as reflect their reference in selecting rice for raw materials in food industry. Types of rice used for the manufacture of processed foods differ, depending on amylose-amylopectin
10
Aromatic Rice
Productivity and quality of aromatic rice depend on the environmental conditions where rice is grown and managed. Basmati varieties will be more aromatic if the temperature is relatively cool during the growing period in the day time (25 - 320C) and night (20 - 250
In the United Stated, approximately 9.5% of its citizens consume aromatic jasmine rice and Basmati. Breeding programs in the United Stated led to the development of aromatic rice varieties, as a result some varieties have been released, namely Della (1971), Dellmont (1992), Dellrose (1995), Dellmati (1998), Calmati 201 (1999), and Sierra (2002). These varieties contain aroma compounds 2-acetyl-1-pyrroline (2AP) and have long and slender grain like Basmati (Moldenhauer et al. 2004).
C) with humidity of 70 - 80% during primordial and grain filling stage (Singh 2000). If Basmati is grown in another environment outside the region or at higher temperature, it will not be aromatic
(Oad et al. 2006). Grain types, environmental condition and cultivation method are the main factor affecting the productivity but not on aspects determining quality such as aroma and taste. Farmers have their own perceptions about the factors that influence the aroma of aromatic rice that is shown in Appendix 1
(Rohilla et al. 2000).
Rice aroma manipulated by application of essence (chemicals) can easily evaporate. There are more than 114 compounds found in aromatic rice grains (Weber et al. 2000). The main compounds that cause 2AP aroma are detected in one of the famous aromatic rice Khaw Dawk Mali-105 (Bourgis et al. 2008; Laksanalamai and Ilangantileke 1993). Weber et al. (2000) stated that 2AP content of aromatic rice 15 times greater than that of non-aromatic rice. Genes that affect the level of 2AP compounds expression is OsBADH2 (Niu et al. 2008). The presence of 2AP compounds can be identified through the use of gas chromatography-mass spectrometry (GC-MS) of milled rice. The smell can also
11 than it should be between 200-450 ppb as in Khao Dawk Mali 105 and Jasmine
rices. This is probably due to a combination of other compounds in addition to 2AP aroma forming.
The aroma can also be detected at the time of rice plants flowering in the field. Smelling the leaves and chewing the seeds is one of the most commonly
used to quickly identify the aromatic rice varieties in the field. Aromatic compounds found other than grains are in leaves (Dong et al. 2001).
Genotype x Environment Interaction
Interaction between G x E as a source of phenotypic variability, play an important role in the development and evolution of plants. Breeders can make selection of varieties grown in different environments to select adaptable cultivars. Cultivars which have a similar performance in different environments can produce a similarly high yield in other environments (Soemartono et al. 1992).
Environments are divided into two: micro and macro environments. Micro environment is the immediate environment of a plant or the environment of an individual plant against other plants that grow in adjacent place at the same time. Macro environment is the micro environment of the population, the environment-related general location and extent of a certain period, e.g. one season (Soemartono et al. 1992). The environmental influences on plant growth and the feedback/response of each genotype to environmental changes are a reason for special studies of G x E interaction. Studies were evaluated by researchers, among others by the Finlay-Wilkinson 1963, Eberhart-Russell in 1966, and Freeman and Perkins in 1971. The interaction was complicated because of varied components of the environmental factors (Pervin et al. 2007; Ashraf et al. 2001; Rasyad and Anhar 2007).
12 way, farmers are expected to be careful in determining which cultivars will be
planted in their area.
The existence of G × E interaction can lead to difficulties in breeding program because it could hinder the progress of selection and often interfere in the selection of superior varieties in a trial (Eberhart and Russell 1966). It is often
difficult to legitimate deduction in the extensive environmental range (Nasrullah 1981). Analysis of G × E interaction was used to estimate how much adaptability and stability of a variety if planted in the different environment (Mangoendidjojo 2000).
Phenotype stability is dependent upon plant’s ability to determine its response in different environments. Simple method used to analyze the stability of the various experiments was proposed by Finlay-Wilkinson (Haryanto et al. 2008) and Eberhart-Russell (Dushyanthakumar and Shadadshari 2007; Zen 2007; Azar et al. 2008). Adaptability and stability parameters used are regression coefficients (bi), deviation of regression (S2di), and the average results of the genotype. Finlay-Wilkinson assessed the adaptability of genotypes based on the regression coefficient (bi) and mean of genotypes yield. Relationship between yield and location is indicated by the regression line from each genotype and the average results from all genotypes. Then, the regression line result of each genotype compared with the average result of all genotypes from all locations to determine the stability of the results for each genotype. The Eberhart-Russell regression coefficient (bi) and the deviation of regression (S2
Adaptability is the ability of plants to adapt to the environmental conditions of growth. Cultivars are able to adapt to the broad environment, means that the interactions of G x E are small. While the narrow adaptation the variety performance good in such environment but not in other environments. This means that there is interaction G x E is large (Soemartono et al. 1992).
di) can be used to test the
13 Aromatic rice has different stability and adaptability to various
environments. Haryanto et al. (2008) examined nine aromatic rice genotypes from crossing between aromatic rice upland, Mentikwangi and Poso. The results showed several genotypes have a high yield stability and wide adaptability. But there were only several genotypes were well adapted to specific locations.
AMMI Methods (Additive Main Effects and Interaction Multiplication) widely used for analyzing G x E interactions in rice (Mahalingam et al. 2006), wheat (Farshadar 2008), and cotton (Naveed et al. 2007). AMMI is very effective to explain the genotype interaction with that environment. Degradation effect of interactions is done by bilinear models, so the genotypes can be mapped clearly. Biplot clearly maps genotype and environment interaction simultaneously.
14
MATERIALS AND METHODS
Time and Place
Field studies were conducted from July 2009 to May 2010 at two locations, farmer’s field in Bogor (elevation 200 m above sea level, ASL) and Pusakanagara experimental farm (8 m ASL), in the 2009 dry season (DS) and 2009 wet season (WS). Grain quality was evaluated in the grain quality laboratory at Muara Experimental Farm, Bogor.
Randomized Complete Block Design (RCBD), in three replications was
used. Materials tested were 35 promising aromatic lines and check varieties were Ciherang and Sintanur. The total treatments amounted to 37 lines (Table 1).
The 21-day-old seedlings were planted one seedling per hole with spacing of 20 cm x 20 cm, in a plot size of 2 m x 5 m per genotype; there were 250 plants per plot. The rice plants were fertilized with urea, SP36, KCl at the rates of 250 kg
ha-1, 100 kg ha-1, 100 kg ha-1, respectively. Pests and diseases were controlled optimally.
Parameters Observed
Plants were observed at the generative phase. Yield components, plant height, and growth stage were observed from five plants of each line; procedures used by IRRI were followed.
1. Days to 50% flowering was number of days from sowing to time of flowering stage reaching 50% of the population.
2. Days to maturity; was number of days from seeding to grain ripening (90% of grains on panicle are mature).
3. Plant height (cm) was measured from soil surface to tip of the tallest panicle (awns excluded).
4. The number of productive tillers was the average number of tiller that could produce panicles per hill.
15
Table 1. Genetic materials for research on developing NPT lines
No. LINES COMBINATIONS
1 IPB 113-F-1 Pare Bau* x Fatmawati 2 IPB 113-F-2 Pare Bau x Fatmawati 3 IPB 115-F-3-2 Fatmawati x Lambau* 4 IPB 115-F-11 Fatmawati x Lambau 5 IPB 116-F-3-1 Pinjan* x Fatmawati 6 IPB 116-F-44-1 Pinjan x Fatmawati 7 IPB 116-F-46-1 Pinjan x Fatmawati
8 IPB 117-F-1-3 Fatmawati x Pulu Mandoti* 9 IPB 117-F-4-1 Fatmawati x Pulu Mandoti 10 IPB 117-F-6-1 Fatmawati x Pulu Mandoti 11 IPB 117-F-14-2 Fatmawati x Pulu Mandoti 12 IPB 117-F-15-2 Fatmawati x Pulu Mandoti 13 IPB 117-F-17-4 Fatmawati x Pulu Mandoti 14 IPB 117-F-17-5 Fatmawati x Pulu Mandoti 15 IPB 117-F-18-3 Fatmawati x Pulu Mandoti 16 IPB 117-F-45-2 Fatmawati x Pulu Mandoti
17 IPB 140-F-1-1 Sintanur* x (Fatmawati x IPB26-d-14j-1-1-2) 18 IPB 140-F-2-1 Sintanur x (Fatmawati x IPB26-d-14j-1-1-2) 19 IPB 140-F-3 Sintanur x (Fatmawati x IPB26-d-14j-1-1-2) 20 IPB 140-F-4 Sintanur x (Fatmawati x IPB26-d-14j-1-1-2) 21 IPB 140-F-5 Sintanur x (Fatmawati x IPB26-d-14j-1-1-2) 22 IPB 140-F-6 Sintanur x (Fatmawati x IPB26-d-14j-1-1-2) 23 IPB 140-F-7 Sintanur x (Fatmawati x IPB26-d-14j-1-1-2) 24 IPB 149-F-1 Lambau* x Fatmawati
31 B11249-9C-PN-3-3-2-2-MR-1 B10589F-KN//Memberamo/IR64 32 B11738-MR-1-2-Si-1-2 Gilirang*/BP342F-MR-1-3//Gilirang* 33 B11742-RS*2-3-MR-34-1-2-1 BP360E-MR-79-PN-2/IR71218/BP360E 34 B11823-MR-3-15-1 BP140F-MR-1-KN-1/Code/BP140F-MR-1 35 B11955-MR-84-1-4 B11738-MR-2-5/B11738-MR-6B
36 CIHERANG IR18349-53-1-3-1-3/3*IR19661-131-3-1-3//4*
37
IR64
SINTANUR Lusi/B7136C-MR-22-1-5 (Bengawan Solo)
* Parent source of aroma
6. The amount of grain total per panicle. 7. Percentage of filled grain.
16 9. Yield potential was calculated from yield components of the line. The formula
used as follow (Yoshida 1981):
Yield (t.ha-1) = number of panicle/m2 x number of total grain/panicle x % filled grain x 1000 grain weight (g) x 10
= number of grain/m
-5
2
x % filled grain x 1000 grain weight (g)
x 10-5
Grain Quality Testing
Grain quality of brown rice, milled rice, head rice, length, shape, and chalkiness of grain, gelatinization temperature were evaluated, followed IRRI
procedure (IRRI 2002).
About 500 g grains per line were milled with ST50 Yanmar Rice Huller to have brown rice (BR).
Formula:
BR (%) =
Milled rice (MR)
Brown rice was milled in Yakatama Miller machine to obtain white milled rice and bran; milled rice was weighted.
Formula:
MR (%) =
Head rice (HR)
A total of 100 g of milled rice was sifted and differentiated/separated between the head (HR) and broken rice.
Formula:
17
Length, shape, and chalkiness
Length and width of ten grains of head rice was measured manually using dial caliper. Scales of the rice length were long (6.6 – 7.5 mm), medium (5.51 – 6.6 mm), and short (< 5.5 mm). Rice shape was the ratio of length to width. Rice performance quality was determined by using indicators these were the
appearance and clearness of the endosperm. Chalkiness was noted in the middle of rice (white center), front (white belly), or none at all (none). The scales of kernel area were small (< 10%), medium (11 – 20%), and large (> 20%).
Amylose content analysis
Amylose content was analyzed using calorimetric iodide. A total of 100 mg of white rice flour from each line was put in the 100 ml measuring flask, and then mixed with 1 ml of alcohol 95% and 9 ml of NaOH 1 N. Solution was kept and undisturbed at room temperature for 23 hours, then added with distillate water until line of measuring tera, then shaken. Five ml of solution was taken and then placed in a 100 ml measuring flask per sample; 85 ml water was added, then distillated with acetate 1 ml 1 N and 2 ml 2% KI; the solution was then diluted to the tera. The value of light absorption of this solution was measured with a spectrophotometer. Amylose classification levels were: high (> 25%), medium (20.1 - 25%), low (12.1 - 20.0%), very low (5.1 - 12.0%) and waxy (0 - 5.0%).
Gelatinization temperature
Six head rice grains were soaked in 10 ml 1.7% KOH solution for 23 hours at 30oC. Rice appearance and separation were visually seen and classified using IRRI scoring method (IRRI 2002). Rice having low-gelatinization temperature would be completely separating or disappear. Rice having medium
18
Aroma Sensory
Aroma was evaluated using three methods. The first method was made using the leaf samples according technique developed by Berner dan Hoff (1986) that was further modified by Dong et al. (2001). The second, used a modified method of Sha and Linscombe (2004) in the test tube, and the third followed Allidawati and Kustianto (1989) for cooked rice aroma.
Leaf aroma tested with KOH
Aroma of leaves was tested at maximum tillering until panicle initiation. Three to 5 leaves of the rice plants were taken. Leaf samples were cut at approximately 5 mm, and were placed in plastic sealed and stored in a temperature of -20oC until frozen. The frozen leaf was weighed at about 0.8 g and placed in a test tube, filled previously with 5 ml of 1.7% KOH solution, and then were covered with aluminum foil and put into a 50oC oven for 10 minutes. The tube was opened one by one and evaluated by 4 panelists to be scored at 0 - 3. Score 0 was no aroma, 1 was faint aroma, 2 indicated aroma, and 3 represent strong aroma. Test scores of each lines were averaged and differentiated into 3 groups, namely aromatic (score > 1.0), slightly aroma (score 0.6 - 1.0), and not aroma (score ≤ 0.5).
Rice aroma tested in the test tube
Aroma test after harvest used rice in test tubes. A total of 1 gram of rice grains was placed in test tube of 15 x 150 mm size which were filled with 10 ml of dH2O, and covered with aluminum foil, and then cooked in boiling water for
19
Test of cooked rice
A total of 200 g of rice of each line was cooked with 300 ml of water, and then steamed for 30 minutes. Aroma and rice texture tested by 10 panelists to determine the aroma level (using score), and rice texture was grouped into tender to hard texture.
Data Analysis
Homogenity of error range from several growing environments was tested using Bartlett test that compares the chi-square value calculated by chi-square table (Gomez and Gomez 1995). The formula of calculating chi-squares is shown below:
χ2
where:
(chi-square
) =
k = number of varieties tested f = degree of freedom range tested S2i = value of diversity at the ith
S
environment
2
If counted χ2 > χ2 table then the hypothesis was rejected or an error range of homogeneity was not homogeneous, and the tests were performed separately. But if counted χ2 < χ2 table then a combined analysis of the range of error was
made. If the two environments in two seasons had a homogenous error range, stability test of results could be proceeded.
p = the value of the combined estimators of the entire range of environmental research
Linear regression analysis introduced by Finlay and Wilkinson in 1963, then improved by Eberhart and Russell (1966) was used to analyze yield stability of the genotype. This method was used by Bahar et al. (1994), Carlos et al. (2008), and Jusuf et al. (2008). The model is shown in the following:
Yij = μ + bi Ij + dij
20 Yij = average yield of genotype ith at location jth
μ = average yield of the i
th
b
genotype in all locations
i = regression coefficient of the ith
I
genotype
j = environmental Index at the of jth
d
location
ij = deviation of regression of genotype ith at location jth
Adaptability and stability of a plant was measured by the regression coefficient between the average yields of a genotype with average yield of all genotypes in a particular environment. Thus the stability was classified into three possibilities:
1. If the regression coefficient (bi) is close or equal to one then the stability is in the average level (average stability). If the stability is in the average level and the average yield is higher than the average yield of all genotypes in all environments the genotypes have a good general adaptability. Conversely, if the average yield is lower than the overall average yield, then the adaptability is poor (poorly adapted) in all environments.
2. If the regression coefficient (bi) is more than one, then the stability is below average stability. Such genotype is sensitive to the environmental changes, and is adapted to specific a environment that is favorable.
3. If the regression coefficient (bi) is smaller than one then the stability is above average (above average stability). This genotype is adapted to marginal environments
Yield stability was also analyzed by AMMI model using SAS 9.0
program. Proc GLM was used for analysis of variance. Proc IML was used to extract the interaction effects was a major component axes (PCA) based on principal component analysis method. Proc GPLOT was used to generate biplot from scores of genotype and score of the environment generated by principal
components analysis.
21 Table 2. Combine analysis of variance
Source of Variance degree of freedom
Mean
Square Expected MS Environment (L) (l-1) - -
controlled, and therefore responses of plants are analyzed by conducting experiments at several locations, or several seasons, and both are analyzed by using combined analysis (Table 2). The purpose of combined analysis is to evaluate the interaction between treatments, season and locations to determine whether technology recommendations are separated or combined (Gomez and Gomez 1995).
Linear model of RCBD with combined pattern (Singh and Chaudary 1979) as follow:
Data of this experiment were analyzed by Tukey (Honesty Significant Different, HSD) at α level of 5%; if the range of analysis using the F test showed significantly different values, means there were interaction between the genotype and genotype x environment. The variability was calculated by analysis of variance (Singh and Chaudary 1979). Calculations are:
Variance of genotype (σ2g
Variance of G x E interaction (σ
) = –
2 gl
Variance of the environments (σ ) =
2
22 Variance of phenotypes (σ2p
Heritability broad sense (H
) = + +
2
Coefficient of genetic variance (CGV) = x 100%
bs) = x 100%
Coefficient of phenotypic variance (CPV) = x 100%
Genetic advance (GA) = k x x
GAP (%) = x 100%, is the value of genetic improvement in the percent of the
average value of the population. where:
k = selection differential in standard deviation units, k = 2.06 at 5% selection intensity
X = general mean
For characters that are influenced by the environment, heritability values and combination of growing environment were also calculated from each environment using analysis of variance (Table 3).
Table 3. Analysis of variance random models in each environment Source of
Variance
degree of
freedom Mean Square Expected MS
Replication r-1 N1 σ2e + g σ2r
Genotype g-1 N2 σ2e + r σ2
Error
g
(r-1)(g-1) N3 σ2e
From the ANOVA, each variance of phenotype and genotype can be inferred by the following formula.
σ2 p
σ =
23 The correlation between covariance was analyzed according to the formula
of Singh and Chaudary (1979):
r (x1 x2
where: ) =
r (x1 x2) = correlation between x1 and x
cov x
2
1 x2 = covariance x1 x
σ
2 2
(x1) = variance of x1
σ
2
(x2) = variance of x2
Correlation of significant different test between characters was calculated by t test,
t =
where:
r (x1 x2) = correlation between x1 and x
r
2 2
(x1 x2) = square of correlation between x1 and x
df = degree of freedom (n-2)
2
All data were analyzed by using SAS 9.0 program.
24
RESULTS AND DISCUSSION
Field Conditions
The altitude of Pusakanagara experimental farm is 8 m above sea level
(ASL), while that of experimental field in Bogor is 200 m ASL. Pusakanagara and
Bogor are located in region having wet climate with IVB and VIB rainfall
patterns, respectively (Puslitbangtanak 2003): wet climate is indicated by rainfall
amount of 3000 - 4000 mm per year with the lowest rainfall occurs from July to
August. It has two dry months and 8 - 11 wet months, so that appropriate for
growing rice continuously. Meanwhile, Bogor has VIB rainfall pattern, with an
annual rainfall of > 5000 mm per year, without dry months.
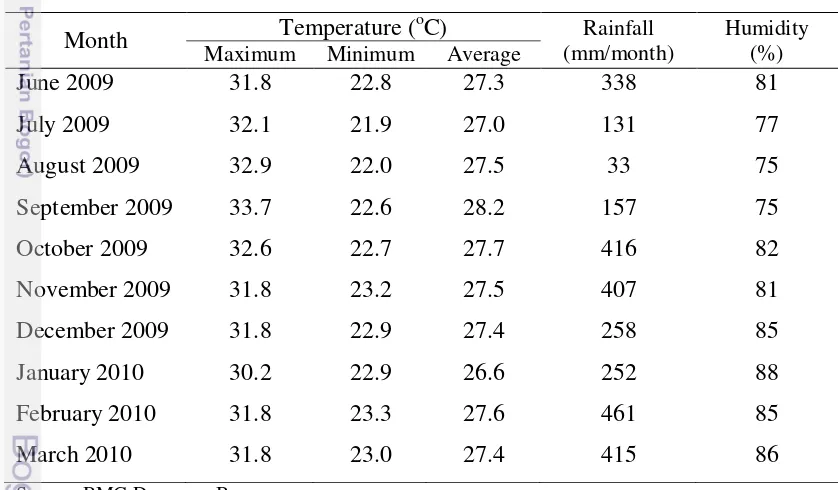
Table 4. Average daily temperature, monthly precipitation, and humidity in Bogor during June 2009 through March 2010
Month Temperature (
Maximum Minimum Average
June 2009
Source: BMG Darmaga, Bogor
The soil type of experimental site in Bogor is Andisol that is rich in
organic matter. Naturally, this soil has a high water holding capacity and
resistance to erosion. It is relatively fertile and good physical properties. The soil
type of Pusakanagara experimental farm is Inceptisol with fine texture (sandy clay
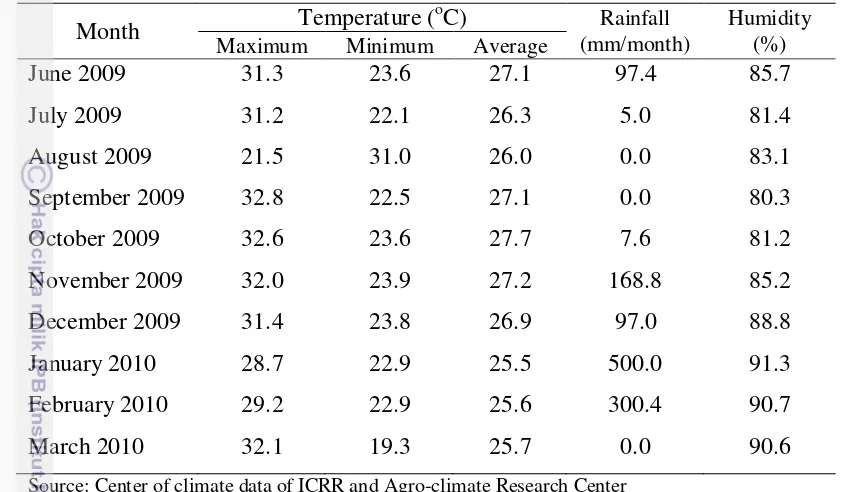
25 Table 5. Average daily temperature, monthly precipitation, and humidity in
Pusakanagara during June 2009 through March 2010
Month Temperature (
Maximum Minimum Average
June 2009
Source: Center of climate data of ICRR and Agro-climate Research Center
surrounding environmental factors (Puslittanah 2000). The complete climate data
from the year 2005 is shown at Appendix 2 and 3.
In Bogor, during the first cropping season the rice plants were infested by
golden apple snail (Pomacea canaliculata) at the early stage of growth. Snails
were found in rice stem where this pest layed eggs (Figure 1a). Snails cut and ate
plant tissue causing a loss of seedlings in the experimental plots, and hence
seedlings have to be replanted. Snails were controled by picking them up
manually. The other pests observed in the field at vegetative phase were rice
whorl maggot (Hydrellia philippina) (Figure 1b), tungro virus disease transmitted
by green leafhoppers (Nephotettix virescens), and bacterial leaf blight (BLB)
caused by bacterium Xanthomonas campestris.
Color of rice leaves infested by tungro virus diseases turn from green to
orange (Figure 1d). Rice bugs (Leptocorisa oratorius) attacked the latest phase of
the rice plants. These pests were controlled using insecticide with active formula
BPMC (Sidabas) and fipronil (Regent).
The highest infestation of BLB occured during the wet season, December
26
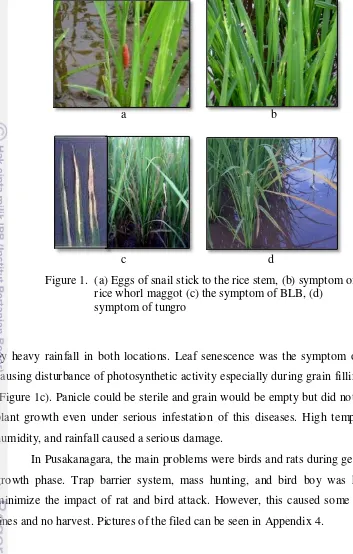
a b
c d
Figure 1. (a) Eggs of snail stick to the rice stem, (b) symptom of rice whorl maggot (c) the symptom of BLB, (d) symptom of tungro
by heavy rainfall in both locations. Leaf senescence was the symptom of BLB,
causing disturbance of photosynthetic activity especially during grain filling stage
(Figure 1c). Panicle could be sterile and grain would be empty but did not disturb
plant growth even under serious infestation of this diseases. High temperature,
humidity, and rainfall caused a serious damage.
In Pusakanagara, the main problems were birds and rats during generative
growth phase. Trap barrier system, mass hunting, and bird boy was hired to
minimize the impact of rat and bird attack. However, this caused some missing
lines and no harvest. Pictures of the filed can be seen in Appendix 4.
Agronomic Characteristics
Days to flowering
Average days to flowering ranged from 85 - 105 days after sowing (DAS)
(Table 6). Earliest flowering plants were observed in the experimental site in
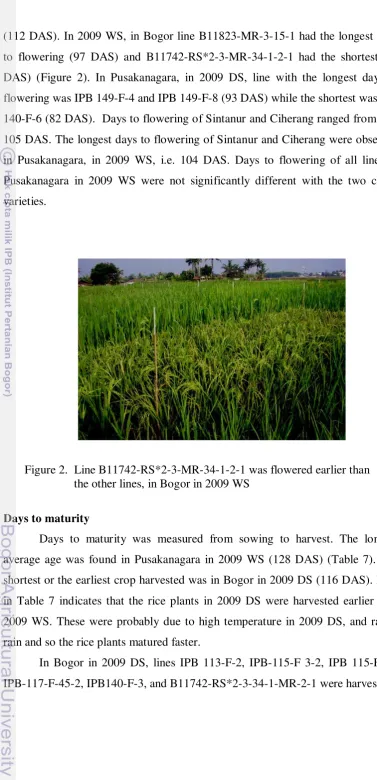
27 (112 DAS). In 2009 WS, in Bogor line B11823-MR-3-15-1 had the longest days
to flowering (97 DAS) and B11742-RS*2-3-MR-34-1-2-1 had the shortest (79
DAS) (Figure 2). In Pusakanagara, in 2009 DS, line with the longest days to
flowering was IPB 149-F-4 and IPB 149-F-8 (93 DAS) while the shortest was IPB
140-F-6 (82 DAS). Days to flowering of Sintanur and Ciherang ranged from 86 -
105 DAS. The longest days to flowering of Sintanur and Ciherang were observed
in Pusakanagara, in 2009 WS, i.e. 104 DAS. Days to flowering of all lines in
Pusakanagara in 2009 WS were not significantly different with the two check
varieties.
Figure 2. Line B11742-RS*2-3-MR-34-1-2-1 was flowered earlier than the other lines, in Bogor in 2009 WS
Days to maturity
Days to maturity was measured from sowing to harvest. The longest
average age was found in Pusakanagara in 2009 WS (128 DAS) (Table 7). The
shortest or the earliest crop harvested was in Bogor in 2009 DS (116 DAS). Data
in Table 7 indicates that the rice plants in 2009 DS were harvested earlier than
2009 WS. These were probably due to high temperature in 2009 DS, and rarely
rain and so the rice plants matured faster.
In Bogor in 2009 DS, lines IPB 113-F-2, IPB-115-F 3-2, IPB 115-F-11,
28 Table 6. Days to flowering of NPT lines in four environmental conditions
No Line
29 Table 7. Days to maturity of NPT lines in four environmental conditions
No Line
30 earlier (110 DAS), while IPB 140-F-5 and IPB 149-F-3 were lines with longest
days to maturity (124 DAS). In Bogor in 2009 WS, the average days to maturity
increased by 4 - 7 days. Differences were also found in Pusakanagara in 2009 DS
and 2009 WS, approximately 8 - 12 days differences.
B11742-RS*2-3-MR-34-1-2-1 had the shortest growth duration (110 - 111 DAS) in Bogor in 2009 DS and
2009 WS. However, differences in days to maturity of
B11742-RS*2-3-MR-34-1-2-1 in Pusakanagara in 2009 DS and 2009 WS were up to 13 days.
Plant height
Each line had a different plant height (Table 8). In all environmental
condition the average plant height of NPT lines was not significantly different
with Ciherang or Sintanur. In the 2009 dry season (DS), in Bogor, the tallest was
IPB 140-F-1-1 (121 cm) and the shortest was B11742-RS*2-3-MR-34-1-2-1 (86
cm), while in Pusakanagara, the tallest line was IPB 140-F-3 (127 cm) and the
shortest, was B11742-RS*2-3-MR-34-1-2-1 (92 cm). In Bogor in 2009 wet season
(WS), the tallest and shortest line was IPB 140-F-1-1 (128 cm) and
B11823-MR-3-15-1 (77 cm), respectively. In Pusakanagara, the tallest line was
B11249-9C-PN-3-3-2-2-MR-1 (123 cm) and the shortest was IPB 116-F-46-1 (85 cm). The
examples of differences in plant heights were shown in Figure 3.
31 Table 8. Plant height of NPT lines in four environmental conditions
No Line
32 Plant height is divided into three categories, namely short (< 110 cm),
medium (110 - 130 cm), and tall (> 130 cm) (IRRI 2002). Based on these
categories, from the average data on plant height in four environmental condition
there were 24 lines that were medium with plant height ranging from 110 - 121
cm and 13 lines were short (91 cm – 110 cm); Non of these lines were tall. Tall
plant is Not desired because it is sensitive to lodging, and lodging will reduce
grain yield (Shahidullah et al. 2009). Reducing plant height is one of the main
objectives of rice breeding programs in Afghanistan (Sarhadi t al. 2009).
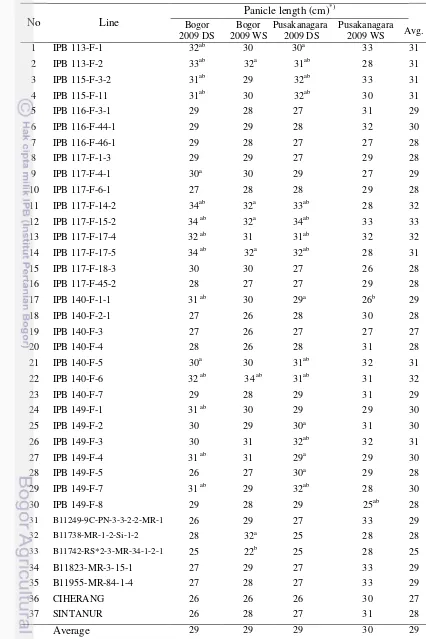
Panicle length
The tested lines have panicle length ranging from 25 to 34 cm (Table 9). In
2009 DS, ranges of panicle length in Bogor and Pusakanagara were from 22 to 34
cm, with an average of 29 cm. The lines with the longest panicle were IPB
117-F-14-2, IPB 117-F-15-2, and IPB 117-F-17-5; while the shortest was
B11742-RS*2-3-MR-34-1-2-1. In Pusakanagara line with the longest panicle was IPB
117-F-15-2; and the shortest lines were B11738-MR-1-2-Si-1-2 and
B11742-RS*2-3-MR-34-1-2-1.
In Bogor in 2009 WS, the range of average panicle length was 22 – 34 cm.
B11742-RS*2-3-MR-34-1-2-1 was line with the shortest panicle (22 cm), while
the longest was IPB 140-F-6 (34 cm). In Pusakanagara, the range of panicle length
was from 25 – 33 cm, with an average of 30 cm. Panicle lengths of all lines in
Pusakanagara were Not significantly different with those of the check varieties,
Ciherang and Sintanur, except IPB 149-F-8 with the shortest panicle length of 25
cm The lines with the longest panicle were IPB 113-F-1, IPB 15-F-3-2, IPB
117-F-15-2, B11249-9C-PN-3-3-2-2-MR-1, B11823-MR-3-15-1, and
B11955-MR-84-1-4. Rice plants with long panicles potentially have high number of total grains
and high yields because there is a positive correlation between lengths of panicle
with the number of grains per panicle (Haryanto et al. 2008).
Filled grains per panicle
Range of the numbers of filled grains per panicle was from 30 to 247
grains (Table 10). In Bogor in 2009 DS, the range was from 97 to 224 grains. IPB
33 Table 9. Panicle length of NPT lines in four environmental conditions
No Line
34 Table 10. Filled grain per panicle of NPT lines in four environmental conditions
No Line