* Corresponding author. email: [email protected] INTRODUCTION
Rice (Oryza sativa L.) is still one of the most important food crops in world’s population. Most of the rice-producing countries are in Asia where average consumption is higher than 80 kg per person per year, such as China, 90 kg; Indonesia, 150 kg; and Myanmar, the highest, more than 200 kg. Most rice was consumed in the same country that it was produced not only as a major food source but also as an economic activity or resources that provide employment opportunities for rural income (Adnyanaet al., 2008; UNCTAD, 2010).
High yielding varieties as one of component technologies remains a priority to support food security programs. Two major programs in rice improvement, namely increasing yield potential and yield stability. High yield potential programs could be promoted through the establishment of a new plant type (NPT) of rice. NPTs are designed to have more ef! cient assimilate distribution to the grain (Khush, 2000). New rice varieties, that have better bene! ts than existing rice varieties, will be more acceptable if their characteristics follow the consumer’s preferences (Zen, 2007). Therefore, rice breeders should consider better quality and aroma of new rice varieties as well as higher yield potential.
The development of NPT rice lines having aromatic character continues. Bogor Agricultural University (IPB) has been using upland rice originated from of South Sulawesi as the aroma gene source. These local rice varieties were Pulu Mandoti, Pinjan, Pare Bau, and Sintanur. Currently, Indonesian Center of Rice Research (ICRR) also developed NPT lines expectations aromatic fragrant with the gene source from Gilirang and local variety. Lines with aromatic potential were obtained from different aroma genes. However, the stability of the rice aroma parents from different sources in different environments is unknown. Yield stability and adaptability of these lines are necessary to be evaluated across different location and season.
Appearance of a plant (phenotype) is in" uenced by genotype, environment, and the interaction between genotype and environment (G x E) (Allard, 1960). Environment is one component that can affect the quality of grain and rice production. G x E interaction must be considered by plant breeders to develop high yielding varieties because the response of genotype is not the same in every environment. Macro-environment that affects the physical plant adaptation including soil type, altitude, temperature, latitude, climate, and seasons. G x E interactions greatly affect the phenotype of a variety, so the stability analysis is required to characterize the performance of varieties in different environments, to help plant breeders in selecting varieties. Instability is the result of cultivars response in different environments which usually indicates a high interaction between genetic
Yield Stability and Adaptability of Aromatic New Plant Type (NPT) Rice Lines
Angelita Puji Lestari1*, Buang Abdullah1, Ahmad Junaedi2, and Hajrial Aswidinnoor2
1Indonesian Center for Rice Research (ICRR), Jl. Raya Ciapus No. 25A Bogor
2Department of Agronomy and Horticulture, Faculty of Agriculture, Bogor Agricultural University,
Jl. Meranti Kampus IPB Darmaga 16680, Indonesia
Received 20 August 2010/Accepted 30 November 2010
ABSTRACT
Aromatic new plant type (NPT) rice lines were selected to obtain high yielding and aromatic lines. The objectives of the research were to study the yield stability and adaptability of 35 NPT rice lines across different environment, with Ciherang and Sintanur as check varieties. The lines planted at two locations, Bogor and Pusakanagara in two seasons (2009 dry and wet seasons, DS-WS). The experiment used randomized complete block design (RCBD), with three replications. The 21-day-old seedlings were planted with spacing of 20 cm x 20 cm, with a plot size of 2 m x 5 m. Yield stability and adaptability were estimated by using coef! cient regression (bi) and general mean of yield by Finlay-Wilkinson method. Combined analysis of variance showed that lines (G), environment (E), and the G x E interaction were signi! cantly different. Lines showed different stability and adaptability. Several lines yielded higher than Ciherang variety. Nine lines were classi! ed as stable and widely adapted at the marginal environment, i.e IPB 116-F-3-1, IPB 117-F-4-1, F-14-2, F-15-2, IPB-117-F-17-5, IPB 140-F-1-1, 140-F-IPB, 2-1, IPB 140-F-3, and IPB 149-F-2. Lines IPB 113-F-2, IPB 140-F-4, IPB 140-F-6, IPB 140-F-7, and B11738-MR-Si-1-2-1-2 were not stable and adapted only in optimum environmental condition (bi > 1) while IPB 116-F-46-1, IPB-117-F 17-4, IPB-117-F 18-3 and B11955-MR-84-1-4 has the value of bi < 1 or adaptable to marginal environments.
and environmental factors (Jusuf et al., 2008; Lone et al., 2009).
Phenotypic stability is dependent upon plant’s ability to determine its response to different environments. Stability analysis is an important and ef! cient tool for the plant breeders and agronomists to identify and select the most stable, high performing genotypes that are best suitable under a given set of environmental conditions. Haryanto et al. (2008) showed that the yield stability of aromatic upland rice lines varied across different environments. Four lines, i.e. G10, G19, G39, and G136 have high yield stability, wide adaptability, and were potential to be released as a new aromatic upland rice variety. In the study of Dakheel et al. (2009) in pearl millet, six lines were suitable for cultivation under medium to high saline and marginal growing environments. These genotypes can be exploited in future breeding programs to develop high yielding, stable genotypes for saline growing conditions. Nur et al. (2007) reported that there was signi! cant G x E interaction for yield and yield components of hybrid maize in seven different environments.
Simple method to analyze the stability of the various experiments is the method proposed by Finlay-Wilkinson (1963) and Eberhart-Russell (1966). Adaptability and stability parameters used are regression coef! cients (bi), deviation of regression (S2di), and the mean of genotypes
yield. Regression coef! cient (bi) is used to categorised the stability of being low (bi > 1), medium (bi = 1), and high (bi < 1).
This research determined the stability of grain yield of rice NPT aromatic lines across four different environments and to select lines having wide adapttation and/or speci! c adaptation to environment.
MATERIALS AND METHODS
Thirty-seven promising NPT lines and two improved varieties, Ciherang and Sintanur were planted at two locations, Bogor (elevation 200 m above sea level-asl) and Pusakanagara region (8 m asl) in two seasons (2009 dry and wet seasons, DS-WS). Bogor 2009 DS was considered as the ! rst environment; Pusakanagara 2009 DS, the second; Bogor 2009 WS, as the third; and Pusakanagara 2009 WS as the fourth. The design used was randomized complete block design (RCBD), with three replications. A seedling of 21-day-old was planted per hole with spacing 20 cm x 20 cm, with a plot size of 2 m x 5 m, so that there were 250 plants per plot.
Homogeneity of error range was performed by the method outlined by Gomez and Gomez (1995). Each growing environment was tested using Bartlett test that compares calculated chi-square value by chi-square table. If variances of all environments were found to be homogenous, then combined analysis of variance was proceeded to look at G x E and stability of the genotypes across all environments.
Eberhart and Russell (1966) method was used to analyze the stability of the yield, as follows:
Yij = # + bi Ij + dij
Where:
Yij = yield rate genotype ith at location jth
# = average of the ith genotype in all locations
bi = regression coef! cient of the ith genotype
Ij = environmental index on the location of jth
dij = deviation of regression genotype ith at location jth
Adaptability and stability of genotypes were calculated by the regression coef! cient (bi) between the yield averages of a genotype with a general average of all genotypes in a particular environment. Thus the stability classi! ed into three possibilities:
1. If the regression coef! cient (bi) of a genotype is close or equal to one then the stability is the average (average stability). If the stability is categorized as average stability and the average yield is higher than the average yield of all genotypes in all environments, then the genotype has a good general adaptation (general adaptability). Conversely, if the average yield is lower than the average yield of all genotypes in all environments, then the genotypes has poor adaptability.
2. If the regression coef! cient (bi) of a genotype is greater than one, then the stability is under the average (below average stability). This kind of genotype is sensitive to environmental changes and adapted only to speci! c environments which is favorable to the genotype. 3. If the regression coef! cient (bi) of a genotype is smaller
than one, then the stability is above average (above average stability). This kind of genotype is less sensitive to environmental changes and adapted to marginal environments. Statistical analysis was done using SAS version 9.0.
RESULTS AND DISCUSSION
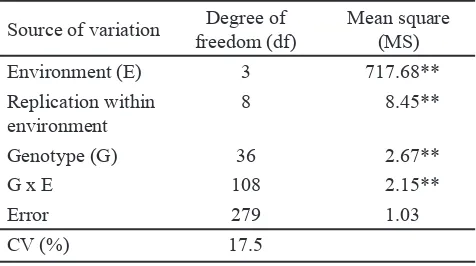
As uniformity test of error variances was non-signi! cant, therefore its homogeneity is con! rmed ($2 = 2.07 < 7.81) and then combined analysis of data was conformed. Combined analysis of variance in yield showed that lines, environment, and the interaction between line and environment (G x E) was signi! cantly different (Table 1).
Source of variation Degree of freedom (df)
Mean square (MS) Environment (E) 3 717.68** Replication within
environment
8 8.45**
Genotype (G) 36 2.67**
G x E 108 2.15**
Error 279 1.03
CV (%) 17.5
Table 1. Combined analysis of variance in yield of NPT lines
The signi! cant G x E interaction shows that the relative performances of the genotypes were signi! cantly affected by the varying environmental conditions. There were differences between yield and appearance of the lines in each environment. Means of lines varied considerably at different environment. This was also reported by Asad et al. (2009) in seven rice genotypes at eight different sites in Sindh, Pakistan. However, Soroush (2005) reported that the effects of location, year, interaction between genotype x location, and interaction between genotype x year were not signi! cant, in eight rice promising genotypes that were carried out in three locations in Gilan province, Iran. It means that the genotypes had similar response over different locations and years.
Grain Yield
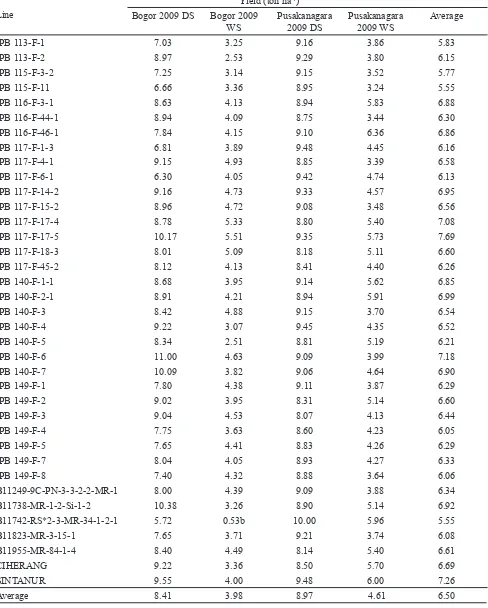
Grain yield of the lines varied when planted in different environmental conditions. The average grain yield ranged from 0.53 ton ha-1 to 11.00 ton ha-1 (Table 2). In the 2009
DS, the average yield reached more than 8 ton ha-1 in Bogor
and Pusakanagara. There were four lines yielded more than 10 ton ha-1, i.e. IPB-117-F 17-5, IPB F-6, IPB
140-F-7, and B11738-MR-1-2-Si-1-2, at Bogor in 2009 DS. Line B11742-RS*2-3-MR-34-1-2-1 had the lowest yield. The average yield of lines was not signi! cantly different from that of Ciherang and Sintanur as check varieties. In Pusakanagara, the yield ranged from 8.07 ton ha-1 (IPB
149-F-3) to 10.00 ton ha-1 (B11742-RS*2-3-MR-34-1-2-1), with
an average of 8.97 ton ha-1.
In 2009 WS, at Bogor, the average yield declined from 8.41 to 3.98 ton ha-1 in the DS; in Pusakanagara as well, the
average yield in the WS turned to4.61 ton ha-1. In Bogor,
there were several lines yielded higher than 5 ton ha-1, i.e. IPB
117-F-17-4 (5.33 ton ha-1), IPB 117-F-17-5 (5.51 ton ha-1),
and IPB 117-F-18-3 (5.09 ton ha-1). These lines yielded
higher than Ciherang (3.36 ton ha-1) and Sintanur (4.00 ton
ha-1) variety. In Pusakanagara, Ciherang and Sintanur had
highest yield at 5.70 ton ha-1 and 6.00 ton ha-1, respectively.
There were 12 lines, i.e. IPB 116-F-3-1 (5.83 ton ha-1), IPB
116-F-46-1 (6.36 ton ha-1), IPB 117-F-17-4 (5.40 ton ha-1),
IPB 117-F-17-5 (5.73 ton ha-1), IPB 117-F-18-3 (5.11 ton
ha-1), IPB 140-F-1-1 (5.62 ton ha-1), IPB 140-F-2-1 (5.91
ton ha-1), IPB 140-F-5 (5.19 ton ha-1), IPB 149-F-2 (5.14
ton ha-1), B11738-MR-1-2-Si-1-2 (5.14 ton ha-1),
B11742-RS*2-3-MR-34-1-2-1 (5.96 ton ha-1), and
B11955-MR-84-1-4 (5.40 ton ha-1), yielded more than 5 ton ha-1 and were
not signi! cantly different from the check varieties. Average yield at Pusakanagara with lower elevation than Bogor was higher, in DS and WS. Imran (2003) reported similar result, in which Gilirang had higher yield at elevation 10 m asl at Takalar (7.2-7.5 ton ha-1) than 800 m asl at Soppeng
(4.8 ton ha-1), in South Sulawesi.
B11742-RS*2-3-MR-34-1-2-1 was the line that had the lowest yield in the WS and reached 0.53 ton ha-1
only. Yield reduction until 50% in the WS, both in Bogor and Pusakanagara could not be regarded as the worst performance of the line. This line was severely damage
caused by rats attack and infested by leaf blight (BLB) as a result of unfavorable weather with high rainfall. Sintanur was also sensitive to BLB. Some lines were destroyed by rat attack and also by BLB. Some of the sensitive lines, showed a symptom of drying leaf tips at primordial growth stage. Islam et al. (2010) reported that NPT lines IR2967-12-2-3 produced signi! cantly lower yield in WS 2004 than in the DS 2005 at the research farm of the IRRI. Previous research by Yoshida (1981) reported that maximal grain yield of rice was 10 ton ha-1 in the DS and 6 ton ha-1 in the WS in tropical
irrigated rice system under normal conditions.
Yield Stability
Stability analysis is an important and ef! cient tool for the plant breeders and agronomists to identify and select the most stable, high performing genotypes that are best suitable under a given set of environmental conditions.
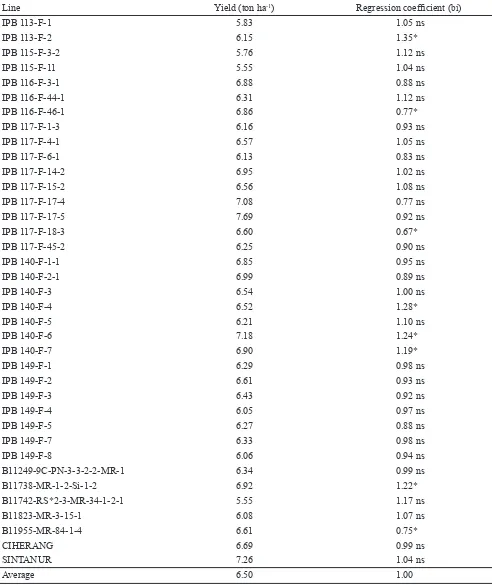
Assessment of lines stability and adaptability were tested following the test method of Finlay-Wilkinson (1963), based on regression coef! cient (bi) and the general mean. Regression coef! cient (bi) of nine lines was signi! cantly different from one, they were IPB 113-F-2, IPB-116-F 46-1, IPB-117-F 17-4, IPB 117-F-18-3, IPB 4, IPB 140-F-6, IPB 140-F-7, B11738-MR-Si 1-2, 1-2, and B11955-MR-84-1-4 (Table 3). Five lines, i.e. IPB 113-F-2, IPB 140-F-4, IPB 140-F-6, IPB 140-F-7, and B11738-MR-Si-1-2-1-2, was only adapted to optimum environmental conditions (Azar et al., 2008). Those lines were sensitive to environmental changes. While the four others, namely IPB 116-F-46-1, IPB-117-F 17-4, IPB-117-F 18-3 and B11955-MR-84-1-4 were classi! ed as adaptable to marginal environments.
From the value of bi and yield averages of 37 lines, there were nine lines having wide adaptability to the environment because they had a bi values equal to one and the average score higher than general mean. The lines were IPB 116-F-3-1, IPB 117-F-4-1, IPB 117-F-14-2, IPB 117-F-15-2, IPB 117-F-17-5, IPB 1-1, IPB 140-F-2-1, IPB 140-F-3, and IPB 149-F-2, including Ciherang and Sintanur. With the change of environment, those lines had only a few changes in yield. It could be seen from the average value of line yield, which have a high yield (> 6.5 ton ha-1) in all environments. These lines were stable and
have wide stability. Samaullah and Ismail (2009) reported that upland rice line S3382-2D-1-6-3 gave highest yield and was considered the most stable genotype among 11 others in nine locations.
Line
Yield (ton ha-1)
Bogor 2009 DS Bogor 2009 WS
Pusakanagara 2009 DS
Pusakanagara 2009 WS
Average
IPB 113-F-1 7.03 3.25 9.16 3.86 5.83
IPB 113-F-2 8.97 2.53 9.29 3.80 6.15
IPB 115-F-3-2 7.25 3.14 9.15 3.52 5.77
IPB 115-F-11 6.66 3.36 8.95 3.24 5.55
IPB 116-F-3-1 8.63 4.13 8.94 5.83 6.88
IPB 116-F-44-1 8.94 4.09 8.75 3.44 6.30
IPB 116-F-46-1 7.84 4.15 9.10 6.36 6.86
IPB 117-F-1-3 6.81 3.89 9.48 4.45 6.16
IPB 117-F-4-1 9.15 4.93 8.85 3.39 6.58
IPB 117-F-6-1 6.30 4.05 9.42 4.74 6.13
IPB 117-F-14-2 9.16 4.73 9.33 4.57 6.95
IPB 117-F-15-2 8.96 4.72 9.08 3.48 6.56
IPB 117-F-17-4 8.78 5.33 8.80 5.40 7.08
IPB 117-F-17-5 10.17 5.51 9.35 5.73 7.69
IPB 117-F-18-3 8.01 5.09 8.18 5.11 6.60
IPB 117-F-45-2 8.12 4.13 8.41 4.40 6.26
IPB 140-F-1-1 8.68 3.95 9.14 5.62 6.85
IPB 140-F-2-1 8.91 4.21 8.94 5.91 6.99
IPB 140-F-3 8.42 4.88 9.15 3.70 6.54
IPB 140-F-4 9.22 3.07 9.45 4.35 6.52
IPB 140-F-5 8.34 2.51 8.81 5.19 6.21
IPB 140-F-6 11.00 4.63 9.09 3.99 7.18
IPB 140-F-7 10.09 3.82 9.06 4.64 6.90
IPB 149-F-1 7.80 4.38 9.11 3.87 6.29
IPB 149-F-2 9.02 3.95 8.31 5.14 6.60
IPB 149-F-3 9.04 4.53 8.07 4.13 6.44
IPB 149-F-4 7.75 3.63 8.60 4.23 6.05
IPB 149-F-5 7.65 4.41 8.83 4.26 6.29
IPB 149-F-7 8.04 4.05 8.93 4.27 6.33
IPB 149-F-8 7.40 4.32 8.88 3.64 6.06
B11249-9C-PN-3-3-2-2-MR-1 8.00 4.39 9.09 3.88 6.34
B11738-MR-1-2-Si-1-2 10.38 3.26 8.90 5.14 6.92
B11742-RS*2-3-MR-34-1-2-1 5.72 0.53b 10.00 5.96 5.55
B11823-MR-3-15-1 7.65 3.71 9.21 3.74 6.08
B11955-MR-84-1-4 8.40 4.49 8.14 5.40 6.61
CIHERANG 9.22 3.36 8.50 5.70 6.69
SINTANUR 9.55 4.00 9.48 6.00 7.26
Average 8.41 3.98 8.97 4.61 6.50
Table 2. Yield of NPT lines in four environmental conditions
Line Yield (ton ha-1) Regression coef! cient (bi)
IPB 113-F-1 5.83 1.05 ns
IPB 113-F-2 6.15 1.35*
IPB 115-F-3-2 5.76 1.12 ns
IPB 115-F-11 5.55 1.04 ns
IPB 116-F-3-1 6.88 0.88 ns
IPB 116-F-44-1 6.31 1.12 ns
IPB 116-F-46-1 6.86 0.77*
IPB 117-F-1-3 6.16 0.93 ns
IPB 117-F-4-1 6.57 1.05 ns
IPB 117-F-6-1 6.13 0.83 ns
IPB 117-F-14-2 6.95 1.02 ns
IPB 117-F-15-2 6.56 1.08 ns
IPB 117-F-17-4 7.08 0.77 ns
IPB 117-F-17-5 7.69 0.92 ns
IPB 117-F-18-3 6.60 0.67*
IPB 117-F-45-2 6.25 0.90 ns
IPB 140-F-1-1 6.85 0.95 ns
IPB 140-F-2-1 6.99 0.89 ns
IPB 140-F-3 6.54 1.00 ns
IPB 140-F-4 6.52 1.28*
IPB 140-F-5 6.21 1.10 ns
IPB 140-F-6 7.18 1.24*
IPB 140-F-7 6.90 1.19*
IPB 149-F-1 6.29 0.98 ns
IPB 149-F-2 6.61 0.93 ns
IPB 149-F-3 6.43 0.92 ns
IPB 149-F-4 6.05 0.97 ns
IPB 149-F-5 6.27 0.88 ns
IPB 149-F-7 6.33 0.98 ns
IPB 149-F-8 6.06 0.94 ns
B11249-9C-PN-3-3-2-2-MR-1 6.34 0.99 ns
B11738-MR-1-2-Si-1-2 6.92 1.22*
B11742-RS*2-3-MR-34-1-2-1 5.55 1.17 ns
B11823-MR-3-15-1 6.08 1.07 ns
B11955-MR-84-1-4 6.61 0.75*
CIHERANG 6.69 0.99 ns
SINTANUR 7.26 1.04 ns
Average 6.50 1.00
Table 3. Stability analysis of NPT lines in four environmental conditions
Note: ns = not signi! cantly different from bi = 1; * = signi! cantly different from bi = 1
CONCLUSION
NPT lines yielded higher than Ciherang (6.69 ton ha-1),
were 116-F-IPB 3-1 (6.88 ton ha-1), IPB-116-F 46-1 (6.88
ton ha-1), IPB-117-F 14-2 (6.95 ton ha-1), IPB-117.F 17-4
(7.08 ton ha-1), and B11738-MR-1-2-Si-1- 2 (6.92 ton ha-1).
IPB 113-F-2, IPB 140-F-4, IPB 140-F-6, IPB 140-F-7, and B11738-MR-Si-1-2-1-2 were not stable and adapted only in optimum environmental condition (bi > 1), while IPB 116-F-46-1, IPB-117-F 17-4, IPB-117-F 18-3 and B11955-MR-84-1-4 has the value of bi < 1 or adaptable to marginal environments.
ACKNOWLEDGEMENT
This research was supported by a grant from SEAMEO-SEARCA (Southeast Asian Regional Center for Graduate Study and Research in Agriculture), Philippines. The Competency Grant 2009 No. 219/SP2H/PP/DP2M/ V/2009 and 2010 No. 224/SP2H/PP/DP2M/III/2010 from Directorate General of Higher Education, Department of National Education and I-MHERE B.2.C Bogor Agricultural University, 2010 No. 14/1324.4/SPP/I-MHERE/2010, to Dr. Ir. Hajrial Aswidinnoor, MSc.
REFERENCES
Adnyana, M.O., J.S. Munarso, D.S Damardjati. 2008. Ekonomi kualitas beras dan selera konsumen. p. 483-499. In F. Kasryno, E. Pasandaran, A.M. Fagi (Eds.) Ekonomi Padi dan Beras Indonesia. Badan Litbang Pertanian. Jakarta.
Allard, RW. 1960. Principle of Plant Breeding. John Wiley & Sons. Inc. New York
Asad, M.A., H.R. Bughio, I.A. Odhano, M.A. Arain, M.S. Bughio. 2009. Interactive effect of genotype and environment on the paddy yield in Sindh province. Pak. J. Bot. 41:1775-1779.
Azar, M.S., G.A. Ranjbar, H. Rahimian, H. Are! . 2008. Grain yield stability and adaptability study on rice (Oryza sativa) promising lines. J. Agric. Soc. Sci. 4:27-30.
Dakheel, A.J., G. Shabbir, A.Q. Al-Gailani. 2009. Yield stability of pearl millet genotypes under irrigation with different salinity levels. Europ. J. Sci. Res. 37:288-301.
Eberhart, S.A., W.A. Russel. 1966. Stability parameters for comparing varieties. Crop. Sci. 6:36-40.
Finlay, K.W., G.N. Wilkinson. 1963. The analysis of adaptation in a plant breeding programme. Aust. J. Ag. Res. 14:742-754.
Gomez, K.A., A.A. Gomez. 1995. Statistical Procedures for
Agricultural Research. John Wiley and Sons, Inc., Canada.
Haryanto, T.A.D., Suwarto, T. Yoshida. 2008. Yield stability of aromatic upland rice with high yielding ability in Indonesia. Plant Prod. Sci. 11:96-103.
Imran, A. 2003. Penampilan padi aromatik Varietas Gilirang di Sulawesi Selatan. Bul. Plasma Nutfah 9:7-9.
Islam, M.S., S. Peng, R.M. Visperas, M. Sultan, U. Bhuiya, S.M.A. Hossain, A.W. Jul! quar. 2010. Comparative study on yield and yield attributes of hybrids, inbred, and NPT rice genotypes in a tropical irrigated ecosystem. Bangladesh J. Agric. Res. 35:343-353.
Jusuf, M., S.A. Rahayuningsih, T.S. Wahyuni, J. Restuono. 2008. Adaptasi dan stabilitas hasil klon harapan ubi jalar. J. Penel. Pert. Tan. Pangan 27:37-41.
Khush, G.S. 2000. New plant type of rice for increasing the genetic yield potential. p. 99-108. In J.S. Nanda (Ed.) Rice Breeding and Genetics: Research Priorities and Challenges. Science Publishers, Inc., En! eld USA.
Lone, A.A., P.A. So! , M.Z. Warsi, S.H. Wani. 2009. Stability analysis in maize (Zea mays L.) for anthesis-silking interval and grain yield. Maize Genet. Coop. Newslett. 83:1-9.
Nur, A., M. Isnaeni, R.N. Iriany, A. Takdir. 2007. Stabilitas komponen hasil sebagai indikator stabilitas hasil genotipe jagung hibrida. J. Penel. Pert. Tan. Pangan 26:106-113.
Samaullah, M.Y., B.P. Ismail. 2009. Stabilitas dan adaptabilitas genotipe padi pada beberapa lingkungan gogo rancah. J. Penel. Pert. Tan. Pangan 28:39-42.
Soroush, R. 2005. Study of grain yield stability in rice (Oryza sativa L.) promising genotypes. Iranian J. Crop Sci. 7:112-122.
[UNCTAD] United Nations Conference on Trade and Development. 2010. Rice Market. http://www. unctad.org/infocomm/anglais/rice/market.htm. [9 July 2010].
Yoshida, S. 1981. Fundamentals of Rice Crop Science. IRRI, Los Banos, Philippines.