DOI: 10.12928/TELKOMNIKA.v13i1.1180 1
Variable Step Size Perturb and Observe MPPT for PV
Solar Applications
Awang Bin Jusoh*1, Omer Jamal Eldin Ibrahim Mohammed2, Tole Sutikno3
1,2
Faculty of Electrical Engineering, Universiti Teknologi Malaysia 81310 Johor Bahru, Malaysia
3
Department of Electrical Engineering, Faculty of Industrial Technology, Universitas Ahmad Dahlan, Yogyakarta 55164, Indonesia
*Corresponding author, email:[email protected], [email protected], [email protected]
Abstract
In order to deliver maximum output of photovoltaic (PV) cells, the usage of maximum power point tracking (MPPT) is essential. The speed and stability of the tracking technique are highly desired. Perturb and Observe (P&O) is one of the most common tracking techniques, but it suffers from the slow tracking speed at small duty cycle step and fluctuates when subjected with large duty step, which results in higher losses under dynamic weather to which the photovoltaic (PV) cells exposed. In this paper, variable step size Perturb and Observe is introduced throughout Matlab/Simulink simulation to overcome this problem to achieve higher efficiency, reliable tracking accuracy and higher speed under fast changing weather. In comparison with other variable P&O techniques, the proposed method features a dynamic step size for more tracking efficiency and accuracy. Double diode modelling is used in this technique for better photovoltaic (PV) cell’s characteristic prediction. In this study, the adapted technique had been tested to wide range of sun irradiance and operation temperatures.
Keywords: double diode modelling, PV solar, MPPT, perturb and observe, matlab/Simulink
1. Introduction
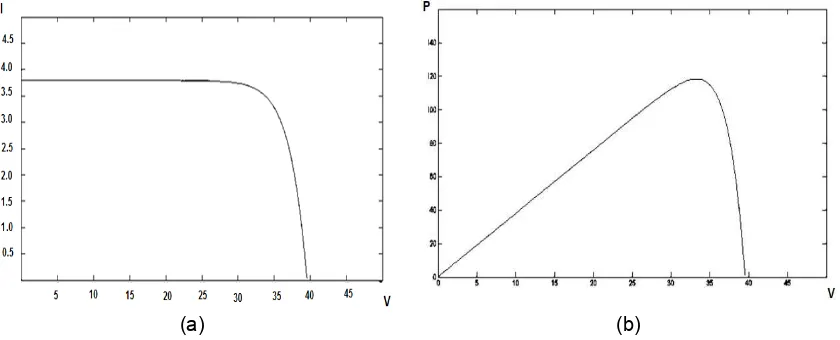
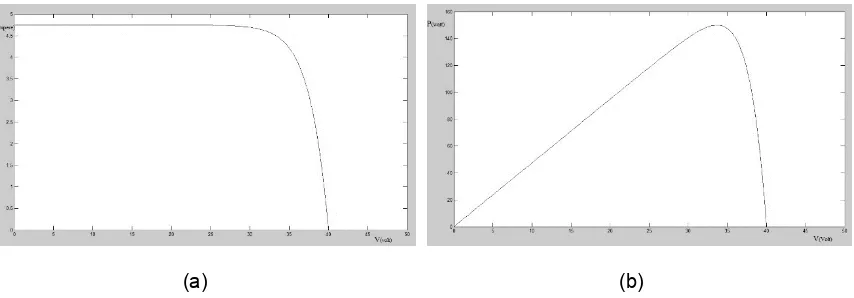
PV cells are recognised for having non-linear characteristics. At one point, which is known as the maximum power point (MPP), the cells are capable to operate at maximum efficiency and give the maximum output [1]-[4]. Figure 1 shows the V-I and V-P characteristics of a typical 150W PV cell. The V-I and V-P can be distinguished from how their load is applied, either from short circuit to open circuit, i.e. from zero loads to infinity.
(a) (b)
Figure 1. V-I and V-P characteristics of a typical 150W PV cell; (a). V-I (b). V-P
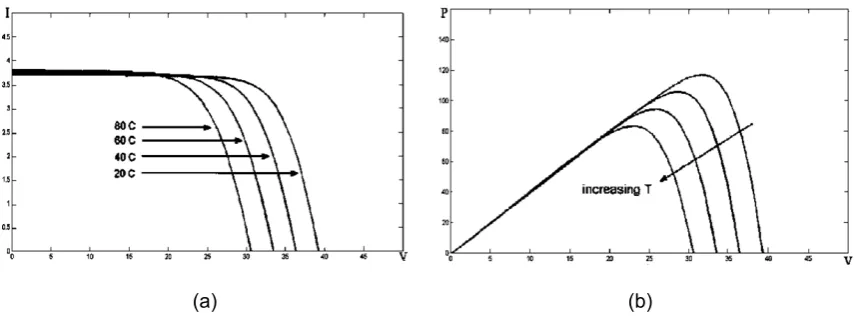
V-P characteristics with respect to solar irradiance when the temperature is fixed. When the solar irradiance changes, the point of maximum shifts; for example, the PV cell output current decreases dramatically when the solar irradiance decreases. In Figure 3, it is noticeable that the increase of PV cell temperature causes a significant drop in the output voltage as well as output power.
(a) (b)
Figure 2. V-I and V-P characteristics under variable radiations; (a). V-I (b). V-P
(a) (b)
Figure 3. V-I and V-P characteristics under variable temperature;(a). V-I (b). V-P
2. PV cell equivalent circuits
The PV cell can be modelled either using single diode for ease of calculation, or double diode for better accuracy, efficiency and prediction of the characteristics during partial shading [4],[6].
2.1 PV cell single diode equivalent circuit
As illustrated in Figure 4, the PV cell can be implemented by integrating a current source, one exponential diode, and parallel-series equivalent resistance, where V and I represent the terminal voltage and the current. For certain temperature and irradiance, the output current of the solar panel can be calculated as follows:
, (2)
Figure 4. Single diode equivalent circuit of Solar cell
2.2 PV cell double diode equivalent circuit
In the double diode circuit as shown in Figure 5, the solar cell is represented by two exponential diodes. One is an ideal diode, while another is non-ideal.
Figure 5.Double diode equivalent circuit of solar cell
I N I I I I (3)
I I , K T T (4)
I I e (5)
I I e (6)
I (7)
where current generated by incidence light, , series and shunt equivalent
resistance, , diode current, .6 ∗ (electron charge), . 8 ∗ /
, cell surface temperature in Kelvin, reference temperature in Kelvin, (25°C), temperature coefficient of SC in percent change per degree,
3. Perturb and Observe (P&O)
Perturb and Observe is the most commonly used method in practice for its simplicity and ease of implementation [7]-[10]. In this method, the output voltage of the solar panel is perturbed periodically, and then the output power is compared to the previous cycle. Next, corrective action is taken to enforce the voltage to move toward the maximum operation output voltage. The comparison can determine the position of the operation point and the direction of perturbation [11]-[14].
In total, there are three positions and two directions involved. Figure 6 and Table 1 demonstrate the possible positions and directions during the perturbation and observation process and also the required action [15]-[18] in each case to achieve the maximum power output.
Figure 6.P&O MPPT positioning
Table 1.P&O MPPT positioning and taken action in each case
Position Variations Action
1 0dP No action taken
2 +dP /+dV increase V
3 +dP /-dV decrease V
4 -dP /-dV increase V
5 -dP /+dV decrease V
4. Proposed variable step size Perturb and Observe
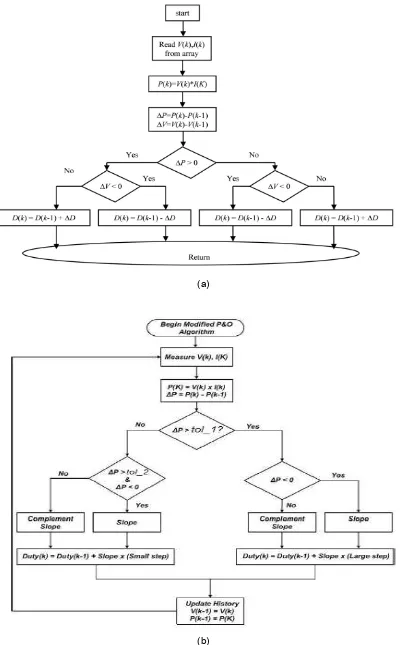
Large step duty cycle has a fast response but experiences noticeable fluctuation around the point of maximum output of a PV module. Meanwhile, small step duty cycle has a slower tracking speed at the start of operation and under dynamic weather, but results in smoother perturbation .The vibration of the large step and the slow speed of associate in power loss are not desired. Benefiting from the high speed of large duty cycles and the soft tracking of the small duty cycle, the proposed variable Perturb and Observe method states that if the perturbation is toward the maximum power point, the duty cycle is increased by multiplication by a factor (A) i.e. ∆P>0. However, if ∆P<0, the duty cycle should be divided by (A), in which this factor is a constant and greater than 1. Figure 7(a) shows the flow chart of the conventional P&O, where fixed duty increment is applied. In Figure 7(b), the flow chart of the proposed technique is presented. In comparison, other variable P&Os, as mentioned in reference [13], utilize two different duty cycles, one is relatively large, used at the beginning of perturbation, and the other is small, used when the system vibrates around maximum power point. This method has a dynamic step size of the duty cycle, which increases its speed, resulting in higher efficiency.
(a)
(b)
5. Simulation and Results
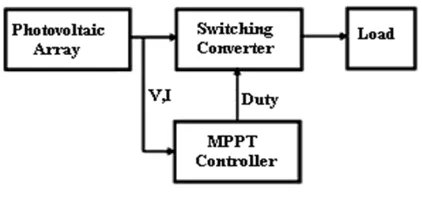
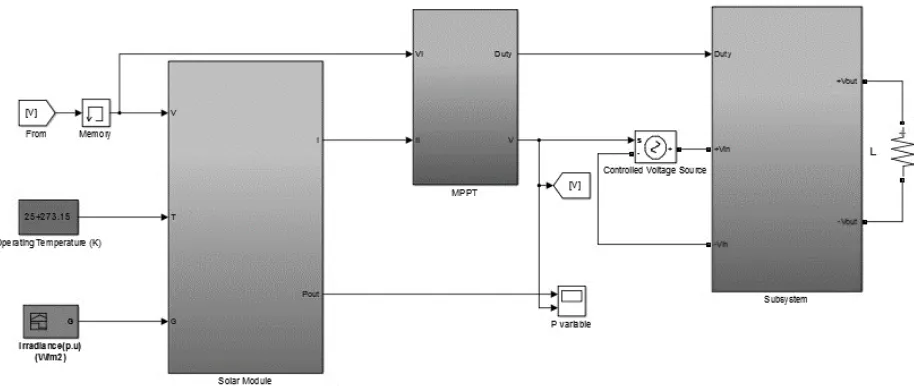
Photovoltaic solar system consists of PV array, switching converter, MPPT controller and load, which may be a DC load, battery charger or inverter. The input(s)/output(s) of MPPT controller may differ from one method to another. Figure 8 shows the block diagram of a typical MPPT system.
Figure 8. Solar MPPT System
In this study, a 150 W solar panel with the following specification was used in the simulation.
Table 2. PV solar panel data
Temparature coefficient of ISC 0.065±0.15%/°C
Temparature coefficient of Voc -160±20mV/°C
Temparature coefficient of power -0.5±0.05%/°C
Ideality factor 1.2
In this simulation, boost converter was used to function in continuous current mode. The values of the capacitor and inductor had been calculated for suitable range of duty cycle, and then the highest values were chosen. Table 3 shows the specification of the boost converter’s components. Switching frequency of 40 kHz was used slightly above the audiable noise.
Table 3. Boost converter component specification
Parameter Value
Figure 9.Simulink subsystem of PV module
Figure 10 shows the V-I and V-P characteristic under Standard Test Condition (STC), where G=1000W/m2 and T=25°C. This result was obtained from the circuit as shown in Figure 9.
(a) (b)
Figure 10. V-I and V-P characteristic under Standard Test Condition (STC); (a) V-I characteristic of PV module (b) V-P characteristic of PV module
Figure 11. Simulink model of P&O MPPT system
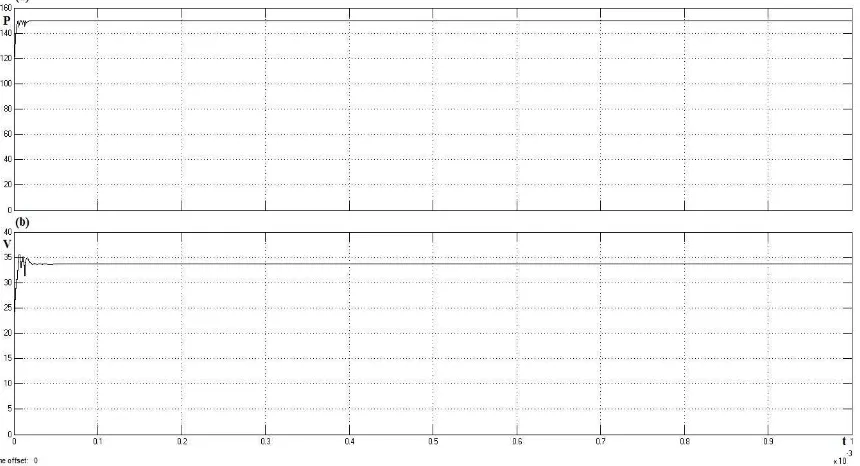
Figure 12 shows the output of large step duty cycle. It had a fast response but also experienced noticable fluctuation around the point of maximum output of a PV module. It took 0.05 m seconds but stabilized at 0.5 milli-second. The vibration of the large step reduced the efficiency, which was not desired.
Figure 12.(a) Solar module output power (b) Solar module output voltage Condition: Duty cycle step of 0.5V, 25°C, unity irradiance
Figure 13.Output of small step duty cycle; (a) Solar module output power (b) Solar module output voltage - condition: duty cycle step of 0.05V, 25°C, unity irradiance
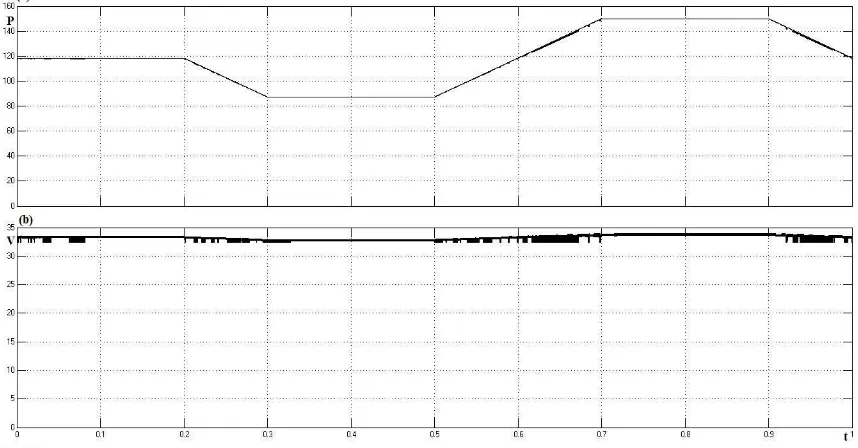
Figure 14.Plot of(a) Solar module output power (b) Solar module output voltage Condition: Variable duty cycle, 25°C, unity irradiance
the system fluctuation was less harsh with any irradiance change. However, the tracking speed was slower, in which the power lost under changing weather.
Figure 15.Plot of(a) Solar module output power (b) Solar module output voltage Condition: Duty cycle step of 0.5V, 25°C, variable irradiance input
Figure 16.Plot of(a) Solar module output power (b) Solar module output voltage condition: duty cycle step of 0.05V, 25°C, variable irradiance input
Figure 17.Plot of(a) Solar module output power (b) Solar module output voltage Condition: A variable duty cycle, 25°C, variable irradiance input
6. Conclusion
In this paper, a new variable step size P&O has been introduced, which shows significant improvement in terms of tracking speed, accuracy and efficiency without additional cost with respect to the conventional P&O MPPT. The proposed modified P&O MPPT has successfully combined the speed of relatively large step size P&O and the smooth tracking of the small step size P&O.
Acknowledgement
The authors would like to express gratitude to Ministry of Education (MOE) and Universiti Teknologi Malaysia (UTM) for the financial support provided under Research University Grant (RUG) Q.J.130000.2523.07H82 and also to Research Management Centre (RMC) for the support and co-operation in the research work.
References
[1] Emilio M, Giovanni P, Giovanni S. Two-steps algorithm improving the P&O steady state MPPT efficiency. Applied Energy. 2014; 113: 414–421.
[2] Jancarle LS, Fernando A, Anis C, Cícero CA. Maximum power point tracker for PV systems using a high performance boost converter. Solar Energy. 2006; 80(7): 772–778.
[3] Ali AG, Seyed MS, Asma S. A high performance maximum power point tracker for PV systems. International Journal of Electrical Power & Energy Systems. 2013; 53: 237–243.
[4] Pallavee B, RK Nema. Maximum power point tracking control techniques: State of art in PV application. Renewable and Sustainable Energy Reviews. 2013; 23: 224–241.
[5] Femia N, Petrone G, Spagnuolo G, Vitelli M. Increasing the efficiency of P&O MPPT by converter dynamic matching. 2004 IEEE International Symposium on Industrial Electronics. 2004; 2: 1017– 1021.
[6] Liu X, Lopes LAC. An improved perturbation and observation maximum power point tracking algorithm for PV arrays. Power Electronics Specialists Conference. 2004; 3: 2005–2010
[7] Jusoh A, Sutikno T, Guan TK, Mekhilef A. A Review on Favourable Maximum Power Point Tracking Systems in Solar Energy Application. TELKOMNIKA Telecommunication, Computing, Electronics and Control. 2014; 12(1): 6-22.
[9] Surya KJ, Sai BCH, Kamalakar BA. Design and analysis of P&O and IP&O MPPT techniques for photovoltaic system. Int. J. Modern Eng. Res. (IJMER). 2012; 2(4): 2174–2180.
[10] Dong J, Zhang CJ, Li YB. Comparison of duty ratio perturbation & observation and reference voltage perturbation & observation methods applied in MPPT. Power Electronics and Motion Control Conference (IPEMC). 2012; 2: 1358–1362.
[11] Youngseok J, Junghun S, Gwonjong Y, Choi J. Improved perturbation and observation method (P&O) of MPPT control for photovoltaic power systems. Photovoltaic Specialists Conference. 2005: 1788–1791.
[12] Femia N, Petrone G, Spagnuolo GV. Perturb and observe MPPT technique robustness improved. 2004 IEEE International Symposium on M. Industrial Electronics. 2004; 2: 845–850.
[13] Mutoh N, Ohno M, Inoue. A Method for MPPT Control While Searching for Parameters Corresponding to Weather Conditions for PV Generation Systems. IEEE Transactions on T. Industrial Electronics. 2006; 53(4): 1055–1065.
[14] Khaehintung N, Wiangtong T, Sirisuk P. FPGA Implementation of MPPT Using Variable Step-Size P&O Algorithm for PV Applications. International Symposium on Communications and Information Technologies (ISCIT '06). 2006: 212–215.
[15] Fermia N, Granozio D, Petrone G, Vitelli M. Predictive & Adaptive MPPT Perturb and Observe Method. IEEE Transactions on Aerospace and Electronic Systems. 2007; 43(3): 934–950.
[16] Femia N, Petrone G, Spagnuolo G, Vitelli M. A Technique for Improving P&O MPPT Performances of Double-Stage Grid-Connected Photovoltaic Systems. IEEE Transactions on Industrial Electronics. 2009; 56(11): 4473–4482.
[17] Piegari L, Rizzo R. Adaptive perturb and observe algorithm for photovoltaic maximum power point tracking. IET Renewable Power Generation. 2010; 4(4): 317–328.