O R I G I N A L P A P E R
Changes in the spatial variation of soil properties following
shifting cultivation in a Mexican tropical dry forest
Lucy O. Diekmann ÆDeborah LawrenceÆ Gregory S. Okin
Received: 2 May 2006 / Accepted: 6 February 2007 / Published online: 7 April 2007 Springer Science+Business Media B.V. 2007
Abstract The role of secondary vegetation in restoring soil fertility during shifting cultivation in the tropics is well known. Yet the effect of secondary succession on the spatial patterns of soil properties has received little attention. To determine whether changes in the plant commu-nity as a result of shifting cultivation affect the scale of spatial dependence for biologically important soil nutrients, we sampled three dry tropical forest stands in Campeche, Mexico. These stands represented a gradient of cultivation history: one mature forest stand, a forest fallow that had undergone one cultivation-fallow cycle, and a forest fallow that had undergone two cultivation-fallow cycles. We used an analysis of semivariance to quantify the scale and magnitude of spatial dependence for organic matter content (OM), phosphorus (P), potassium (K), and alu-minum (Al) in each stand. The scale of spatial
dependence varied with cultivation history, but the degree of spatial dependence did not differ among stands. In the mature forest P and K were autocorrelated over distances >7.5 m. In the forest fallows 48–88% of the variation in soil P and K was autocorrelated over distances up to 1.1–5.1 m. In contrast, the range of autocorrela-tion for Al (~2.5 m) did not differ among stands. We conclude that shifting cultivation changes the range of autocorrelation for biologically impor-tant soil nutrients at a scale that may influence plant growth. The finer scaled pattern of soil nutrients in forest fallows is likely to persist with continued shifting cultivation, since fallows are cleared every 3–15 years.
Keywords Tropical dry forestGeostatistics
Mexico Shifting cultivationSoil nutrients
Spatial heterogeneity
Introduction
Resource gradients and environmental heteroge-neity are common features of ecological commu-nities (Robertson and Gross 1994). In soils the combined effect of biota and differences in topography, climate, age, and parent material create variation on local to regional scales (Jenny 1941), yet spatial patterns are rarely made explicit in studies of soil properties. Research in tropical L. O. Diekmann (&)
Department of Environmental Science, Policy and Management, University of California, Berkeley, 137 Mulford Hall #3114, Berkeley, CA 94720, USA e-mail: [email protected]
D. Lawrence
Department of Environmental Sciences, University of Virginia, Charlottesville, VA 22904, USA
G. S. Okin
Department of Geography, UCLA, Los Angels, CA 90095, USA
(Fernandes and Sanford1995; Døckersmith et al. 1999), temperate (Boettcher and Kalisz1990), and arid (Schlesinger et al. 1996) ecosystems has shown that individual plants have a lasting effect on the chemical distribution of soil nutrients, contributing to the spatial heterogeneity of soil properties at a site. In fact, the impact of secondary vegetation on soil fertility is the basis of shifting cultivation in the tropics (Nye and Greenland1960; Brown and Lugo 1990; Døckersmith et al. 1999). Despite its influence on soil chemistry following cultivation, little is known about how secondary succession might also affect the spatial distribution of soil nutrients, or how spatial patterns may change with repeated disturbance and regrowth, as occurs in shifting cultivation.
If plants are an important source of heteroge-neity in soil properties, large changes in the plant community, like those that occur during cultiva-tion and succession, should produce changes in soil heterogeneity. Plants’ ability to create, main-tain and exploit spatial heterogeneity may be a factor affecting species succession (Stark 1994) and the establishment and survival of seedlings (Huante et al. 1995; Lawrence 2003). Therefore, the scale and extent of spatial heterogeneity in soil properties may influence species composition, distribution, and performance and possibly eco-system-level processes in secondary forests (Rob-ertson and Gross 1994; Gallardo 2003). If the spatial distribution of nutrients evolves over many cycles of disturbance and recovery, the species composition of secondary forests may continue to change (Lawrence et al.2005).
The objective of this study was to determine whether repeated disturbance from shifting culti-vation affects the distribution of soil properties in a Mexican tropical dry forest. Our initial hypoth-eses were that (1) changes in the size and structure of the plant community caused by forest clearing and regrowth would be accompanied by changes in the scale of soil variability; and (2) changes in soil spatial patterns associated with shifting cultivation would be most clearly re-flected in biologically important elements (e.g. phosphorus). Therefore, we expected the scale of spatial patterning for biologically important soil nutrients to be smaller in secondary than in mature forest stands. To explore spatial patterns
in soil properties, we intensively sampled three forest stands in an ejido in Campeche, Mexico. These included two secondary forest stands that were the same successional age but had different cultivation histories. A third stand, a mature forest that had not been cultivated in recent memory, was included for comparison. Because of the proposed connection between vegetation and spatial patterning in the soil, we surveyed the vegetation at these sites in addition to sampling soil properties. Using geostatistical measures of spatial variability, we described the degree and extent of spatial variability present at the study sites for different soil properties.
Methods
Study area
In May 2003 fieldwork was conducted in El Refugio (1849¢N, 8927¢W), an ejido located along the northeastern boundary of the Calakmul Biosphere Reserve in Campeche, Mexico. This area is part of a karstic upland, characterized by rolling limestone hills 20–60 m high (Turner 1974). Soils are shallow and calcareous with a high pH because of the calcium-carbonate-rich parent material. El Refugio has a mean annual temperature of 24.4C and receives ca. 890 mm of rain annually although precipitation is highly variable both seasonally and interannually. The typical dry season begins between November and January and lasts from 5 to 7 months (Lawrence and Foster 2002). Due to the pronounced dry season, the dominant vegetation in this region is characteristic of a tropical dry forest.
industry boomed, but by the 1980s the most economically valuable species, mahogany and Spanish cedar, had been almost completely elim-inated (Turner et al. 2001; Klepeis 2004). Cur-rently, conversion of forest for agriculture is the leading cause of deforestation. Beginning in the late 1960s, government sponsorship of the ejido
system (communal land tenure) encouraged an influx of settlers from other regions in Mexico. The area continues to attract new settlers to engage in subsistence production of maize and increasingly the cultivation of jalapen˜os for mar-ket (Keys2005).
Farmers in this region practice shifting culti-vation. After the slash-and-burn clearing of a tract of land, they cultivate it for several years, then abandon it, allowing secondary vegetation to grow until they are ready to clear and cultivate that parcel again. The process begins each year in March, when farmers clear a 1–2 ha plot. Cut vegetation is burned after having dried in the field for 3–6 weeks. Following the fire, stumps, logs, or large branches that have not been fully consumed remain in the field, but no trees are left standing. Once the field has been prepared in this manner, farmers use a 2 m-long stick to create small holes for the kernels, which are usually planted less than half a meter apart. These fields, known locally asmilpa, may occasionally be weeded but they do not receive pesticides or fertilizers. After a field has been cultivated, it is abandoned, typically for 3–15 years, until the farmer decides to clear it again and the process starts over (Eaton and Lawrence 2006). A complete cultivation-fallow cycle encompasses clearing, cultivation, and a fallow period.
Within El Refugio, three forest stands were selected to represent a gradient of cultivation history while minimizing differences in succes-sional age. Based on interviews with local farm-ers, we selected two 8-year old secondary forest fallows that had been used exclusively to cultivate maize without the input of chemical fertilizers. One secondary forest stand had undergone only one cultivation-fallow cycle (subsequently re-ferred to as ‘one-fallow’ forest). It had been cleared from mature forest, farmed for two consecutive years, and then abandoned 8 years prior to sampling. The second forest fallow had
experienced two cultivation-fallow cycles (‘two-fallow’ forest). After being cleared from mature forest, it was cultivated for three consecutive years, and lay fallow for 6–7 years. Then it was cleared again, cultivated for another 3 years, and had been fallow for 8 years. The third stand, a mature forest, was managed by the sameejiditario
who farmed the two-fallow forest and these two stands were separated by less than 1 km. Like the stands that have been converted to agriculture, all mature forest stands in El Refugio may have been selectively logged in the past 40–100 years, but none have been cultivated in recent memory. Therefore, though this stand may have been selectively logged, it represents a pre-cultivation state and serves as a good comparison for the agriculturally disturbed stands (Read and Law-rence, 2003). There is little soil disturbance associated with the no-till agriculture practiced in El Refugio, so differences in soil nutrients between mature and secondary forests are largely due to the impact of fire, harvest, and regrowth. Field sampling and laboratory analysis
recorded for all trees along the transects with dbh >1 cm. Trees >5 cm dbh were documented within a 6·15 m rectangle bisected longitudinally by each transect (total sampling areas 144 m2/plot); stems 1–5 cm dbh were recorded within a 1 ·15 m rectangle bisected longitudinally by each transect (total sampling area 29 m2/plot). We expect this sampling design to capture heter-ogeneity in these stands because they tend to be small (£2 ha) and low-statured (mean height 7.6 m for mature forest trees 5–10 cm dbh, 12.6 m for mature forest trees >10 cm dbh, Vester et al. 2007). Moreover, in all three forest stands included in this study, mean interstem distance is <2.25 m for stems >5 cm dbh and <1.5 m for stems 1–5 cm dbh (Table4).
After sampling, soils were air dried, then passed through a 2 mm sieve. Soil samples were analyzed by Brookside Laboratories (New Knox-ville, OH) for Mehlich III extractable Ca, Mg, K, P, S, Mn, Cu, Zn, B, Fe, and Al (by Inductively Coupled Plasma Spectrometry). Soil organic matter content (OM) was determined by loss on ignition (LOI) at 360C; soil pH was determined in a 1:1 H2O solution; and total cation exchange
capacity (TEC) was calculated using the summa-tion method (M. Flock, personal communicasumma-tion). LOI has a tendency to overestimate soil organic matter because of the loss of CO2from
carbon-ates and of structural water from clays (Frog-brook and Oliver 2001; De Vos et al. 2005). However, LOI was performed on our samples at 360C, which should minimize the effect of these losses since carbonates are stable at temperatures <500C (De Vos et al.2005) and the greatest loss of structural water occurs at >450C (Varvel et al. 2002; De Vos et al.2005). Moreover, studies have shown that the spatial patterns calculated from different soil organic carbon determination meth-ods are similar, even if the magnitude of the values these methods produce is different (Frog-brook and Oliver 2001; Ping and Dobermann 2006).
Statistical analysis
To determine the general distribution of nutrients at each plot, the mean, standard deviation, standard error, variance, and coefficient of
vari-ation were calculated for each soil property at each of the 6 plots using SAS (version 8.2, SAS Institute Inc., Cary, NC). One-way analysis of variance (ANOVA) was used to compare soil properties between stands and between plots. A post hoc comparison of means following a signif-icant ANOVA (P< 0.05) was done with a Tukey’s studentized range test.
We used variography to describe the spatial distribution of OM, P, K, and Al at each site. Organic matter, P, and K were selected because they are important for plant growth and their movement in the soil is, to varying degrees, biologically controlled. Aluminum was chosen because it is not essential to plant nutrition and its movement in the soil is geochemically controlled. A semivariogram (also known as a variogram) is a graphic representation of spatial autocorrelation that is made by plotting the semivariance for several distance intervals (Robertson and Gross 1994). The semivariance is calculated as:
cðhÞ ¼ 1
2NðhÞ
X
NðhÞ
½zðxiÞ zðxi þ hÞ2
where,c(h) is the semivariance,his the distance interval or lag,N(h) is the total number of pairs separated by distance h,z(xi) is the value of the specified property at location xi, andz(xi+h) is the value of that property at the location xi+h (Kaluzny et al. 1998). The distance interval (h) can represent either an exact distance (e.g. 20 cm), or a class of distances, (e.g. 10–30 cm).
Spatial autocorrelation is based on the idea that samples taken close together are more likely to have similar values than those that are further apart. If variance does not change with distance, the semivariogram is relatively flat. When spatial autocorrelation occurs the semivariance is small at short lag intervals, indicating that samples separated by a short distance are more similar, and increases as samples become further apart and less similar (Rossi et al.1992). Eventually the semivariance may rise to some asymptote, the sill (C+C0), that approximates the population
var-iance. The range (A0) is the distance at which the
variance at 0 lag distance because samples are perfectly autocorrelated with themselves. How-ever at very short lag distances, semivariance can deviate substantially from zero. The semivariance calculated at lag distances close to 0 (or more typically, projected to the y-axis) is called the nugget variance (C0) and represents either
exper-imental error or variability that occurs at a scale smaller than the sampling interval. Finally, the ratio of the spatially structured variance to the sample variance (C/C+C0) reveals the degree of
spatial dependence. As outlined by Robertson and Gross (1994), the ecologically significant functions of a semivariance analysis of soil resources are to determine whether spatial dependence or patch-iness exists for a resource, how distinct the patches are, and at what scale they occur.
S+ Spatial Stats (Version 1.5, Insightful Cor-poration, Seattle, Washington) was used to con-struct semivariograms and fit models to data for OM, P, K, and Al. Before fitting models to the semivariograms the data was checked for nor-mality and stationarity. Data that deviated from normality was transformed for the analysis of semivariance. We also checked the data for anisotropy and made directional variograms where appropriate. When the analysis of stationa-rity revealed a trend in the data along one sampling axis, we chose to make two directional semivariograms rather than one omnidirectional variogram that could be distorted by the trended data. Directional semivariograms made when the assumption of stationarity may have been vio-lated have been noted. We used the lag interval that produced the best semivariogram, therefore the lag intervals range from 20 to 50 cm, distances that are substantially less than the typical inter-tree distance. The analysis extends to a maximum distance of 7.5 m, which is approximately half the distance between the largest lag pair (Rossi et al. 1992). Given the different lag intervals used and the mix of omnidirectional and directional semi-variograms, the maximum and minimum number of pairs for each semivariance analysis varies. The minimum number of pairs ranged from 7 to 56 (mean = 20). The maximum number of pairs ranged from 21 to 220 (mean = 99; see Appendix 1 for a complete list of minimum and maximum pairs). We used unweighted nonlinear least
squares analysis to fit variogram models. For goodness of fit and ease of comparison, we applied spherical models to the semivariograms except where a linear model was more appropri-ate. We have chosen to focus on spherical models because they have been found to be a good fit to semivariograms of soil properties (Webster 1985; Schlesinger et al.1996). A linear model indicates that there is spatial autocorrelation in the dataset, but that the range of autocorrelation is greater than the maximum lag distance (7.5 m). If neither a spherical nor a linear model fit the semivario-gram, it was characterized as random. Cross-validation was used to evaluate how well vario-gram models estimated known values from the sample population, (GS+, version 7, Gamma Design Software, Plainwell, MI). All correlation coefficients between cross-validation estimates and actual values for spherical models are signif-icant with 99% confidence.
Results
Soils
Variation among stands
Comparing soil properties between the three forest stands and between the six plots shows that the mature forest and the two-fallow forest near by have similar soil nutrient concentrations (ANOVA, P> 0.05) (Table1). With higher pH, more OM, greater S, Ca, K, and lower Mn, Al, and Fe concentrations (Table1), these two stands appear more fertile than the one-fallow forest located about 2 km away. Organic matter content was greatest in the mature forest stand (15.0%), while P (25.9 lg/g) and K (385.1lg/g) were greatest in the two-fallow forest. The one-fallow forest had nearly 7 times as much Al as the other two stands.
Variation within stands
had similar concentrations throughout a plot (Table 2). In the mature and two-fallow forest, CVs were highest for Al, Zn, and Fe, and <25% for the remaining soil properties. Aluminum was the most variable soil property, with a CV of 73.6% in the two-fallow forest. Across all three sites the CVs for P, K, and OM were <35% and relatively low. Using spearman rank-correlation coefficients, we found strong positive correlations among pH, S, Ca, and Mg and among Al, Fe, and Mn (P£ 0.0006 with a bonferroni adjustment for multiple comparisons).
Spatial variation
The degree of spatial variability (C/C+C0)
differed little among sites or soil properties. In all three stands 62%–85% of the variance in OM, 58%–88% of the variance in P, 48%–65% of the variance in K was spatially dependent, and 53%– 76% of the variance in Al (Table3). Replicate plots showed similar degrees of spatial variability for OM and K in the one-fallow forest, and similar degrees of spatial variability for OM in the two-fallow forest. While cultivation history did
Table 1 The mean concentration of soil properties (0–
5 cm) for each of three stands of tropical dry forest in Campeche, Mexico
Mature forest n= 2
One-fallow n= 2
Two-fallow n= 2
Soil properties
Al 68.3a 469.7b 48.3c
Na 38.8a 40.0a 26.1b
OM (%) 15.0a 8.7b 12.6c
PH 7.9a 7.5b 8.0c
TEC (M.E./ 100 g)
56.5a 40.6b 82.7c
Macronutrients
Ca 10,547a 7,344b 15,570c
K 243.7a 166.3b 385.1c
Mg 362.0a 392.5b 446.5c
P 14.1a 12.1b 25.9c
S 38.7a 32.6b 40.4a
Micronutrients
B 2.9a 1.2b 2.0c
Cu 2.0a 1.9a 1.3b
Fe 12.1a 40.1b 7.4c
Mn 83.3a 115.1b 41.3c
Zn 1.4a 1.3a 1.9b
Two plots per stand were sampled. Statistically significant differences sites are represented with lowercase letters (a– c). All differences are significant at theP< 0.0001 level. Unless otherwise noted units are (lg/g)
Table 2 The coefficient of variation [(SD‚mean)·100%] of soil properties (0–5 cm) for each plot sampled in three stands
of tropical dry forest in Campeche, Mexico
Mature forest n= 80
Mature forest n= 80
One-fallow n= 80
One-fallow n= 80
Two-fallow n= 77
Two-fallow n= 81
Soil properties
Al 46.9 36.0 19.9 17.0 56.0 73.6
Na 10.3 18.0 22.6 20.5 17.3 16.2
OM 21.0 17.4 19.9 26.4 20.0 18.0
PH 1.2 0.7 4.2 4.9 1.4 0.8
TEC 15.2 7.9 29.3 13.2 15.4 13.5
Macronutrients
Ca 16.8 8.1 31.7 13.9 16.6 13.8
K 22.0 23.7 32.1 33.4 15.7 17.4
Mg 13.7 15.1 15.3 13.3 14.3 14.0
P 12.3 13.9 21.4 15.9 12.6 15.0
S 9.1 6.8 31.6 18.4 10.9 17.9
Micronutrients
B 16.8 13.7 26.7 13.8 19.5 12.0
Cu 34.8 28.4 18.7 24.0 20.6 16.7
Fe 50.1 38.6 22.9 24.7 22.2 63.2
Mn 23.1 20.9 21.5 48.2 18.5 21.5
not appear to affect the degree of spatial depen-dence, the range of autocorrelation differed between forest stands.
In the mature forest, semivariograms for both P and K were linear, indicating that soil P and K were autocorrelated over a distance >7.5 m in both plots (Figs.1, 2). A linear model indicates that there is spatial autocorrelation in the dataset, but that the range of the spatial autocorrelation is larger than the longest lag distance. There was no consistent spatial pattern for OM. In one of the mature forest plots, a directional semivariogram showed the range of autocorrelation for OM was 5.5 m; at the other plot a directional
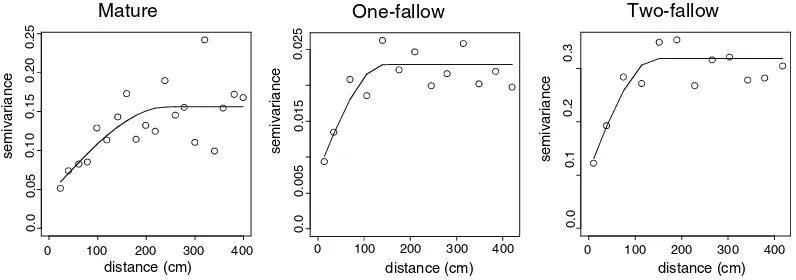
semivario-gram showed the variance in OM was random, indicating that OM was not spatially structured over the scale of analysis (Table3). In contrast, Al exhibited a clear pattern in the mature forest. Al was autocorrelated over distances of 2.4 and 3.5 m in the two mature forest plots (Fig.3). The nugget-to-sill ratios of these semivariograms indi-cated that 28%–40% of variance occurred at <0.3 m.
In the forest fallows P and K were spatially autocorrelated over shorter distances than in the mature forest. At the one-fallow forest, the range of autocorrelation for P was 3.8 m in one plot and 4.6 m in the other. Spatially structured
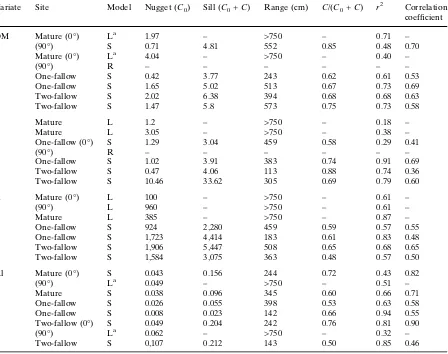
Table 3 Summary of the semivariogram model parameters for OM, P, K, Al from three tropical dry forest stands
Variate Site Model Nugget (C0) Sill (C0+C) Range (cm) C/(C0+C) r2 Correlation coefficient
OM Mature (0) La 1.97 – >750 – 0.71 –
(90) S 0.71 4.81 552 0.85 0.48 0.70
Mature (0) La 4.04 – >750 – 0.40 –
(90) R – – – – – –
One-fallow S 0.42 3.77 243 0.62 0.61 0.53
One-fallow S 1.65 5.02 513 0.67 0.73 0.69
Two-fallow S 2.02 6.38 394 0.68 0.68 0.63
Two-fallow S 1.47 5.8 573 0.75 0.73 0.58
P Mature L 1.2 – >750 – 0.18 –
Mature L 3.05 – >750 – 0.38 –
One-fallow (0) S 1.29 3.04 459 0.58 0.29 0.41
(90) R – – – – – –
One-fallow S 1.02 3.91 383 0.74 0.91 0.69
Two-fallow S 0.47 4.06 113 0.88 0.74 0.36
Two-fallow S 10.46 33.62 305 0.69 0.79 0.60
K Mature (0) L 100 – >750 – 0.61 –
(90) L 960 – >750 – 0.61 –
Mature L 385 – >750 – 0.87 –
One-fallow S 924 2,280 459 0.59 0.57 0.55
One-fallow S 1,723 4,414 183 0.61 0.83 0.48
Two-fallow S 1,906 5,447 508 0.65 0.68 0.65
Two-fallow S 1,584 3,075 363 0.48 0.57 0.50
Al Mature (0) S 0.043 0.156 244 0.72 0.43 0.82
(90) La 0.049 – >750 – 0.51 –
Mature S 0.038 0.096 345 0.60 0.66 0.71
One-fallow S 0.026 0.055 398 0.53 0.63 0.58
One-fallow S 0.008 0.023 142 0.66 0.94 0.55
Two-fallow (0) S 0.049 0.204 242 0.76 0.81 0.90
(90) La
0.062 – >750 – 0.32 –
Two-fallow S 0,107 0.212 143 0.50 0.85 0.46
variance occurred over a shorter distance at the two-fallow site, where P had a range of auto-correlation of 1.1 and 3.1 m (Fig.1). K exhibited a similar pattern: spatial autocorrelation oc-curred over distances of 1.8 and 4.6 m in the
one-fallow stand and over 3.6 and 5.1 m in the two-fallow stand (Fig.2).
In the one-fallow forest, OM was autocorre-lated over distances of up to 2.4 and 5.1 m and up to 3.9 and 5.7 m in the two-fallow forest
semivariance semivariance semivariance
0 200 400 600
01
23
4
5
distance (cm) distance (cm) distance (cm)
0 200 400 600
01
2
3
4
0 200 400 600
40
30
20
10
0
Mature One-fallow Two-fallow
Fig. 1 Semivariograms for P from mature forest and forest fallows with different cultivation histories in a Mexican tropical
dry forest
distance (cm) distance (cm) distance (cm)
semivariance semivariance
semivariance
0 100 200 300 400 500 600
0
2000
4
000
6000
8000
0 200 400 600
0
3000
1000
5000
0 200 400 600
6000
4000
2000
0
Mature One-fallow Two-fallow
Fig. 2 Semivariograms for K from mature forest and forest fallows with different cultivation histories in a Mexican tropical
dry forest
distance (cm) distance (cm) distance (cm)
semivariance semivariance semivariance
0 100 200 300 400
0.0
0.05
0.10
0.15
0.20
0.25
0 100 200 300 400
0.0
0.005
0.015
0.025
0 100 200 300 400
0.0
0.1
0.2
0.3
Mature One-fallow Two-fallow
Fig. 3 Semivariograms for Al from mature forest and forest fallows with different cultivation histories in a Mexican tropical
(Table3). While the scale of autocorrelation for OM, P, and K differs between the mature forest and the forest fallows, among the forest fallows the pattern of spatial dependence does not appear to differ much despite the differences in their cultivation histories. Only Al had a range of autocorrelation similar to that found in the mature forest. In the one-fallow forest, Al was autocorre-lated over distances of 1.4 and 4.0 m, and in the two-fallow forest, over 1.4 and 2.4 m (Fig.3). Vegetation
The vegetation of the three sites differed sub-stantially (Table4). We recorded 17 species in the one-fallow forest, 14 species in the two-fallow forest, and 29 species in the mature forest. Of the 5 most frequent species at each site, only one species,Psidium sartorianum, was common to all three sites. Although there is only one other species (‘Bomopch’, common name) shared by all three sites, all pairwise combinations of the sites share several species. Basal area (>1 cm) was greatest in the mature forest (46.6 m2/ha),
fol-lowed by the two-fallow (19.4 m2/ha) and one-fallow (9.4 m2/ha) sites. Driving the difference in basal area among our three sites is the dearth of trees >5 cm dbh in the one-fallow forest, where we recorded a stem density of only 0.01 stems/m2 between 5 and 10 cm dbh and no stems ‡10 cm
dbh. In contrast, the two-fallow forest had 0.12 stems/m2 between 5 and 10 cm dbh and 0.08
stems/m2between 10 and 20 cm dbh. The mature forest had 0.20 stems/m2 with dbh >20 cm. The one-fallow forest had the highest number of stems <5 cm (Table 4). Including all stems, the density of the one- and two-fallow forests are similar (1.80 vs. 1.48 stems/m2) and approximately twice
that of mature forest (0.75 stems/m2).
The range of autocorrelation for both K and P is lowest in stands with high stem density or low basal area. In our plots, the ranges of these soil nutrients increase with greater basal area; they also increase with lower stem density. In contrast, the range of autocorrelation for OM and Al does not appear related to basal area, small stem density, or total stem density (Table 4).
Discussion
Geostatistics augments the ability of parametric statistics to compare spatial dependence between and within forest stands. On the one hand, parametric statistics indicate that the location of forest stands in El Refugio influences the mag-nitude of nutrient concentrations (Table1). Similarly, comparing CVs between sites reveals that geographic location is a better indicator of variability in each plot than disturbance history
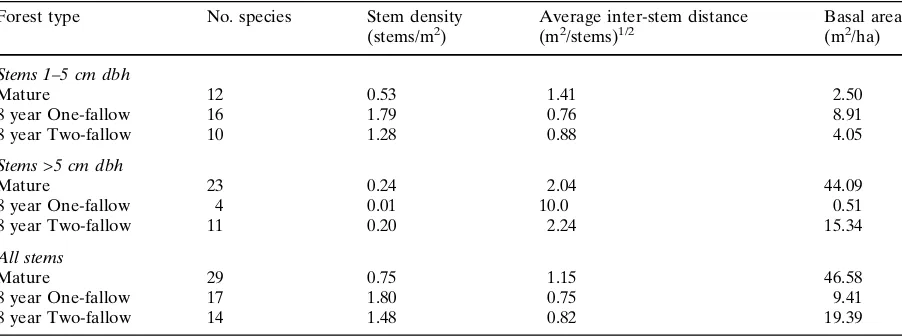
Table 4 Vegetation characteristics of three dry tropical forest stands (mean of two plots per stand, with the exception of
8 year two-fallow for which we have data for only one plot)
Forest type No. species Stem density
(stems/m2) Average inter-stem distance(m2/stems)1/2 Basal area(m2/ha)
Stems 1–5 cm dbh
Mature 12 0.53 1.41 2.50
8 year One-fallow 16 1.79 0.76 8.91
8 year Two-fallow 10 1.28 0.88 4.05
Stems >5 cm dbh
Mature 23 0.24 2.04 44.09
8 year One-fallow 4 0.01 10.0 0.51
8 year Two-fallow 11 0.20 2.24 15.34
All stems
Mature 29 0.75 1.15 46.58
8 year One-fallow 17 1.80 0.75 9.41
8 year Two-fallow 14 1.48 0.82 19.39
(Table2). On the other hand, a geostatistical analysis suggests that cultivation history has a greater effect than geographic proximity on the spatial pattern of nutrients within a stand (Figs.1, 2).
The pattern of soil properties in El Refu-gio—soil resources that are spatially dependent from 0.2 m to more than 7.5 m—is within the range reported for other forests. In a temperate old growth forest, Lechowicz and Bell (1991) found that pH, NO3, and K were all spatially
correlated at distances less than 2 m. In a Nica-raguan wet tropical forest, P was autocorrelated over distances up to 7–11.6 m and K was auto-correlated over distances up to 3.8–10.8 m (Blair 2005). Gonzalez and Zak (1994) found that organic C, N transformations, and available P were all spatially dependent at £24 m in a secondary tropical dry forest. They concluded that much of the spatial variation in this system was fine-scale and likely to be driven by individ-ual trees. The nugget variance in their study was quite high (55%–74% of the sample variance), indicating that a large portion of the sample variance occurs at scale smaller than their short-est lag distance (4 m) (Schlesinger et al. 1996). Results from our study, done with much shorter lag intervals (0.2–0.5 m), also indicate fine-scale spatial patterning in secondary dry tropical for-ests. For instance, 58%–88% of the total variation in P was spatially dependent from 0.2 to 4.6 m.
In the three forest stands we studied, cultivation history did not appear to affect the degree of spatial dependence in soil properties (Table3). However, the process of shifting cultivation reduced the scale of variability of both P and K (Figs. 1and2). For example, P had a range greater than‡7.5 m in the mature forest compared to a range of 1.1–3.1 m in the one-fallow forest, and 3.8–4.6 m in the two-fallow forest. Shorter ranges of autocorrelation for both P and K in the forest fallows are likely due to the smaller tree canopies in these stands. Vegeta-tive cover influences the spatial distribution of soil nutrients, through litter deposition and decompo-sition, stemflow, and throughfall (Lechowicz and Bell1991; Døckersmith et al. 1999). In addition, plants affect soil nutrients through the decompo-sition of root litter, the release of root exudates, and root turnover (Vitousek and Sanford 1986;
Døckersmith et al. 1999; Blair 2005), although these belowground processes are not addressed specifically by this research.
While OM did not exhibit a consistent pattern of spatial dependence over the scale of analysis in the mature forest, the variability in OM was described well by spherical models at both sec-ondary forest sites (Table3). Following slash-and-burn clearing, the spacing of mature forest trees would influence the location of aboveground inputs from woody debris and belowground inputs from decomposing roots. In milpas and young forest fallows woody debris plays an important role, making up 88% of total aboveground bio-mass in milpas and 30% of total aboveground biomass in 6–11 year old forest fallows (Eaton and Lawrence 2006). These localized organic inputs from both above- and belowground sources may contribute to spatial patterning in soil organic matter after trees have been cut and burned in preparation for cultivation (Døckersmith et al. 1999). The role of vegetation (and surficial pro-cesses in the soil) in creating spatial patterns are probably especially relevant to this study because we sampled only the top 5 cm of soil, a depth likely to reflect changes in aboveground inputs to the soil (Jobba´gy and Jackson2001).
We expected to compare the one-fallow and two-fallow stands to see what if any changes there were to the scale of spatial dependence after a second cultivation-fallow cycle. However the differences in the structure of vegetation between the 8-year old one-fallow and 8-year old two-fallow stand make it difficult to analyze the effect of repeated cultivation on spatial patterns (Ta-ble4). Despite the structural differences between these stands, the basal areas calculated at the two sites—9.4 m2/ha for one-fallow forest and
19.4 m2/ha for the two-fallow—correspond well to the range (5.9–34.3 m2/ha) for secondary for-ests recorded in a study of biomass recovery in the SYPR that used 500 m2plots to characterize forest structure (Read and Lawrence2003).
field in southwest Michigan, found that although the magnitude of spatial dependence remained relatively constant for all soil properties, the scale of autocorrelation was quite different: the range of most soil properties was greater by a factor of 3 or more in the cultivated field, a pattern they attribute to repeated tillage, which is a ‘‘smearing out’’ process. Similarly disturbance influenced the scale, but not the degree, of spatial patterning at our study site. Because farmers in El Refugio use dibble sticks to plant, the changes in the range of autocorrelation that we observed are more likely the result of changes in vegetation than of physical disturbances associated with cultivation. Fire may also affect the spatial patterns of soil nutrients. In a tropical wet forest, burning was found to reduce the patch size of P, N, K, and C (Blair 2005). Blair (2005) attributes soil spatial patterns in the unburned plots to the above- and belowground effects of plants on soil and those in burned plots to changes in the plant community as well as to the effects of fire. Our results indicate that after slash-and-burn clearing, 2– 3 years of cultivation, and 8 years of fallow the spatial pattern of biologically cycled soil proper-ties is markedly different from that of the mature forest (Figs.1,2). Moreover at these sites, where a new cultivation-fallow cycle begins every 3– 15 years (Eaton and Lawrence2006), it is unlikely that the coarser pattern found in the mature forest will be restored as long as shifting cultiva-tion persists in these locacultiva-tions. Further study of currently cultivated fields and forest fallows of different ages is needed to determine the relative influence of plant above- and belowground impacts, cultivation, and burning on the spatial heterogeneity of soil properties in forest fallows. At our study site Al, which is not required by plants and is potentially toxic (Aber and Melillo 2001), had the most consistent range of autocor-relation (ca. 2.5 m) of the soil constituents we considered, suggesting that its spatial distribution was not altered by forest clearing and burning, the growth of secondary vegetation, or transport processes (Fig.3). That Al showed a similar range of autocorrelation in all three forest stands, while P, K, and OM, differed among stands, supports the hypothesis that fallow vegetation plays a role in restructuring the spatial pattern of
essential factors of soil fertility. However, if physical processes completely controlled the movement of Al we would expect to see either a random distribution or a distribution markedly different from those soil properties strongly influenced by biotic processes (e.g. Schlesinger et al. 1996, Holmes et al. 2005). In this case, Al may be passively cycled by trees (e.g. Markewitz and Richter 1998) and heavily influenced by geochemical process in the soil. Additionally, the low mobility of Al oxides in hot and humid climates (Brady and Weil 1999) may explain the persistence of its spatial distribution through two cycles of disturbance and recovery.
Several other studies have also concluded that biologically essential elements respond differently to changes in the plant community than nones-sential elements because of the different processes (biological vs. geochemical) controlling their movement (Schelsinger et al. 1996; Gallardo 2003). Poor correspondence between the range of autocorrelation of soil texture and that of P, C, and N, in a Caribbean dry tropical forests led Gonzalez and Zak (1994) to conclude that plant community structure rather than physical soil processes are driving the spatial patterning of essential nutrients in that system. Schlesinger et al. (1996) attributed the concentration of the most limiting nutrients (N, P, and K) beneath desert shrubs to the concentration of biotic pro-cesses and biogeochemical cycling beneath shrub canopies. In the dry tropical forest stands of El Refugio, where canopy cover is less discontinuous than in a shrubland, it is likely that individual trees affect the spatial pattern of soil nutrients (Døcker-smith et al. 1999), but that the extent of canopy cover, mean canopy size, and the distribution and density of tree stems probably also influence the way in which trees contribute to spatial patterns.
community more clearly than non-essential ele-ments. While our first hypothesis assumes that plant size is the most important determinant of the scale of soil nutrient variability, implicit in our second hypothesis is the idea that nutrient cycling processes are also an important factor. After considering our results, we have realized that the explanatory power of differences in nutrient cycling is not limited to explaining the differences between biologically and geochemically cycled nutrients. For instance, to interpret within stand differences in the range of P and K we suggest that it is important to consider differences in how and at what rate these nutrients are cycled in addition to canopy size and stem density. Because K is rapidly leached from leaf surfaces, through-fall and stemflow as well as litterthrough-fall are important components of K cycling (Schlesinger 1997; Campo et al. 2000), and are likely to contribute to spatial patterning. Phosphorus is not so readily leached from plant surfaces, so litterfall is likely to dominate the signature of tree effects on spatial patterns in the soil (Campo et al. 2001). Additionally we expect that the range of auto-correlation for soil nutrients with faster turnover times will be more closely coupled to canopy size than those that move through the soil reservoir more slowly. That is to say, the longer leaf litter remains at the surface, the more that diffusional (bioturbation, capillary flow, or molecular
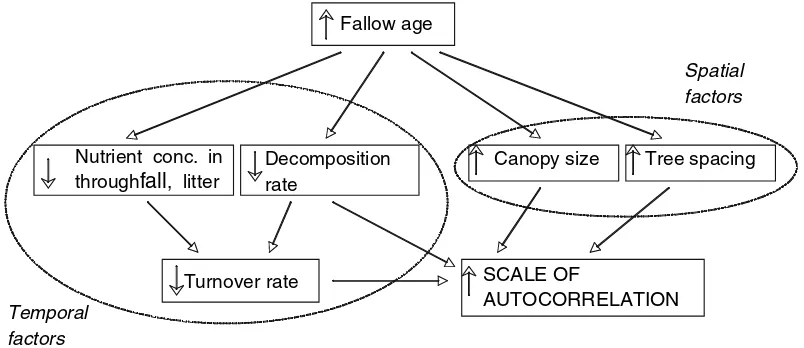
diffu-sion in porewater) or advective (sheetflow or near-surface ground water flow) processes will modify the spatial signal of the tree canopy, impacting the range. These hypotheses, however, remain to be tested (Fig.4).
Given the observed changes to the scale of spatial dependence for P, K, and OM, but not Al, following shifting cultivation, we conclude that the spatial patterns of biologically important soil properties are altered by the slash-and-burn clearing, cultivation, and forest regrowth that comprise shifting cultivation. It is likely that the more fine-scaled pattern of P and K following shifting cultivation is related to changes in vege-tative cover, like smaller tree size, reduced basal area, and increased stem density in the forest fallows relative to the mature forest. In addition, we propose that the rate and pathways of nutrient cycling impact the strength and scale of a tree’s spatial signal. In forest fallows, OM, P, K, and Al exhibit spatial dependence over a distance of 0.2– 5.7 m, a scale that may affect individual growth, and plant population or community structure (Robertson et al. 1993; Dockersmith et al.1999). Although it is unknown how small-scale environ-mental heterogeneity affects ecosystem-level pro-cesses, studies have shown that resource variability can affect belowground biomass, plant size, competition and mortality in plant popula-tions, and species composition (Day et al. 2003;
Fallow age
Decomposition rate
Canopy size Tree spacing
Turnover rate SCALE OF
AUTOCORRELATION Temporal
factors
Spatial factors
Nutrient conc. in through
fall
, litterFig. 4 Hypothesized impact of temporal and spatial factors
on the scale of autocorrelation in the top 5 cm of soil in a dry tropical forest. The symbols ‘‘›’’ and ‘‘fl’’ indicate the direction
of change. For instance, lower concentrations of a nutrient in
Blair and Perfecto 2004; Wijesinghe et al. 2005). These findings suggest that spatial variability in soil resources has the potential to modify com-petitive interactions within plant communities (Blair2005). Significantly, the smaller patch sizes we observed in 8-year old forest fallows are likely to be maintained as long as a stand is being actively used for shifting cultivation because local farmers tend to clear forest fallows again after 3– 15 years of regrowth.
Acknowledgements We would like to thank the farmers of
El Refugio for use of their land and their assistance in the field; Howie Epstein for his comments on an earlier draft of this paper; colleagues at ECOSUR for their logistical support; and the California Rangeland and the California Archaeology Laboratories for use of their computing facilities. For their assistance collecting and processing samples we thank Lee Panich and Cristin O’Connor. This paper has also benefited from the comments of two anonymous reviewers. This research is a product of the Southern Yucata´n Peninsular Region (SYPR) project involving Clark University, University of Virginia, El Colegio de la Frontera Sur, and Harvard University. Its principal sponsors have been NASA-LCLUC (Land Cover and Land Use Change) program (6046 and NAG5-11134), Center for Integrated Studies of the Human Dimensions of Global Environmental Change, Carnegie Mellon University (NSF SBR 95-21914), and NSF-Biocomplexity (BCS-0410016). This research was also supported by a Terrence Daniels Family Jefferson Graduate Fellowship from the University of Virginia.
Appendix
Appendix 1. Lag interval, minimum and maxi-mum number of pairs, and lag distance at which they occur for each variogram
Site Lag
One-fallow 45 19 16 197 630
Site Lag
One-fallow 30 56 30 111 600
Two-fallow 26 46 27 99 493
Two-fallow 34 10 12 151 645
Phosphorus
Mature 50 37 49 92 650
Mature 30 44 60 112 689
One-fallow
(0) 40 11 15 77 519
(90) 40 23 159 58 720
One-fallow 35 7 14 157 699
Two-fallow 22 35 23 82 440
Two-fallow 25 40 27 91 675
Potassium
Mature (0) 32 18 576 34 32
(90) 32 11 575 26 93
Mature 28 43 56 94 531
One-fallow 40 18 15 172 681
One-fallow 50 24 19 220 699
Two-fallow 40 12 14 169 720
Two-fallow 25 9 12 138 649
Aluminum
Mature (0) 20 12 381 21 119
(90) 25 12 398 28 123
Mature 40 22 15 127 400
One-fallow 50 20 16 216 700
One-fallow 35 7 14 157 699
Two-fallow
(0) 45 10 17 46 89
(90) 45 11 16 49 90
Two-fallow 38 7 11 131 646
np = number of pairs
References
Aber JD, Melillo JM (2001) Terrestrial ecosystems. Hardcourt Academic Press, New York
Blair BC (2005) Fire effects on the spatial patterns of soil resources in a Nicaraguan wet tropical forest. J Trop Ecol 21:435–444
Blair BC, Perfecto I (2004) Successional status and root foraging for phosphorus in seven tropical tree species. Can J For Res 34:1128–1135
Boettcher SE, Kalisz PJ (1990) Single-tree influence on soil properties in the mountains of eastern Kentucky. Ecology 71:1365–1372
Brown S, Lugo AE (1990) Tropical secondary forests. J Trop Ecol 6:1–32
Campo J, Maass JM, Jaramillo VJ, Yrı´zar AM (2000) Calcium, potassium, and magnesium cycling in a Mexican tropical dry forest ecosystem. Biogeochem-istry 49:21–36
Campo J, Maass JM, Jaramillo VJ, Yrı´zar AM, Sarukha´n J (2001) Phosphorus cycling in a Mexican tropical dry forest ecosystem. Biogeochemistry 53:161–179 Day KJ, Hutchings MJ, John EA (2003) The effects of
spatial pattern of nutrient supply on yield, structure and mortality in plant populations. J Ecol 91:541–553 De Vos B, Vandecasteele B, Deckers J, Muys B (2005) Capability of loss-on-ignition as a predictor of total organic carbon in non-calcareous forest soils. Com-mun Soil Sci Plant Anal 36:2899–2921
Døckersmith IC, Giardina CP, Sanford RL Jr (1999) Persistence of tree related patterns in soil nutrients following slash-and-burn disturbances in the tropics. Plant Soil 209:137–156
Eaton JM, Lawrence D (2006) Woody debris stocks and fluxes during succession in a dry tropical forest. Forest Ecol Manage232:46–55
Fernandes DN, Sanford RL Jr (1995) Effects of recent land-use practices on soil nutrients and succession under tropical wet forest in Costa Rica. Conserv Biol 9:915–922
Frogbrook ZL, Oliver MA (2001) Comparing the spatial predictions of soil organic matter determined by two laboratory methods. Soil Use Manage 17:235–244 Gallardo A (2003) Spatial variability of soil properties in a
floodplain forest in northwest Spain. Ecosystems 6:564–576
Gonzalez OJ, Zak DR (1994) Geostatistical analysis of soil properties in a secondary tropical dry forest, St. Lucia, West Indies. Plant Soil 163:45–54
Gross KL, Pregitzer KS, Burton AJ (1995) Spatial varia-tion in nitrogen availability in three successional plant communities. J Ecol 83:357–367
Holmes KW, Kyriakidis PC, Chadwick OA, Soares JV, Roberts DA (2005) Multi-scale variability in tropical soil nutrients following land-cover change. Biogeo-chemistry 74:173–203
Huante P, Rincon E, Chapin FS III (1995) Responses to phosphorus of contrasting successional tree-seedling species from the tropical forest of Mexico. Funct Ecol 9:760–766
Jenny H (1941) Factors of soil formation. McGraw-Hill, New York
Jobba´gy EG, Jackson RB (2001) The distribution of soil nutrients with depth: global patterns and the imprint of plants. Biogeochemistry 53:51–77
Kaluzny SP, Vega SC, Cardoso TP, Shelly AA (1998) S+ Spatial Stats user’s manual for Windows and Unix. Springer, New York
Keys E (2005) Market intermediaries link farms to mar-kets: southeastern Mexican examples. Geogr Rev 95:24–46
Klepeis PJ (2004) Forest extraction to theme parks: the modern history of land change. In: Turner BL II, Geoghegan J, Foster DR (eds) Integrated
land-change science and tropical deforestation in the Southern Yucatan: final frontiers. Oxford University Press, Oxford
Lawrence D, Suma V, Mogea JP (2005) Change in species composition with repeated shifting cultivation: limited role of soil nutrients. Ecol Appl 15:1952–1967 Lawrence D (2003) The response of tropical tree seedlings
to nutrient supply: meta-analysis for understanding a changing tropical landscape. J Trop Ecol 19:1–12 Lawrence D, Foster DR (2002) Changes in forest biomass,
litter dynamics and soils following shifting cultivation in southern Mexico: an overview. Interciencia 27:400– 408
Lechowicz MJ, Bell G (1991) The ecology and genetics of fitness in forest plants. II. Microspatial heterogeneity of the edaphic environment. J Ecol 79:687–696 Markewitz D, Richter DD (1998) The bio in aluminum
and silicon geochemistry. Biogeochemistry 42:235–252 Nye PH, Greenland DJ (1960) The soil under shifting cultivation. Technical Communication Number 51, Commonwealth Bureau of Soils, Harpenden, UK Ping JL, Dobermann A (2006) Variation in the precision
of soil organic carbon maps due to different labora-tory and spatial prediction methods. Soil Sci 171:374– 387
Read L, Lawrence D (2003) Recovery of biomass follow-ing shiftfollow-ing cultivation in dry tropical forests of the Yucatan. Ecol Appl 13:85–97
Robertson GP, Gross KL (1994) Assessing the heteroge-neity of belowground resources: quantifying pattern and scale. In: Caldwell MM, Pearcy RW (eds) Exploitation of environmental heterogeneity by plants. Academic Press, New York
Robertson GP, Crum JR, Ellis BG (1993) The spatial variability of soil resources following long-term dis-turbance. Oecologia 96:451–456
Rossi RE, Mulla DJ, Journel AG, Franz EH (1992) Geostatistical tools for modeling and interpreting ecological spatial dependence. Ecol Monogr 62:277– 314
Schlesinger WH (1997) Biogeochemistry: an analysis of global change. Academic Press, San Diego
Schlesinger WH, Raikes JA, Hartley AE, Cross AF (1996) On the spatial pattern of soil nutrients in desert eco-systems. Ecology 77:364–374
Stark JM (1994) Causes of soil nutrient heterogeneity at different scales. In: Caldwell MM, Pearcy RW (eds) Exploitation of environmental heterogeneity by plants. Academic Press, New York
Turner BL II (1974) Prehistoric intensive agriculture in the Mayan lowlands. Science 185:118–124
Turner BL II, Villar SC, Foster D, Geoghegan J, Keys E, Klepeis P, Lawrence D, Mendoza PM, Manson S, Ogneva-Himmelberger Y, Plotkin AB, Schnei-der L, Schmook B, Vance C (2001) Deforestation in the southern Yucatan peninsular region: an integrative approach. Forest Ecol Manage154:353– 370
Vester HFM, Lawrence D, Eastman JR, Turner BL II, Calme´ S, Dickson R, Pozo C, Sangermano F (2007) Land change in the Southern Yucata´n and Calakmul biosphere reserve: implications for habitat and biodi-versity. Ecol Appl (in press)
Wijesinghe DK, John EA, Hutchings MJ (2005) Does pattern of soil resource heterogeneity determine plant
community structure? An experimental investigation. J Ecol 93:99–112
Vitousek PM, Sanford RL Jr (1986) Nutrient cycling in moist tropical forest. Ann Rev Ecol Syst 17:137–167 Webster R (1985) Quantitative spatial analysis of soil in