DOI: 10.12928/TELKOMNIKA.v12i3.81 605
Combine Target Extraction and Enhancement Methods
to Fuse Infrared and LLL Images
Yong Chen*1, Jie Xiong1, Huan-lin Liu2, Qiang Fan1 1
Key Laboratory of Industrial Internet of Things& Network Control, MOE, Chongqing University of Posts and Telecommunications, Chongqing, China, 400065
2
Key Laboratory of Optical Fiber Communication Technology, Chongqing, China, 400065 *Corresponding author, e-mail: [email protected]
Abstract
For getting the useful object information from infrared image and mining more detail of low light level (LLL) image, we propose a new fusion method based on segmentation and enhancement methods in the paper. First, using 2D maximum entropy method to segment the original infrared image for extracting infrared target, enhancing original LLL image by Zadeh transform for mining more detail information, on the basis of the segmented map to fuse the enhanced LLL image and original infrared image. Then, original infrared image, the enhanced LLL image and the first fused image are used to realize fusion in non-subsampled contourlet transform (NSCT) domain, we get the second fused image. By contrast of experiments, the fused image of the second fused method’s visual effect is better than other methods’ from the literature. Finally, Objective evaluation is used to evaluate the fused images’ quality, its results also show that the proposed method can pop target information, improve fused image’s resolution and contrast.
Keywords: 2D maximum entropy, Zadeh transform, enhancement, the second fused, NSC
1. Introduction
Image fusion namely uses redundant data and complementary information from multi-sensors for obtaining a image which has accurate target, owns good visual effects [1]. As an important branch of image fusion, infrared and low light level (LLL) images fusion’s main task is to achieve the reasonable and comprehensive description of target and scene, on the condition to retain the original data information as much as possible and avoid false information. At present, the technology has been widely used in intelligent transportation, safety monitoring, human visual auxiliary fields and so on [2]-[3].
fused images fast and the fused images had clear detail, but its target couldn’t show obviously. Xing Suxia et al proposed a target extraction method [15] which based on Renyi entropy to segment the infrared image for extracting thermal targets, and enhance the LLL image’s detail in NSCT domain. The fused image had a high brightness, so lost its detail information at the same time.
All those methods above can achieve complementary and redundancy between different images’ information, contrast or resolution has been improved to a certain extent, but contrast and definition can’t compatible. In order to enhance the contrast and improve the resolution of the fused image, the paper presents a new method which segments the original infrared image and enhance LLL image, then to fuse the segmented image and the enhanced image, the fused image is called the first fused image. Aiming to prevent the incomplete image segmentation and over enhancement LLL image effectively, the paper uses the first fused image and the original infrared and the enhanced LLL image to fuse for more original image information, the fused image is called the second fused image.
The rest of the paper is organized as follows: In Section 2, it mains introduce pretreatment, infrared image segmentation and LLL image enhancement method are described. In Section 3, fusion strategy is discussed. In Section 4, experiments results and analysis are put. Finally, in Section 5, conclusions of the work are made.
2 Pretreatment
How to reserve important information of the scene better has been the main direction of our research. For this purpose, the paper uses the segmentation method on infrared image to extract the major target information, in addition, also apply a certain enhancement method to excavate more details deeply. Based on the analysis above, we put forward an idea of fusion treatment to fuse infrared and LLL images. We discuss the detail as follows.
2.1 2D maximum entropy
Thermal target information is important information for the infrared image, we uses the 2D maximum entropy threshold [16] to segment the infrared image, for extracting target information to better popping the infrared target.
Due to probability distribution of the segmented infrared image’s target region and background region are different, so we proposes posterior probability of the gray and mean of gray region to normalize each region’s occur probabilitypij. Suppose the segmentation value of the image is s t, , background region’s probability and target region’s probability are pBandpO, respectively.
,B i j p
p i j(1) where,i1, 2, ...,s, j1, 2, ...,t
,O i j
p
p i j (2)where, i s 1,s2, ...,L1, j t 1,t2, ...,L1. The discrete 2D entropy is defined as:
lg ij ij i j
H
p p (3)The 2D entropy of objective region:
ij lg ij lg OO
i j O O O
p p H
H O p
p p P
The 2D entropy of background region:
ij lg ij lg BB
i j B B B
p p H
H B p
p p P
(5)Where, i s 1,s2, ...,L1, j t 1,t2, ...,L1.
1
B O
p p (6)
1
B O
H H (7)
The discriminant function of image entropy is defined as:
, lg lg 1
lg 1
O O
O O
O O
O O
O O
O O
H H H
f s t H O H B p p
P p p
H H H
p p
P p p
(8)
Then, the optimal threshold vector
* *
,
s t must satisfy the following condition:
* *
1
, arg s Lmax ,
s t f s t (9)
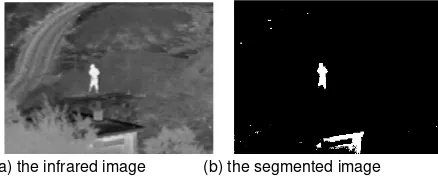
Shown in Figure 1, demonstrated the segmentation effect, Figure 1(b) shows the whole and complete person target and some hot regions.
(a) the infrared image (b) the segmented image
Figure 1. The chart of segmentation effection
2.2 Zadeh transform
A LLL Image contains more detail information, its scene is dark and contrast is unobvious. In order to mine more details information for the fused image, we uses the enhancement method to intensify the LLL image.
The traditional methods including histogram equalization, gray stretching and so on, these methods can not process dynamic effect well and enhance the image noise more, we introduce the Zadeh transform theory and principle for image information mined method presented from our lab in literature [17] to intensify the original LLL image.
The concrete description is as follows:
,
,
T x y k O x y (10) where, T x y, and O x y, represent the locationx y, of the target and original image, respectively.
0, 255
and 1, 255 denote the starting point and goal of converting the gray level image, respectively. k1, 255 represents the coefficient of the space expansion. When k is greater than the limit of human vision contrast resolution, Eq.(10) shows the performance of the underlying image mining functions; when k is less than the limit of human vision contrast resolution, Eq.(10) achieves the image hidden features. 1, Eq.(10) is to achieve image binarization function. and are mining parameters.
After Zadeh transform, Eq.(11) may occur T x y , 255 or T x y , 0 which beyond the domain, this will cause confusion. Therefore, this need sets some constraints, namely, while the gray value is over 255, the value is set to 255; while the gray value is low 0, the value is set to 0.
255 , , 255
,
0 , , 0
T x y T x y
T x y
(11)
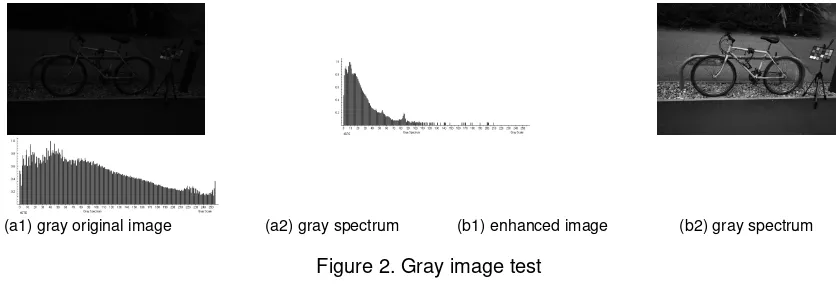
We illustrate the important of the enhancement method as follows, one pair for displaying the gray image, shown as Figure 2, Figure 2(a1) is the original gray image, Figure 2(a2) is the gray spectrum of Figure 2(a1), Figure 2(b1) is the corresponding enhanced image, Figure 2(b2) is the gray spectrum of Figure 2(b1). We set the initial parameters 0and50. In Figure 2(a1), although we hardly see anything in it, when used zadeh transform to intensify the image, its enhanced effect shown as Figure 2(b1). Contrast the gray spectrum of Figure 2(a2) and Figure 2(b2), the initial spectrum in Figure 2(a1) had been expanded a lot. Through this example to demonstrate the enhancement method, we can realize that it is necessary to intensify the original LLL image.
(a1) gray original image (a2) gray spectrum (b1) enhanced image (b2) gray spectrum
Figure 2. Gray image test
3 Fusion strategy
First, to segment the original infrared image and intensify the original LLL image, based on the segmented binary image to guide its fusion, its concrete method as follows. The target regions’ pixels are constitutes by taking the pixels from the corresponding location in the original infrared image. The other regions are picking pixels from corresponding to the binary image’s non-target area of the location in the enhanced LLL image, we obtains the first fused image F1.
Then, original infrared image(IR), the enhanced image(LE) and the first fused image F1 are used to NSCT transform respectively, get the corresponding low frequency sub-band coefficientsCIRx y, ,CLEx y, ,CF1x y, ; different scale and directional high frequency sub-band
coefficients , ,
IR
j l
C x y , , ,
LE
j l
C x y and 1
, ,
F
j l
2 , , , 1 , 3
F IR LE F
C x y C x y C x y C x y (12) Using the absolute value of the high frequency sub-band NSCT coefficients take greatest shown as Eq.(13):
2 1
, , max , , , , , , , ,
F IR LE F
j l j l j l j l
C x y C x y C x y C x y (13) After a series process above, we get fused image (F2)’s NSCT coefficients {CF2x y, ,
2 , ,
F j l
C x y }, finally, the NSCT inverse transform, we get the fused image F2.
4 Experiment results and analysis
The experiments based on the MATLAB platform, infrared and LLL image of the two groups from Holland TNO institute’s picture library have been registration completely. Figures 3(a)-(b) as the first group shown, Figure 3(a) can identify a person clearly, Figure 3(b) can see road, slope, shrub and fence and other scenery, but its contrast feels not well; shown in Figures 4(a)-(b) as the second group, Figure 4(a) can identify persons, ship and other small targets, Figure 4(b) can see the ship, the sky clearly.
4.1 The experimental results and subjective evaluation
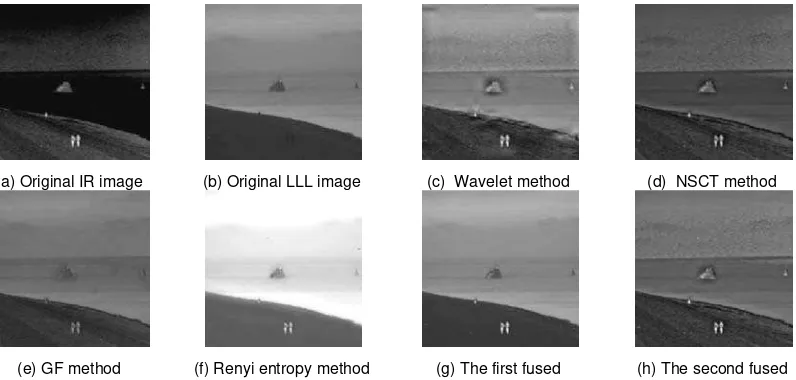
For the purpose of comfirming the correctness and effectiveness of the proposed algorithm, we uses the other four methods compared with the first fused image and the second fused image to test. Figures 3(c) and Figures 4(c) are fused based on the bior97 wavelet transform method, the source code is publically available (http://www.metpix.de/toolbox.htm). Figures 3(d) and Figures 4(d) are the fused images which are fused by the NSCT method. Figures 3(c)-(d), Figures 4(c)-(d) both choose the fusion rules by averaging the low frequency coefficients and getting the maximum absolute values of high frequency coefficients, their decomposition level all are 4 layers, called wavelet method and NSCT method, respectively; Figure 3(e) and Figure 4(e) are fused by the method in literature [15], its source code is publically available (http://www.xudongkang.weekly.com) called as GF; Figure 3(f) and Figure 4(f) are fused by the method in literature [15], called as Renyi entropy method; Figure 3(g) and Figure 4(g) and are the fused images by the methods which fuses the segmented infrared image and the enhanced image, as the first fused image; based on the first fused image, we fuse the first fused image and the original infrared image and enhanced LLL image with the second fused method, its visual effect shown as Figure 3(h) and Figure 4(h). Four decomposition levels with 2,8,8,16 directions from coarse scale to finer scale are adopted by the methods which uses the NSCT method.
(a) Original IR image (b) Original LLL image (c) Wavelet method (d) NSCT method
(e) GF method (f) Renyi entropy method (g) The first fused (h) The second fused
Figure 3. The first group experiments of infrared and LLL image fusion
(a) Original IR image (b) Original LLL image (c) Wavelet method (d) NSCT method
(e) GF method (f) Renyi entropy method (g) The first fused (h) The second fused
Figure 4. The second group experiments of infrared and LLL image fusion
4.3 Objective evaluation
In order to further assess the fusion performance of different methods objectively. Three fusion quality metrics are applied, i.e., average gradient (AG) [18], spatial frequency (SF) [19], the edge retention metrics ( AB F
Q ) [13] are adopted in the paper. All the evaluation metrics used
in the paper are defined as follows:
1) Average gradient(AG)
Improvement of an image’s quality can be expressed by the average gradient,which reflects the clarity of the image, reflecting the small details contrast in the image and texture variation, the greater the average gradient, the image has better integration, defined as follows:
2
2 1 2 1 11
, ,
M N
i j
G xf x y yf x y
M N
2) Spatial frequency(SF)
Row frequency of an image is defined as follows:
1 1 2 0 0 1, , 1
M N
i j
RF f i j f i j
M N
(15)Colum frequency of an image is defined as follows:
1 1 2 0 0 1 , 1, M N i jCF f i j f i j
M N
(16) where, M and N denote the number of rows and columns in the image. The spatial frequency of the image is defined as follows:2 2
SF RF CF (17) Spatial frequency reflects the overall level activity of an image in the spatial domain. The greater the value, the visual effection is better.
3) AB F
Q The gradient based index Q evaluates the effective keep edge information which
transferred from the source images to the fused image. It is calculated as follows:
1 1 1 1 , , , , , , M NAF A BF B
i j
AB F M N
A B
i j
Q i j i j Q i j i j
Q
i j i j
(18)where AF AF AF
g O
Q Q Q . AF g
Q and AF O
Q are defined as edge strength and orientation preservation values
at location i j, , respectively. N and M are as the width and height of the images. BF
Q is similar
to AF
Q . A ,
i j
and B ,
i j
reflect the importance of AF ,
Q i j and BF ,
Q i j , respectively.
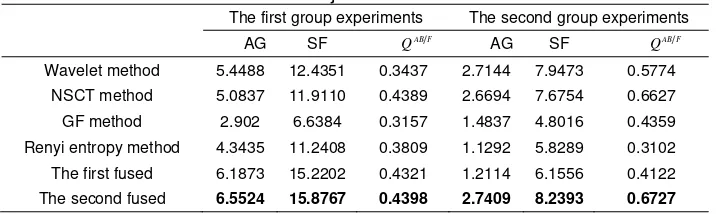
Tabel 1 shows that the proposed method has the greatest average gradient value, the greatest spatial frequency value and the greatest edge retention value, it shows that the proposed method has the best visual effect, this consistent with the subjective evaluation results.
Tabel 1. Objective evaluation
The first group experiments The second group experiments
AG SF AB F
Q AG SF AB F
Q
Wavelet method 5.4488 12.4351 0.3437 2.7144 7.9473 0.5774
NSCT method 5.0837 11.9110 0.4389 2.6694 7.6754 0.6627
GF method 2.902 6.6384 0.3157 1.4837 4.8016 0.4359
Renyi entropy method 4.3435 11.2408 0.3809 1.1292 5.8289 0.3102
The first fused 6.1873 15.2202 0.4321 1.2114 6.1556 0.4122
The second fused 6.5524 15.8767 0.4398 2.7409 8.2393 0.6727
5 Conclusions
incomplete and layering due to the incomplete segmentation or over enhancement in the first fused image, the paper uses the second fused method to fuse the original infrared image , enhanced LLL image and the first fused image in NSCT domain, so the fused image can better keep the main target information of the infrared image and mine more detail from LLL image, and also has a better visual effect. The experimental results show that the proposed second fused image can improve the resolution and contrast of the image and identify targets better compared with other methods.
Acknowledgement
Authors would like to thank the Chongqing Education Committee Science of China for supporting the Foundation of program, No. KJ130529,andKJ1400434.
References
[1] Pan Y., Zheng Y., Sun Hua., et al. An image fusion based on principal component analysis and total
variation model. Journal of Computer-Aided Design & Computer Graphics. 2011; 23(7): 1200-1210.
[2] Saeedi J., Faez K.. Infrared and visible image fusion using fuzzy logic and population-based
optimization. Applied Soft Computing. 2012; 12: 1041-1054.
[3] Brandon M., Ismail B., Max W., et al. Spine image fusion via graph cuts. IEEE Transaction on
Biomedical Engineering. 2013; 60(7): 1841-1850.
[4] A. Toet. Image fusion by a ratio of low-pass pyramid. Pattern Recognition Letters. 1993; 9: 245-253.
[5] Jeese S., Michael A. Laplacian based image fusion. Applied Imagery Pattern Recognition Workshop
(AIPR), IEEE 39th. 2010; 23(7): 1-7.
[6] Yuelin Z., Xiaoqiang L., Tongming W, et al. Visible and infrared image fusion using the lifting wavelet.
TELKOMNIKA Indonesian Journal of Electrical Engineering. 2013; 11(11): 6290-6295.
[7] Zheng J.,Gong J., Research on application of wavelet transform in image fusion. Journal of
Chongqing University of Posts and Telecommunications. 2008; 20(5): 511-567.
[8] Liu K., Guo L., Chen J. Contourlet transform for image fusion using cycle spinning. Journal of
Systems Engineering and Electronics. 2011, 22(2): 353-357.
[9] Yang Y., Zhu M., He B, et al. Fusion algorithm based on improved projected gradient NMF and
NSCT. Optics and Precision Engineering. 2011, 19(5): 1143-1150.
[10] W. Kong, Y. Lei, X. Ni. Fusion technique for gray-scale light and infrared images based on
non-subsampled contourlet transform and intensify-hue-saturation transform. Signal Processing, IET.
2013; 5(1): 75-80.
[11] Jianhua L., Jianguo Y. Multifocus image fusion by SML in the shearlet subbands. TELKOMNIKA
Indonesian Journal of Electrical Engineering. 2014; 12(1): 618-626.
[12] Meng D., Li W., Bangfeng W. Research on fusion method for infrared and visible images via
compressive sensing. Infrared Physics&Technology. 2013; 57: 56-67.
[13] Shutao L., Xudong K., Jianwen H. Image fusion with guided filter. Transaction on Image Processing.
2013; 22(7): 2864-2875.
[14] Qiao X., Han L., Wang B. A fast fusion algorithm of visible and infrared images. Journal of
Design&Computer Graphics. 2011; 23(7): 1211-1216.
[15] Xing S., Xiao H., Chen T., et al. Study of image fusion technology based on object extraction and
NSCT. Journal of Optoeletronics·Laser. 2013; 24(3): 583-588.
[16] Lianfa B., Yingbin L., Jiang Y., et al. Night vision image fusion for target detection with improved 2D
maximum entropy segmentation. International Symposium on Photoelectronic Detection and Imaging 2013: Low-Light-Level Technology and Applications. 2013; 8912: 89120x-1-89120x-8.
[17] Chen Y., Ai A., Wang J., et al. Automatic parameter optimization for lower layer image mining
technique. Journal of Optoelectronics·Laser. 2009; 20(7): 950-953.
[18] Weiwei K., Jianping L. Technique for image fusion based on nonsubsampled shearlet transform and
improved pulse-coupled neural network. Optical Engineering. 2013; 52(1): 17001-1-017001-12.
[19] Lu Y., Guo L., Li H. Remote sensing image fusion edge information and features of SAR image