UNIVERSITY OF SOUTHAMPTON
FACULTY OF SOCIAL AND HU'.\IA:'-J SCIEXCES School of セi。エィ・ュ。エゥ」ウ@
Mathematical Modelling of Lithium Ion Batteries
by
Rahifa Ranom
Thesis for the Jegree of Doctor of Philosophy
UNIVERSITY OF SOUTHAMPTON
ABSTRACT
FACULTY OF SOCIAL AND HUl\IAN SCIENCES School of Mathematics
Doctor of Philosophy
MATHEl\fATICAL l\IODELLING OF LITHIU1'1 ION BATTERIES by Rahifa Ranom
Contents
DECLARATION OF AUTHORSHIP List of Publications
Acknowledgements 1 Introduction
1.1 Lithium batteries as energy storage solution
1.2 Battery materials for Lithium ion batteries . . . 1.2.1 Desirable electrode and electrolyte properties 1.2.2
1.2.3 1.2.4
The cathode material The anode material The electrolyte . 1.3 Charge-transfer reaction 1.4 Battery Terminology 1.5 The half-cell . . . . 1.6 Battery modelling . . .
1.6.1 Statement of originality
2 Dilute electrolyte modelling of battery 2.1 Introduction . . . .
xv xvii xix 1 1 3 3 -1 -1 5 5 6 7 9 10 13 13
2.2 Derivation of a model fur a dilute electrolyte 13
2.2.l Charge neutrality. . . 14 2.3 Reaction kinetics on the electrode particle surfaces 15 2.-1 The electrode particles . . . 17 2.5 Homogenisation of model accounting for microstructure on electrode
par-ticle scale . . . 19
2.5.1 The current collectors 2.5.2 The separator . . . . . 2.5.3 The initial conditions
21 21 21 2.5.4 The relation between current and global reaction rate 22 2.5.5 Summary of the battery model and comparison to other models. 22 2.6 Numerical and analytical solutions for the full cell model 23
2.6.1
2.6.2 2.6.3
Equilibrium solution . . . .
Noudimensio11alizatio11 . . . . 2.6.1.1 Size of dimensionless parameters . . . . .
The Tafel equation approximation for r!"
< <
1 and fl"< <
1 The quasi steady approximations forr
< <
1\'
2-1 2-1
CONTESTS
2.6.-± Solution for flat discharge curYes . . . . Solution before the particles arc fully discharged. Numerical procedure
2.6.5 Results and Discussion . . . . . 2. 7 The half cell cathode model . . . . 2. 7.1 Quasi-steady state limit
r
-7 02. 7 .2 Flat discharge curve approximation for LiFePO .t cat ho de 2. 7.3 Analytic solutions . . . .
2.7.3.1 Before the development of a free boundary Numerical solution procedure . . . 2. 7.3.2 After development of free boundary
Numerical solution procedure 2.7.3.3 Results and discussion. 2.8 Summary . . . . 3 Modelling moderately concentrated electrolytes
3.1 Introduction . . . . 3.2 Stefan-Maxwell equations . . . . 3.2.1 Chemical potential (µ) a11d electrochemical potential (µ)
electrolyte at constant pressure and tcmpcratnrc Chemical potential . . . . Electrochemical potential . . . . 3.3 The Stefan Maxwell equations for the binary 1:1 electrolyte A vera.ged approximation to Poisson's equation
Non-dimensionalising Poisson's equation Charge neutrality . . . : . . . . Equations for the current density j . . . .
of the
Derivation of the ion velocities in terms of the electrolyte 28 29 30 30 33 35 36 37 37 38 38 39 40
.u
45 45 -Hi 46 46 47 47 48 49 50 50chemical potential p.,., and j. . . . 52
3.3.1 3.3.2 3.3.3 3.3.4
Diffusion equation for the electrolyte concentration . 53 Summary of model for moderately concentrated electrolyte
An ideal solution . . . . How might we deal with the electric potential . . . . The potential measured with respect to Lithium electrode
53 54 54 55 Remarks . . . . .
3.-± Thermodynamic fitting to data 3 .. 5 Summary . . . .
56 56 58 4 Review of homogenisation technique for moderately concentrated
elec-trolyte model 59
4.1 Introdnct ion . . . 59 4.2 The cell scale electrolyte equations by homogenisation technique . . . 60 Boundary conditions on the surface of the electrode particles GO
General set of microscalc electrolyte equations. . . 61 The asymptotic expansions. . . 62 The solution to the moderately concentrated electrolyte
CONTEXTS vii
4.3 Butler-Volmer reaction equations . . . 64 4.3.1 The general version of Butler-Volmer equations for insertion material 64 4.3.2 The Butler-Volmer equations of electrode materials for lithium
battery . . . 67 LiC5 anode material . . . .
LiFeP04 and LiCo02 cathode materials 4.4 Summary of the resulting model . . . .
4.4.1 Bonndary conditions for the foll cell battery . 4.5 Summary . . . .
5 Models for electrode particles 5.1 Introduction . . . .
5.2 Two phase Lithium insertion/extraction 5.2.1 ''Shrinking-core" model . . .
5.2.l.1 5.2.1.2
Nondimensionalisation . . Solution Procedure
A8ymptotic 8olution of 8hrinking core diff1rnion Summary . .
5.2.2 Phase-field model . . . . 5.3 1fore than two pha8es . . . . 5.-1 Diffusion equation in the spherical coordinate Current density in the electrode . 5.5 Summary . . .
6 Numerical Procedure 6.1
6.2 6.3
Introduction . . . . 11ethod of Lines
Development of sparse matrix for the system 6.3.1 The development of the solution vector u
6.3.2
6.3.3 6.3.4 6.3.5
6.3.6
The development of matrices for electrolyte concentration, c Sun1111ary . . . . The development of matrices for electrolyte potential,
¢
. . .
The development of matrices for the electrode potential,/Ps
.
The development of matrices for concentration iu the electrode particles, r's . . • • . . . .The development of A, JVI and
f
.
6.4 ode15s . .Convergence . 6.5 Summary
7 The Half cell Anode 7.1 Introduction . . . . 7.2 The half cell anode model
67 67 68 69 70 71 71 71 73 74 76 77 78 79 80 81 81 82 83 83 85 86 87 88 89 89 90 91 93 93 94 96 97 97 97
7.3 Nondimensionalisation . . 99
Remarks. 99
viii CONTESTS
7.-!.l.1 An approximation solution . . . 107 Summary . . . 108 7.-!.l.2 Concentration-dependent of diffusion coefficient . 108
7.5 Summary . . . . 112
8 Half cell cathode 115
. 115 . 116 . 118 . 119 . 121 8.1 Iutroductiou . . . .
8.2 Transport data and parameter values used in the simulation 8.2.l Nondimensionalisation . . .
Parameter Values . . Numerical Procedure
8.3 l\fodel-experimental comparison . . . 121
8.4 The effects of parameter variations on the discharge of a uauostructured
half-cell cathode . 123
8.5 Summary . . . 136
9 Conclusions and Future Works
9.1 Conclusions . . . . 9.2 Future works . . . . The effect of different sizes of particles
The effect of changes in particle shape and packing upon 137 . 137 . 139 . 139
List of Figures
1.1 A schematic diagram of the Lithium Ion Battery during discharge [59]. The current flowing out of the positive electrode drives the extraction of lithium ion from negative electrode (anode) particles to the electrolyte across the porous separator (by diffusion and advection) into the positive electrode (cathode) and insert into the positive electrode (cathode). The charge of electrons arc moving from the negative electrode particles to the negative electrode current collector and from the positive electrode current collector to the positive electrode particles. . . 2 1.2 Structure of the electric double layer near a solid electrolyte interface
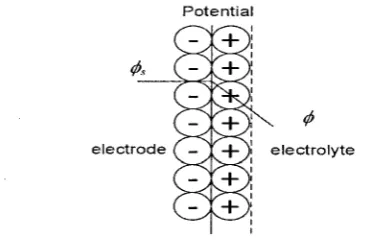
when external electric field is applied. The electric drops linearly from the electrode potential </Js to the electrolyte potential </J in a thin layer. . () 1.3 Schematic diagram for typical half cell anode. The cathode material is
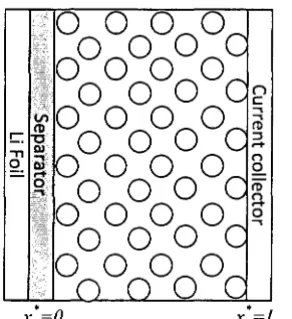
a lithium-foil which is reacting as reference electrode. During discharge, the Lithium ions are conducted through the electrolyte solution to the lithium electrode. Here x* = 0 is the anode current collector and x* = L is the separator. . . 8 1.4 A.schematic diagram for a typical half-cell cathode. The anode material
is a lithium-foil. Here x* = 0 is the separator and :r* = L is at cathode
current collector 8
2.1 Reaction rate on the solid electrolyte interface in anode and cathode. 15 2.2 Different types of open circuit potential i.e. u;qc(Y) curves for different
cat hocle materials with respect to the insertion chemistry of the materials, y (normalized capacity). . . 17 2.3 Different types of open circuit potential i.e u;qa ( x) curves for different
anode materials with respect to the insertion chemistry of the materials,
x (normalized capacity). . . 18 2.-1 Schematic representation of the mathematical domains in particle scale. 20 2.5 The solution of dimensionless dectrolyte potential, ¢(x) from (symbols)
analytical expression (2.91) compared to (line) numerical simulation using :\IATLAB 'bvp4c' at discharge current
l
= 1.32. . . 312.G Graph of dimensionless electrolyte concentration c(x) at different dis-charge currents
l
= 1.0, l.2, 1.4, 1.7 as a function of position. This ana-lytical solutions are obtained by equation (2.91). . . 32 2. 7 Graph of dimensionless electrolyte potential ¢(x) at different dischargecurrents
l
=
1.0, 1.2, 1.4, 1.7 as a function of position. This figure is obtained by relation to the electrolyte concentration as stat0d in (2.77) . . 32x LIST OF FIGURES
2.8 Dimensionless intercalated Lithium concentration distribution in the par-ticle for anode (0
<
.r,<
1) and cathode (1<
.r<
2), rsa and r«c, respectively (by solving (2.88)-(2.90) numerically) for discharge current (a)l
= 1 and (b)l
= 1.5. Here 0<
x<
1 is the anode and 1<
x<
2 is the cathode. The profiles arc measured at t*=
lOOs. 200s, 300.s, 400s, ....3j
2.9 The free boundary problem; (a) .r
<
s(t) - Cathode particles are full with Lithium (csc=
1) and (b) x>
.s(t) - Cathode particles are partially filled (c·"'<
1)
. . . .
36 2.10 Dimensionless concentration profifes of the model before the freebound-ary develops by (symbol) analytical solution (2.119) and (solid line) nu-merical simulation for
l
= 1. . . . 40 2.11 Lithium ion concentration distribution in the solid particles by equation(2.122) at
l
= 1. The profiles are measured at t = 0.05,0.1,0.15,0.2, .... At certain time ( t=
i),
the concentration in the solid reaches maximum(csc = 1) in region near separator and at later time (t
>
i),
free boundarydevelops. Herc
i
= 0.55 . . . 412.12 (a) Upper figure: the concentration of lithium in solid particles that reaches the maximum capacity at x
=
s(t). The solubility rate of lithium no longer at the same rate at this point forward because of the concentra-tion profiles of electrolyte. (b) Lower figure: The concentraconcentra-tion profiles across the cell in comparison to the time before (t<
i) (by equation (2.119)) and after (t>
i) (by equation (2.132)) formation of free bound-ary. The profiles are discharged atl
=
0.5. The arrow shows the direction of increasing time andi
= 0.64. . . 43 2.13 The concentration of Lithium in solid particles and Lithium ionselec-trolyte at
l
=
1 discharge rate. The arrow shows the direction of time increases (t=
0.55,0.6,0.65, ... ) andi
= 0.55 . . . 44 3.1 Structure of the electric double layer near a solid/ electrolyte interface.\Vhen external electric field is applied, bulk motion of an electrolyte caused by Coulombic forces acting on ions in the electric double layer. The electric double layer, composed of a Stern layer(layer 1), Debye layer(layer 2) and bulk solution(layer 3). The bot.tom graph shows the difference of potential energy in each layer before the mobile ions extending into the bulk solution. . . 49 3.2 Diffusion coefficient as a function of concentration; line represents the fit
to (3.71) and circles arc the experimental data from Ricmcrs [90]. 57 3.3 Concentration-dependent of electrolyte conductivity; line represents the
fit to (3.72) and circles are the experimental data from Riemers [90]. 57 4.1 Illustration oft he microstructured boundary . . . . . 63 5.1 Illustration of the shrinking-core model with the side by side of the two
phases and the 1110\'cmcnt of the phase boundary. The processes during discharge are illustrated and the pictures below showing concentration of Lithium as a function of r for different times. The dark region イ・ーョセウ・ョエウ@
the Lithium-rich region and the bright region represents the Lit hi um-poor
Xll LIST OF FIGURES
7.8 The comparison of non linear diffusion coefficient-experimental data for the graphite half cell discharge curves at different currents. The curves are obtained by analytic approximation solution (7.34) where the diffusion equation in the solid (see (7.23)-(7.24)) is solved numerically. The nonlin-ear diffusion coefficient (the fitting to the data from Zhang et al. [102]) is
i
given by equation (7.36). Solid lines represent the analytic solutions and symbols represent experimental data at various discharge currents. The dashed cmTe represents the equilibrium potential curve. . . . 112 7.9 The <limeusiouless couceutration of Lithium withiu the electrodepar-ticle at 3C discharge rate where D8(c8 ) is calculated using data from
Zhang et al. [102] (see formula (7.36)). The profiles are measured at
t* = 30s, 60s, 90.s, 120s, lGOs . . . 113
8.1 The equilibrium potent.ial of the LiFeP04 electrode as a function of Cs
(the state of discharge, c8
=
c:/cmux) (sec equation (8.27)). . . . . 1208.2 The comparison of model with the experimental data for the LiFeP04 half cell discharge curves at different currents. Solid lines represent the analytic solutions and symbols represent experimental data at various discharge currents. . . . . 123 8.3 The concentration of solution in the electrolyte across the electrode at (a)
0.8C and (b) 3.2C discharge rate. The profiles are measured at (a) t*
=
393s, 785s. ll 78s, 1571s, 1963s and (b) t*
=
162s, 325s, 487s, 58Gs, 650s. . 124 8.4 The concentration of Lithium in the solid at the electrode particle surfacesas a function of position in the electrode at (a) 0.8C and (b) 3.2C dis-charge rate. The profiles are measured at (a) t* = 393s, 78Gs, ll 78s, 1G71s, 1963s and (h) t*
=
162.c;, 325s, 4878, 5858, 6508. . . . . 125 8.5 The reaction rate (per unit surface area) at the particle electrolyteinter-face as a function of position in the electrode for discharge at 3.2C. The profiles arc measured at t*
=
162.s, 325s, 487.s, 585s, 650s. . . . . 126 8.6 The dimensionless concentration in the electrode particle as a function ofradius at different positions in the electrode for discharge at 3.2C. The profiles are measured at t*
=
162.s, 325s, 487.s, 585s, 650s. . . . . 126 S.7 The concentration of solution in the electrolyte across the electrode at SCdischarge rate. The profiles are measured at l* = :33s, 4Ss, 5Ss, 62s, 65s. . 127 S.8 The concentration of Lithium in the solid at the electrode particle surfaces
as a function of position iu the electrode at SC discharge rate. The profiles are measured at t* = 33s, 4Ss, 5Ss, 62.s, 65s. . . . . 127 S.9 The rnltage curves for different conductivity ratios in the solid ( u8 ) and
electrolyte (Knrnx) phases. The cell is discharged at l.6C. . . . . 128 8.10 The dimensionless solid concentration profiles at the electrode particle
::mrfaces as a function of position in the ele('trode for different conduc-tivity ratios in the solid (us) and electrolyte (Kmax) phases. The ('ell is discharged at l.6C. . . . . 129 S.11 The electrolyte concentration profiles across the electrode for different
conducti\·ity ratios in the solid (us) and electrolyte (Kma.r) phases. The cell is discharged at l.6C. . . . . 130 8.12 The dimensionless solid concentration profiles in the electrode particles
DECLARATION OF AUTHORSHIP
I, Rahifa Ranom, declare that the thesis entitled Mathematical Modelling of
Lithium Ion Batteries and the work presented in the thesis are both my own, and have been generated by me as t.he result of my own research. I confirm that:
• this work was done wholly or mainly while in candidature for a research degree at this University;
• any part if this thesis has previously been submitted for a degree or any other qualification at this Uniwrsity or any other institution, this has heen clearly stated; • where I have consulted the published work of others, this is always clearly
at-tributed;
• where I have quoted from the work of others, t.he source is always given. \Vith the exception of such quotations this thesis entirely my own work;
• I have acknowledged all main sources of help;
• where the thesis is based on work <lone by myself joiutly with others, I have made clear exactly what was done by others an<l what I have contrihnted myself; • parts of this work have been published.
Signed:
Date: 31st October 2014
List of Publications
1. Ranom R., Richardson G., Please C., (2011). Steady state solution during dis-charge in lithium ion batteries with Tafel kinetics, International ConfC'rcncc of Chemical Engineering and Industrial Biotechnology (ICCEIB), November 28 -December 1, 2012, Pahang, Malaysia.
2. Ranom R., Richardson G., Please C.P., (2012). Discharge of half cell cathode of lithium ion battery. British Applied l\Iathematics Colloquium (BAl\IC), April 6 - 9, 2012, London, UK.
3. Adesukan B., Ayass W.A., Lim S., Peace A, & Rahifa R., (2013), Assessing molecular properties for oral drug delivery., 5th UK Graduate l\Iodelling Camp, April 9-12 2013, Oxford, UK.
4. Rahifa R., Foster J.l\f., Richardson G., (2014), Mathematical modelliQ.g of half-cell Lithium ion battery in moderately dilute solution., International Meeting of Lithium Batteries, June 10-14 2014. Lake Como, Italy.
Acknowledgements
Thanks to Almighty Allah S.W.T. for graciously bestowing me the perseverance to undertake this research. Special thanks are due to: University of Southampton for the opportunity to carry out research; Universiti Teknikal l\Ialaysia Melaka (UTel\I) for the financial support and Kementerian Pengajian Tinggi (KPT). \Varmest thanks and a deepest appreciation to the following people: l\,Iy parents, Ranom and Hamidah, for a lifetime of love and support; l\Iy lovely husband, Ahmad Fuad, for an eternity love and full support; l\Iy academic father, Dr. Giles Richardson, for all his help and expert advice, for the encouragerneut awl iuspiratiou; Dr. Jamie Foster, for his uurnerical expertise: l\Iy daughter and son, Arissa Humaira and Isyhadh Umayr, for make my life full of happi:ness and laughters; l\Iy family and friends, for all their support and for sharing me so often with my prohlems.
Chapter 1
Introduction
The demand for more efficient renewable energy resources is rapidly growing as energy and environmental based issues becomes of increa<>ing concern. Lithium ion batteries are currently the state of art of rechargeable electrochemical storage devices. These batteries provide high volumetric energy densities, high cyclahility and are highly flexible as regards to design, size and application. They are used in many applications in portable electronics such as mobile phones, laptops and power tools; and are being considered for use in electric vehicles. Lithium ion batteries have thus gained much attention from researchers worldwide. Moreover, the development of lithium batteries has become a key focus for researchers in automotive companies who are investigating their use in hybrid electric vehicles (HEV), plugin hybrid vehicles (PHEV), and purely electric vehicles (EV); the markets for all of which arc expected to grow imbi-;tantially in the future years.
1.1
Lithium batteries as energy storage solution
The lithium ion battery is one of the most successful electrochemical batteries and billion of these cells are produced every year. They provide rechargeable energy storage at high energy density, with no memory effect, and slow loss of charge when not in use [11]. They are of growing interest to the automotive industry, amongst others. Thus, there is a 'hig drh·e to increase their efficiency, i:;torage performance and the speed at which they can be charged and recharged. r-.Iany approaches have been taken to simulate the operation of such devices in order to better understand their behaviour.
The Lithium ion cell consists of four parts, namely (I) the anode which is comprised of negative electrode particles, (II) the cathode which is comprised of positive electrode particles, (III) the separator that lies between the electrodes (this is a porom; insulator that prevents direct electrical contact between the electrodes \\·hile allowing passage of
2
·t
セ@
8
;n::0
,,.,
z _, n 0
,-,,.,
n _,
0
::0
'·
セセー@ 1· ;th.II
I . . - l
[image:14.597.127.402.62.257.2]Chapter I Introduction
Figure 1.1: A schematic diagram of the Lithium Ion Battery during discharge [59]. The current flowing out of the positive electrode drives the extraction of lithium ion from negative electrode (anode) particles to the electrolyte across the porous separator (by diffusion and advection) into the positive electrode (cathode) and insert into the positive electrode (cathode). The charge of elec-trons are moving from the negative electrode particles to the negative electrode cmTent collector and from the positive electrode current collector to the positive electrode particles.
the electrolyte) and pV) the Lithium ion electrolyte which transports ions (and thus charge) between the anode and cathode. A schematic diagram of such a cell (<luring discharge) is shown in Figure 1.1. At the outer boundaries of electrodes there are current collectors (charge collectors) that connect to an external circuit.
During discharge, Lithium diffuses through the negative electrode (anode) particles to the solid-electrolyte interface where it undergoes a charge transfer reaction (refer Figure 1.1) in which a Lithium ion (Li+) is released into the electrolyte and an electron (e-)
is released into the electrode pmticle (de-intercalation). The Lithium ion adveets, et ml diffuses, through the electrolyte solution to the positive dl'ctrode (cathode). A similar reaction occurs 011 the surface of a positive electrode (cathode)_particle in which the
Chapter 1 Introduction 3
current to pass in the reverse direction. The Lithium ions then migrate from the cathode to the anode, \\·here they become embedded in the electrode material (intercalation). The anode and cathode materials are selected so that the anode preferentially gives up electrons (and thus also lithium ions), and the cathode preferentially accepts electrons (an<l thus lithium ions). The tendency of a material to give up or accept electrons is determined by its standard electrode potential. The difference in the standard electrode potential of the anode and the cathode gives the voltage of the cell at equilibrium (the potential difference between the current collectors). The equilibrium potential is the difference between the electrical potential of the two current collectors when no external electric current flows between them. It is a function of the electrode materials used. In the following sections, an overview of battery materials for Lithium ion rechargeable batteries is provided.
1.2
Battery materials for Lithium ion batteries
Typically, both electrodes (anode and cathode) in a lithium ion battery are intercalation compounds, that is, they have a lattice structure in which small atoms, such as lithium, can be inserted and extracted. In contra.'lt, the electrolyte allows the flow of electrical charge (in the form of lithium ions) between the anode and cathode. This section reviews battery materials for anodes, cathodes and electrolytes.
1.2.1 Desirable electrode and electrolyte properties
In designing a battery, the properties of dectro<le materials and electrolytes are im-portant in order to achieve a successful cell once they arc a.5scmblc<l. They should, for example be chosen so that the cell is stable and safe to minimizes the risk of shoi·t circuits. The key requirements for a successful electrolyte are high conductivity (high mobility of Lithium ions), stability (at high temperatures and in high voltage application) [82], and safety (low flammability [10]). Electrolyte decomposition and si<le reactions in lithium ion batteries can create thermal runaway [11
J.
Thus, the electrolyte select.ion has to balance between flammability and elect roehemical performance.4 Chapter 1 Introduction
1.2.2 The cathode material
In 1991, the first type of cathode material to go into commercial production, \Yas cobalt oxide (LiCo02) [9G]. It (de)intercalates lithium ions at around 4V and bas a theoretical capacity of 140 mAh/g [88]. The other advanced cathode materials include lithium metal oxides (such as Lil\In20-i), olivines (such as LiFeP04), awl rechargeable lithium oxides [82].
In 1996, Goodenough patented a new kind of lithium ion cathode material which is iron phosphate LiFeP04 [65]. This material is more powerful and less likely to catching fire, which are important considerations for automotive applications. LiFeP04 has already found in many industrial applications due to its reasonable voltage of 3.5V, high theo-retical capacity (l70mAh/g)
[52],
low cost, low toxicity, and high thermal stability [65]. Because of its potential, much research has been directed towards optimizing synthesis routes for LiFeP0 4 cathodes. A disadvantage of this material is low conductivity. How-ever carbon coating of the electrode particles increases the conductivity of the electrode[47].
LiFePO-i is also thermodynamically stable [67], and its has a lattice structure so that the insertion/extraction lithium ions process does not change structure of the host material [95].Lithium metal oxides contain cobalt and nickel. They show a high stability in the high-voltage range but cobalt has limited availability in natural resources and is toxic [22]. l\Ianganese offers very good rate capabilities but ha." poor cycling behaviour. Therefore, mixtures of these three materials are often used for a good cathode !naterial.
1.2.3 The anode material
The commercial anode material in lithium ion batteries is graphitic carbon (LiC6 ) which
can store up to one Li+ for every six carbon atoms in between its graphene layers. The material is highly conducting and supports high current densities [13]. However, the theoretical capacity (372 mAh / g) is poor in comparison to that of pure lithium (3,862
mAh/g) [97] and it exhibits moderate charge/discharge rate performance which limits
the lifetime of the cell [69]. The parameters used to increase th.e performance of this anode material are its thickness, and its porosity.
Chapter 1 Introduction
capacity (4,199 mAh/g) corresponding to a composition of Si5Li22 [22]. However, the large volume changes that occur during the insertion and extraction processes cause severe cracking of the electrode, which in turn leads to very significant capacity fade dnring cycling [98]. The cyclahility of this electrode can he improved hy adding Ketjen-black carbon, which gh·es a chainlike structure that maintains a stable electronic contact between silicon particles [98]. They can also be improved by nanostructuring [10].
1.2.4 The electrolyte
Liquid electrolytes conduct lithium ions and acting as a carrier between the cathode and the anode. The electrolytes typically used in lithium ion cells are mainly based on an organic solvent based. Examples of electrolyte salts used in applications in-clude lithium hexafluorophosphate (LiPF5), lithium hexafluoroarsenate monohydrate (LiAsFG), lithium perchlorate (LiCl04), lithium tetrafluoroborate (LiBF4), and lithium triflate (Li CF 3S03). LiCl04 provides a stable charge-discharge efficiency that increases the cycling capacity of the cell [10]. LiBF4 is less toxic than LiAsF6 and safer than
LiCl04 but has only moderate ionic conductivity
[47].
lゥcf[セsoZセ@ is resistant to oxida-tion, nontoxic, thermally ::;table, and inscn::;itive to ambient temperature in contra::;t to LiPF6 . However, it has low conductivity in nonaqueous solvents ns compared to othersalts
[47].
Currently, LiPF6 is the standard electrolyte in commercial batteries. It has qualities
such as high conductivity, high solubility in organic solvents, and stability in the solve'nts mixture and on common electrode materials [22]. The organic solvent that often used in battery electrolyte is a mixture of ethylene carbonate and dimethyl carbonate (1 :1 EC:D1IC). Ethylene carbonate (EC) ha.-; ability to form a good SEI layer on common anode materials and dimethyl carbonate HdセicI@ has ability to lower the EC melting point
[22].
In thi8 8tudy, we cho8e the mo8t common electrolyte solution, which i8 LiPFG salts dissolved iu a mixture of 1:1 EC:DMC. This c:ombiuatiou performs well enough iu current battery systems.1.3
Charge-transfer reaction
The reactions in which charges are transferred across a solid electrolyte interface are called charge transfer reactions. Herc both electrodes arc either oxidized or reduced:
6 Chapter 1 Introduction
charged ions, on the electrolyte phase. The layer across which this charge separation
occurs is called the electrical double layer, and is extremely thin (typically of order
lnm) compared with the width of the electrolyte and electrodes. In its simplest form
the double layer is described by the Helmholtz model. which describes the double layer
as a parallel plate capacitor with a small plate separation (see Figure 1.2). In this model,
the potential changes linearly from the electrode potential ¢s to the electrolyte potential
dJ in a thin layer. This layer is referred to as the Helmholtz layer.
Potential
electrode electrolyte
Figure 1.2: Structure of the electric double layer near a solid electrolyte inter-face when external electric field is applied. The electric drops linearly from the electrode potential <Ps to the electrolyte potential ¢ in a thin layer.
The electrical double layer translates into boundary layers in the concentration profiles .
. Near an electrode that is negatively charged we expect an excess of Li+ ions and a deficit of N- ions. These differences are only expected close to the elPctrode surface,
thus it is usual to assume charge neutrality in the bulk of the solution. Further details
on drnrge neutrality will be discussed later. The overpotential, q77 is defined such that
'f/ gives the change in the electrochemical potential of a Li+ between the electrolyte and the electrode. It takes the form
where ¢ is the electrolyte potential, <;).- is the Solid potential and uf'IJ is the equilibrillJ11
potential of the electrode material (qUcq is the change in che1_11ical potential of Li+ ion between the ckctrode and electrolyte). The eqnilibrimn potential, or open circuit
potential, is the difference of electrical potential between the two terminals of a device
when there is no electric current flmys between them. Usually it is measured at a ,·ery
low discharge rate.
1.4
Battery Tenninology
• Capacity. The capacity is a measurement of how ュ。ョセᄋ@ electrons can be
[image:18.595.146.336.192.313.2]Chapter 1 Introduction 7
milliamp hours per gram. A symbol Q is used for this parameter. This quantity is
often normalized by mass, so that it is unaffected by the size of the battery. The
maximum capacity of a cell is determined by the amount of charge when the cell is
discharged at a very low rate. Current cathode materials ha\·c maximum capacities
in the range of Qmax = 100-200mAh/g and graphitic carbon (the most common anode material) which has a maximum capacity of around Qmax = 300mAh / g. • Specific Power. Another important parameter for battery operation is how
much power can be provided per unit mass. This value, measured in watts per
kilogram, is particularly important for high power applications snch as acceleration
of electric vehicles where a large amount of energy must be provided in a short
time. Specific power is heavily influenced by the voltage difference between the
anode and cathode and the speed of ion transfer between the electrodes.
• Cell Voltage. A key parameter in maximizing the specific power of a battery
is the voltage difference between the anode and cathode. This difference is
deter-mined by the relative voltages at which the (de)intercalation reactions take place.
In this thesis, discharge curves are plotted showing the cell voltage as a function
of the state of discharge and at certain specific discharge rates.
• Discharge rate, C-rate. The disc.barge rate is the rate at which current is taken
from a cell. It is reported as a C-rate with 1 C corresponding to a battery being
completely charged or discharged in one hour. High rate capability is essential for
quick charging batteries and high power applications. For instance, for a battery
with a capacity of lOOA/hours, this equates to a discharge current of lOOAmps.
A 5C rate for this battery would be 500Amps, and a C/2 rate would be 50Amp8.
• State of charge / discharge. The state of charge (SOC) is defined as the
c.apacity still available in the cell. It is normally expressed ns a ratio of the rated capacity to the maximum capacity and a 0 SOC battery is fully discharged while a
1 SOC battery is fully charged battery. The state of cfoidrnrge (SOD) is dc0fi11ed as
the ratio of battery capacity that has been discharged to the maximum capacity.
State of charge/discharge can be calculated as the current multiplied by the time
and divided by the maximum capacity of the cell (It/Qmax)·
1. 5
The half-cell
In order to test a particular electrode in the lab it is usual to perform experiments on a
half-cell. This consists of a single electrode (working electrode eitlwr anode or cathode)
and a pure Lithium electrode (reference electrode) as the other electrode (sec Figures
1.3 and 1.-1). Since the dectrodwmical potential of lithium in a lithium electrode does
6 Chapter 1 Introduction
charged ions, on the electrolyte phase. The layer across which this charge separation occurs is called the electrical double layer, and is extremely thin (typically of order lnm) compared with the width of the electrolyte and electrodes. In its simplest form the donhlc layer is dcscrihcd by the Helmholtz modeL which descrihcs the donhlc ャ。セイ@ as a parallel plate capacitor with a small plate separation (see Figure 1.2). In this model, the potential changes linearly from the electrode potential <Ps to the electrolyte potential
d; in a thin layer. This layer is referred to as the Helmholtz layer.
Potential
electrode electrolyte
Figure 1.2: Structure of the electric double layer near a solid electrolyte inter-face when external electric field is applied. The electric drops linearly from the electrode potential ¢s to the electrolyte potential ¢ in a thin layer.
The electrical double layer translates into boundary layers in the concentration profiles . . Near an electrode that is negatively charged we expect an excess of Li+ ions and a deficit of N- ions. These differences are only expected close to the electrode surface, thus it is usual to assume charge neutrality in the bulk of the solution. Further details on charge neutrality will be discussed later. The overpotential, q77 is defined such that q gives the change in the electrochemical potential of a Li+ between the electrolyte and the electrode. It takes the form
where Q is the electrolyte potential, ¢8 is the solid potential and U"'I is the equilibrium potential of the electrode material ( qUP(1 is the change in chemical potential of Li+ ion between the electrode and electrolyte). The cqnilihrimn potential, or open circuit potential, is the difference of electrical potential between the two terminals of a device when there is no electric current flows between them. Usually it is measured at a Yery low discharge rate.
1.4
Battery Tenninology
[image:20.595.216.397.194.314.2]8 Chapter 1 Introduction
[image:21.598.240.437.211.375.2] [image:21.598.272.418.458.617.2]applications it is usual to define potential with respect to a lithium electrode such that its potential is defined to be zero. The Yoltage drop across the half cell is then determined by the potential of the current collector. This motivated Newman to formulate his models [60] in terms of a lithium reference potential rather than the real potential. Theoretjal treatment of half-cells include works by Newman et. al. [84] and Farrell et.al. [23]. Fundamental research on electrode material is usually conducted in half-cell systems. Figure 1.3 shows a schematic diagram of a half-cell anode and Figure 1.4 that for a half-cell cathode.
Solid mterphase {SEI) layer
x*=O
Graphite
x*=L
Figure 1.3: Schematic diagram for typical half cell anode. The cathode material is a lithium-foil which is reacting as イ・セ・イ・オ」・@ electrode. During discharge, the Lithium ions are conducted through the electrolyte solution to the lithium electrode. Here x* = 0 is the anode current collector and x* = Lis the separator.
x·=o
n
c
.... ....
fl)
::l
...+
n
Q_ fl)
!4. 0
....
x·=L
,I:
10 Chapter 1 Introduction
takes place on the surface anode and hence increased the resistances on the surface of anode particle. Safari et al. [77] simulated the ageing phenomena in a commercial graphite/LiFeP0-1 cell.
The effects of intcrionic drag in non-dilute solution has been incorporated into Newman framework
[60]
but requires the model to be calibrated again experimental electrolyte data. An example of snch data is found in the \\·ork of Ricmcrs ct. al [90] which mca;mrcs conductivity, diffusivity and transference number as function of ions concentration in the electrolyte LiPF6 in 1:1 EC:Dl\IC. Fuller, Doyle and Newman [28, 36] incorporated the effects of the chemical activity in the electrolyte into their modelling framework. Recent work has shown that performance of Lithium ion battery can he imprm·ed through emphasis on engineering the microstructural architecture of the electrodes see [41, 83, 39]. Typically the effects of the microstructure in macroscopic models, such as Newman's [58], a.re represented by a few phenomenological parameters which can be crudely related to the properties of the microstructure. A more systematic ap-proach, that is capable of relating the geometry of the microstructure coefficients in the macroscopic model, has been developed by Richardson et.al [74]
in the case of dilute electrolytes. Herc we shall extend this method to a moderately concentrated electrolyte. Solutions to a battery model based 011 a dilute electrolyte model m which Lithiumdiffusion in the electrode particles is extremely fast are discussed in Chapter 2. In Chapter 3 we discuss au electrolyte model of a moderately concentrated electrolyte aud fit the model to real electrolyte diffusion, conductivity and transference number data. In Chapter 4, we discuss the application of homogenisation techniques to a model based on the moderately concentrated electrolyte model discussed in Chapter 3. In Chapter 5, we discuss Lithium transport in electrode particles (in particular the LiFeP04 and the LiC6 electrode materials), this is crucial for understanding intercalation. In Chapter 6, we discuss the numerical method that we use to solve the homogenised model presented in Chapter 4. Solutions to the model are compared against experimental data for half-cell Li.rCG (graphite) anodes (Chapter 7) and half-half-cell LiFePO-t cathodes (Chapter 8). Finally, \\·e draw our conclusions in Chapter 9.
1.6.1 Statement of originality
Chapter 1 Introduction 11
Chapter 2
Dilute electrolyte modelling of
battery
2.1
Introduction
In this section we develop a battery model based on dilute electrolyte theory. \Ve start in §2.2, by disrnssing a model for a dilute electrolyte. \Ve then discuss lithium transport between the electrolyte and the electrode particles in §2.3 before briefly discussing trans-port in the electrode partieles in §2.4 and illustrating how homogenisation can be used to derive a model on the scale of the battery model in §2.5. In §2.6 and §2.7 we deriYe some solutions to this battery scale model that illustrate the behaviour of a certain class of cell.
2.2
Derivation of a model for a dilute electrolyte
The Nernst-Planck theory has been used to describe a sufficiently dilute ek>ctrolyte [60]. This theory describes conservation equations for the ionic species that diffuse by ionic concentration gradient and adYect by an elec-tric field. Here we discuss the derivation of battery model in a dilute electrolyte, which previously has been described in Richardson
et al.
[74].
The general conservation of mass equation for two species, cO!l{'entrations 」セ@ and c; (mo! m-:3), that diffuse independently are
ac;
* 0-+\7·q· =
8f* I
for i = n.p. (2.1)
where qj is the ion flux of species i. The second equation is Fick"s Law of diffusion which states that the diffusiYe flux is proportional to the concentration gradient. Here Dn and
![Figure 1.1: cmTent collector the trons lithium A schematic diagram of the Lithium Ion Battery during discharge [59]](https://thumb-ap.123doks.com/thumbv2/123dok/524631.60363/14.597.127.402.62.257/figure-collector-lithium-schematic-diagram-lithium-battery-discharge.webp)