The operation of the lithium-ion battery is significantly different from the rechargeable batteries that preceded it. As a result, research groups have looked beyond the typical intercalation chemistries for the lithium-ion battery.
![Figure 1.1: Lithium-ion battery schematic. Adapted from [10].](https://thumb-ap.123doks.com/thumbv2/123dok/10416781.0/12.918.282.641.322.529/figure-lithium-ion-battery-schematic-adapted-from-10.webp)
The Lithium-Oxygen Battery
In the surface growth mechanism, the first two steps of Equation 1.2 occur on the surface of the electrode, with a second reduction reaction then occurring at the electrode. In the solution-mediated growth mechanism, the first two steps of Equation 1.2 also take place on the surface of the electrode.
Thesis Overview
The buildup of these byproducts that are not removed during OER leads to a passivation of the cathode, as insulating species prevent electrons from reaching the electrolyte. The complexity of lithium-oxygen chemistry is a far cry from Volta's first primary battery, described in Equation 1.1.
A MOLTEN SALT LITHIUM-OXYGEN BATTERY
Molten Salt Electrolytes
The introductory chapter demonstrated both the potential of lithium-oxygen batteries as a replacement for lithium-ion batteries and the many challenges that still need to be overcome for them to be realized in practice. In particular, finding sufficiently stable electrolytes in the presence of the active lithium-oxygen cathode electrochemistry has been the most elusive challenge to date.
CsNO 3
- Oxygen Electrochemistry in a Molten Salt
- Lithium Peroxide and Wulff Constructions
- ray Diffraction
- Battery Cycling Performance and Cell Death
- Summary
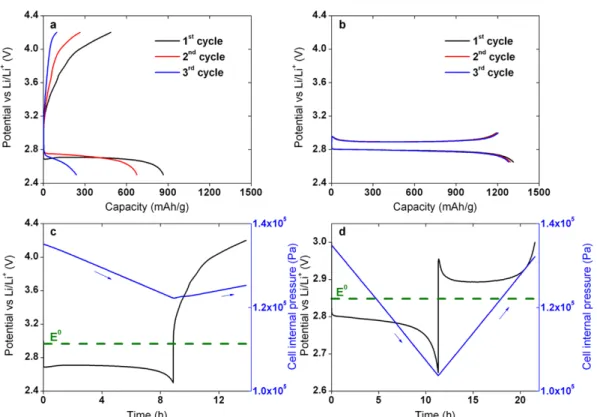
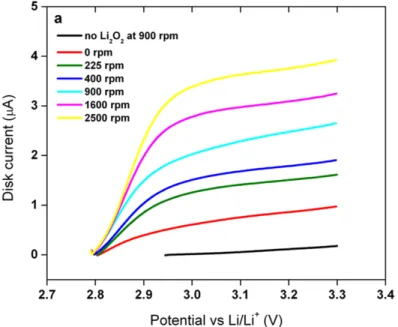
Upon addition of Li2O2, the OCV of the battery shifted to ~2.8 V vs Li/Li+ which is consistent with thermodynamic data. As the number of cycles increases, the voltage hysteresis of the battery increases, corresponding to the growth in electrode impedance.
A NITRATE REDUCTION BATTERY
- Nitrate Reduction Chemistry
- Catalysis of Nitrite Oxidation
- Lithium Oxide as a Discharge Product
- ray and Electron Diffraction
- Nitrate to Nitrite and Back Again
- Battery Cycling Performance
- Summary
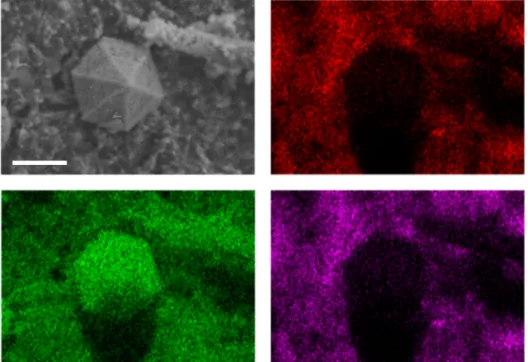
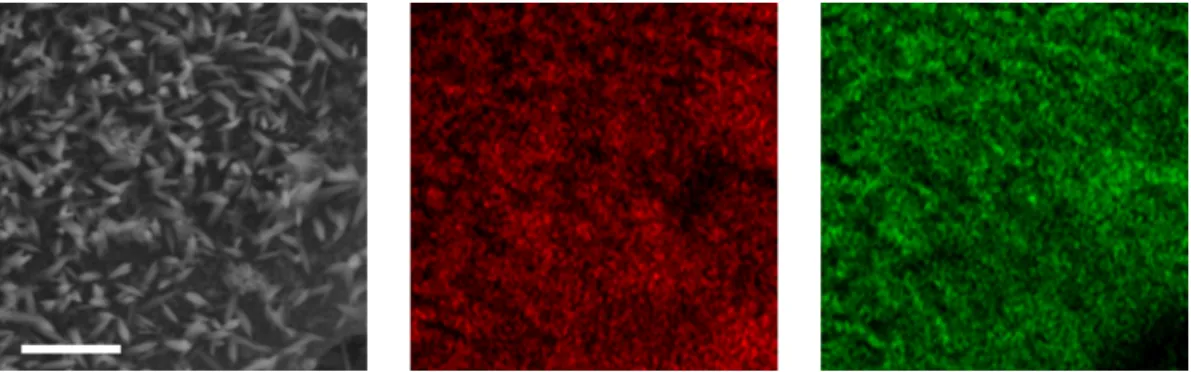
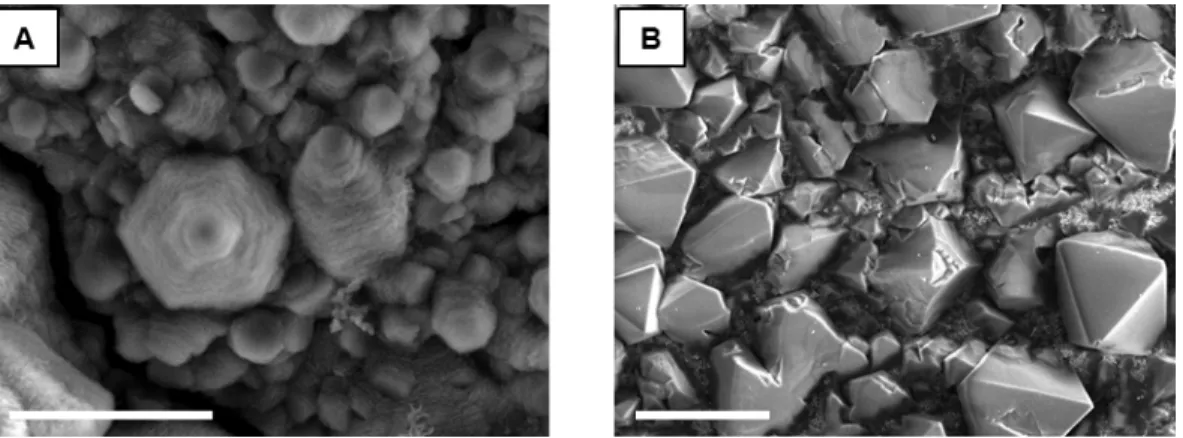
When attempting to reverse the chemistry after discharge, as shown in Figure 3.1, a significant overvoltage occurs accompanied by gas evolution, indicating the irreversibility of the reaction. The high-resolution micrograph in Figure 3.6a shows the surface layer present on these nickel nanoparticles. The Raman spectra of the initially frozen LiNO3–KNO3 electrolyte before discharge, after discharge to 2.3 V cathodic cut-off, and after the completed cycle (electrode fully charged to 2.75 V) are shown in Figure 3.12.
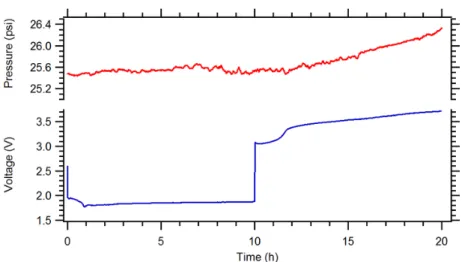
All three electrolyte compositions in Figure 3.13 have been verified through ion exchange chromatography, but the pure nitrite electrolyte is the most revealing. Note that the pressure in the upper part of the cell in Figure 3.15 remains constant over 1000 hours of circulation, indicating that we are not causing any side reactions when evolving the gas.
ROLE OF CATHODE ARCHITECTURE IN CONVERSION REACTION CHEMISTRIES
Capacity Limitations
In the case of an intercalation cathode as described in the introduction chapter, it is easy to define the capacity of the cathode in terms of the mass of active material. Due to this problem, the typical approach for normalizing battery capacity in lithium-oxygen cells is to use the mass of the cathode catalyst support material. The electrochemical surface area corresponds to the total surface area of the electrode that can contact the electrolyte and participate electrochemically.
As a result, the entire surface area of the cathode catalyst nanoparticles in the pressed bed is essentially lost, and the capacity of the battery cathode will not increase with its electrochemical surface area. While in the typical intercalation system the capacitance is directly proportional to the mass of active material, in this phase-forming chemistry the capacitance is determined by the ability of the "usable" electrochemical surface to accommodate the growth of the discharge product.
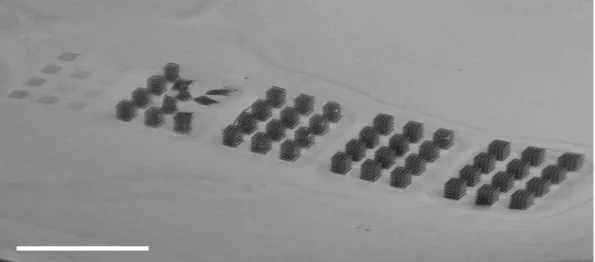
Fabrication of Architected Electrodes
A detailed description of the writing procedure and its optimization for the model in Figure 4.3 is given in the appendix. The result of this Nanoscribe fabrication is the replication of the model in Figure 4.3 as a polymer scaffold in Figure 4.4a. The image in Figure 4.4c demonstrates the macroscopic nature of the electrode, as well as showing the 1 cm polished stainless steel disc used as the substrate.
An FIB cross-section of an inner beam of the nickel-plated grating is shown in Figure 4.5b. A high-resolution SEM micrograph of the nickel film is shown in Figure 4.5c, showing its surface roughness.

Electrochemical Surface Area of Nickel Electrodes
In recent years, several groups have developed techniques to measure nickel surface area using electrochemical methods. To use NiOOH reduction to measure the surface area of a nickel. Instead of explicitly calculating the electrode surface area by first removing the surface oxide layer, CVs were performed on untreated as-sprayed nickel.
Although the actual value of the area cannot be calculated here, the ratio of the NiOOH reduction peak areas gives a value of 2.1. Then we can rely on the area ratio of 2.5 from the model, and using the surface enhancement factor of the sputtered nickel thin film, we know the electrochemical surface area of both the nickel thin film and the grid electrodes.
![Figure 4.7: Surface electrochemistry of nickel, in an alkaline solution. Adapted from [87].](https://thumb-ap.123doks.com/thumbv2/123dok/10416781.0/67.918.222.700.103.453/figure-surface-electrochemistry-nickel-alkaline-solution-adapted-87.webp)
Performance of Architected Electrodes
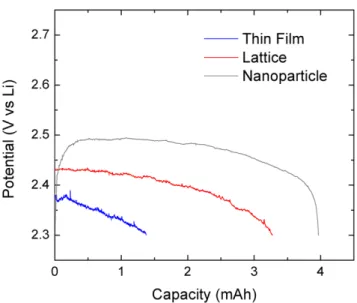
This wide peak separation and small current peak indicate that thin film and mesh electrodes will not be able to achieve high discharge current. Based on the CV behavior of mesh and thin-film electrodes, one might expect their discharge capacity to be significantly worse than expected. The mass of nickel was simply measured for the nanoparticles, and for the thin film and network it was estimated from the film thickness, and in the case of the network, the calculated volume in SOLIDWORKS.
The surface areas of nickel for the thin film and lattice were taken from the CV measurements earlier in this chapter, and for the nanoparticles the BET value mentioned in chapter three was used. Second, the thin film and grid electrodes have gravimetric values that are so large that they lose their meaning.
Commercial Foam Electrode Comparison
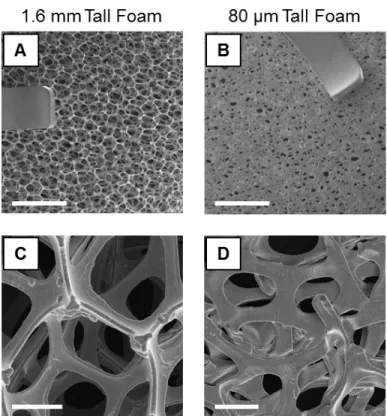
Due to the thickness of the open foam, a total of 450 mg of electrolyte was used instead of the typical 200 mg. Interestingly, the nitrate reduction peak current for the open foam is more than twice that of the nanoparticle in Figure 4.10. Comparing the electrochemical surface areas of the foam and grid electrodes, in addition to considering the CVs in Figure 4.14, gives a sense of the achievable current for the open and dense foam electrodes.
This is clear as we notice that two cathodes with similar surface area have a significant difference in discharge capacity which is due to the greater porosity of the open foam. All this suggests that the open foam is the preferred cathode structure of the two.
Summary
SUMMARY AND OUTLOOK
By explicitly designing a proof-of-concept architecture electrode with controllable surface area and pore size, we were able to study the interplay of these two properties and their effect on discharge capacity. It also gives a simple design principle if one wants to create a phase-forming chemistry with large capacity: incorporate an open pore structure to accommodate discharge product growth. Putting all this together, we have a good idea of what is needed for any similar phase-forming chemistry to be realized as a practical battery.
First, if a chemistry involves dissolving species in the electrolyte, then it must be paired with a protected anode to avoid crossover, and the dissolved species must be stable to each component of the battery. Second, if discharge product is to be grown on the surface of some catalytic support, this structure must be designed to accommodate the growth to enable a useful areal capacity.
BIBLIOGRAPHY
Mechanisms of Morphological Evolution of Li 2 O 2 particles during Electrochemical Growth. The Journal of Physical Chemistry Letters. Dual problems of interfacial carbonate formation in non-aqueous Li-O2 batteries. Walker, W. et al. A rechargeable Li-O2 battery with a lithium nitrate/N,N-dimethylacetamide electrolyte. Journal of the American Chemical Society.
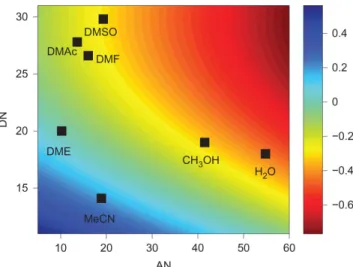
Enhancing electrochemical intermediate solvation through electrolyte anion selection to enhance non-aqueous Li-O2 battery capacity. Sharon, D. et al. Oxidation of Dimethly Sulfoxide Solutions by Electrochemical Reduction of Oxygen. The Journal of Physical Chemistry Letters4,3115–.
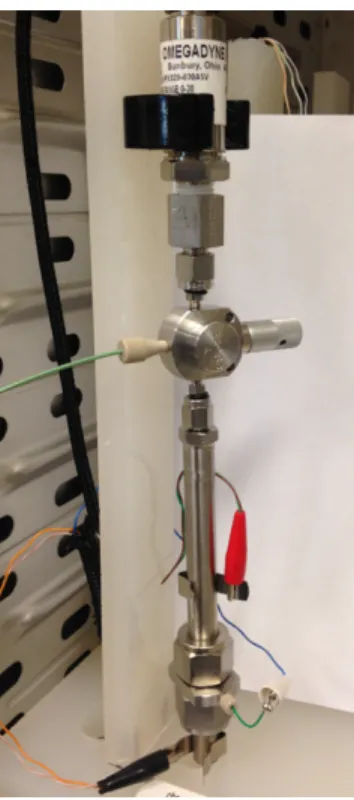
DETAILED CELL CONSTRUCTION
The entire battery assembly was carried out in an argon-filled glove box, with oxygen and water levels maintained below 0.1 ppm. The batteries were then transferred to an oven maintained at 120 or 150°C depending on the molten nitrate/nitrite salts used. After electrochemical testing, the cells were removed from the oven, allowing the molten salt to freeze.
After purging the headspace gas with argon, they were then moved inside an argon-filled glove box for further analysis. If it was desired to extract the electrolyte for further analysis, the entire Swagelok assembly was disassembled, allowing access to the salt without having to remelt it.
ION EXCHANGE CHROMATOGRAPHY CALIBRATION AND CALCULATION
Then, using the initial mass of electrolyte in the cell, the number of moles of each can be calculated. There is good reason not to simply take the concentration of ionic species and work backwards through the dilution procedure to arrive at the total amount of a component in the electrolyte. When the battery is disassembled to harvest the electrolyte (which is done when the electrolyte is a solid), it is easy not to recover all the electrolyte, as some inevitably end up in the pores of the cathode or on the lithium anode will get stuck.
This problem is easily avoided by taking only the ion ratio from the chromatographic data and using this with the known amount of electrolyte originally in the battery. Due to impurities in electrolyte salts (ie, nitrite salt containing nitrate impurities), correction factors calculated from ion exchange chromatography data were used to arrive at the final values.
NANOSCRIBE SPEED OPTIMIZATION
Starting from the substrate, all raster lines are written into a plane in galvo mode before moving out of plane (up in z) using piezo mode. Then the next plane is written with grid lines, and so on until the single unit is finished. One of these is the raster movement speed, but it only moves within a fairly small range and so won't play too much of a role (this was tested and saw little impact on time).
While a close spacing of raster lines within a beam results in a mechanically robust structure (since the writing voxels overlap significantly), it also takes a longer time. In addition, the laser power was varied because it plays a role in the degree of polymerization, and thus the mechanical properties of the structure.
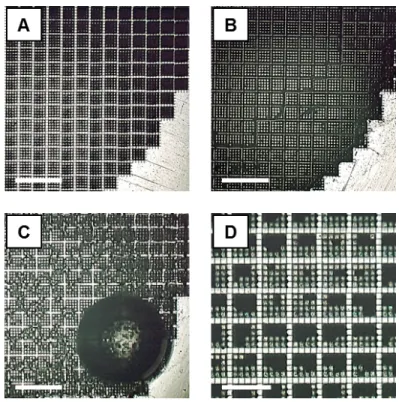
WETTING OF ARCHITECTED ELECTRODES
At the moment when the vacuum was reached, bubbles similar to those in Figure D.2c appeared from the grid. When all the bubbles disappeared (after about 30 seconds), the filled grid was taken out of the vacuum oven and dried on a hot plate. After determining the viability of the grid electrode for studying nitrate reduction, it was necessary to know its surface area.
Knowing from the previous section how difficult it is to moisten a grate, we decided to study the wetting process. Figure D.2 shows its evolution using a Keyence VW-9000 high-speed optical microscope. Images of grid electrode (A) when dry, (B) immediately after immersion in water, (C) after 15 minutes of immersion, and (D) after CVs from Figure 4.9.
![Figure 1.3: Typical lithium-oxygen first cycle. 0.1 mA cm -2 . Adapted from [20].](https://thumb-ap.123doks.com/thumbv2/123dok/10416781.0/15.918.252.654.308.583/figure-typical-lithium-oxygen-cycle-ma-cm-adapted.webp)
![Figure 1.5: Growth mechanisms of Li 2 O 2 . Adapted from [25].](https://thumb-ap.123doks.com/thumbv2/123dok/10416781.0/17.918.173.751.106.358/figure-1-growth-mechanisms-li-o-adapted-25.webp)