I hereby declare that I have read through this report entitle “Analysis on colour temperature of incident light to inhomogeneous object in industrial digital camera” and found that it has comply the partial fulfillment for awarding the degree of Bachelor of Mechatronics with
Honors
Signature:………..
ANALYSIS ON COLOUR TEMPERATURE OF INCIDENT LIGHT TO INHOMOGENEOUS OBJ ECT IN INDUSTRIAL DIGITAL CAMERA
WAN NOR SHELA EZWANE BT WAN J USOH
A submitted in partial fulfillment of the requir ements for the degree of Bachelor of Mechatr onics Engineering with Honor s
I declare that this report entitle “Analysis on colour temperature of incident light to inhomogeneous object in industrial digital camera” is the result of my own research except as
cited in the references. The report has not been accepted for any degree and is not concurrently submitted in candidature of any other degree
Signature:………..
i ADKNOWLEDGEMENT
First of and foremost, I thank Allah for giving me mental and physical strength as well
as capability to complete this project.
I am sincerely grateful to my supervisor PuanNurDiana bt Nordin@Musa for her
guidance, support and invaluable advice in completing this project and this progress report.
I also wish thank to my friends, especially my partners Noraidah Binti Ahmad, Fong
Kar Weng, Abdul Rahman Bin Abdul Ghani and Mohd Farhan Bin Ramli for their opinions
and ideas in doing the research.
My sincere appreciation also goes to my beloved father Wan Jusoh Bin Wan Daud, my
mother Zaumi Binti Omar and all my siblings. A big thank you for their support,
encouragement and putting colours in my life, may Allah bless you.
Last but not least, I wish to express my sincere thanks to all who had directly or
ii ABSTRACT
Visual information is important in the field of robotics to assist object recognition and route
mapping. However, variations of lighting fixtures impede the generalization for indoor
illumination and therefore require image correction. Hence, the project will analyze on the
effect of different white light illumination which produce different reflection on captured
image using industrial digital camera. Since most of the object on earth is inhomogeneous,
this research mainly focused on samples of inhomogeneous object and studies the reflection
characteristic. Three spherical objects painted with three different paints are the objects of
study. To maintain the colour constancy of the object, the correction factor is obtained using
MATLAB software to ensure the result of the colour image after processing is almost the same
with the colour of benchmark image.
iii ABSTRAK
Imformasi visual adalah penting dalam bidang robotik untuk membantu pengecaman objek
dan pemetaan laluan. Walau bagaimanapun, variasi lampu menghalang keseragaman
pencahayaan dan oleh itu, ia memerlukan pembetulan imej. Projek ini akan menganalisis
kesan pencahayaan cahaya putih yang berbeza yang menghasilkan refleksi yang juga berbeza
pada imej yang di ambil menggunakan digital kamera. Oleh kerana kebanyakan objek di
muka bumi ini adalah tidak sekata atau mempunyai permukaan yang tidak linear, kajian akan
lebih memfokuskan kepada sampel objek yang tidak sekata dan mengkaji ciri-ciri pantulan.
Kajian menggunakan tiga objek bulat yang telah dicat menggunakan tiga cat yang berbeza dan
untuk mengekalkan kemalaran warna objek tersebut, faktor pembetulan akan diperolehi
dengan menggunakan perian MATLAB untuk memastikan hasil imej warna selepas
pemprosesan adalah hampir sama dengan imej warna yang di tanda aras.
iv TABLE OF CONTENT
CHAPTER TITLE PAGE
ACKNOWLEDGEMENT i
ABSTRACT ii
ABSTRAK iii
TABLE OF CONTENT iv
LIST OF TABLE viii
LIST OF FIGURE xi
LIST OF APPENDIX x
1 INTRODUCTION
1.1 Background 1
1.2 Problem statement 1
1.3 Objective 2
1.4 Scope 2
2 LITERATURE REVIEW
2.1 Introduction 3
2.2 Colour Temperature 4
2.3 Analysis on effect colour temperature 5
2.5 Effect on incident light to inhomogeneous object 10
2.6 Colour space 12
2.7 Industrial Digital Camera 14
3 METHODOLOGY
3.0 Introduction 16
v
3.2 Identify of Problem Statement 18
3.3 Research and review techniques 18
3.4 Software part: Matlab Software 18
3.5 Design the experiments 19
3.6 Preparation before experiment 21
3.6.1 Captured the ball images 21
3.6.2 Creating a mask 24
3.6.2.1 Procedure mask 25
3.6.2.2 Usage mask 28
3.7 The experiments 29
3.7.1 Experiment 1: Determine the
differences between benchmark image
(D65) with other images under different
lighting. 29
3.7.1.1 Procedures experiment 1 29
3.7.2 Experiment 2: Determine the colour frequence
and the colour range in colormap and
obtain the qualitative value (histogram) 30
3.7.2.1Flow chart experiment 2 31
3.7.3 Experiment 3: Compare the benchmark
histogram with other histogram under different
lighting fixture and obtain the qualitative value. 32
3.7.3.1 Procedures experiment 3 32
3.7.4 Experiment 3: Compute the errors 33
3.7.4.1 Angular Error 33
3.7.4.2 Euclidean Error 33
3.7.4.3 Root-Mean-Software Error 34
3.7.4.4 Procedures experiment 4 34
3.7.5 Correction by white balance 35
vi
4 RESULT
4.0 Introduction 37
4.1 Software result 37
4.2 Experiment and analysis 37
4.2.1 Experiment 1 – Determine the differences
between benchmark image (D65) with
other images under different lighting. 38
4.2.1.1 Result 38
4.2.1.2 Observation result 42
4.2.2 Experiment 2- Determine the colour
frequency and the colour range in colormap
and obtain the qualitative value (histogram) 42
4.2.2.1 Result 42
4.2.2.2 Observation result 48
4.2.3 Experiment 3- Compare the benchmark
histogram with other histogram under
different lighting fixture. 48
4.2.3.1 Result 48
4.2.3.2 Observation result 49
4.2.4 Experiment 4- Determine the qualitative
value by computing the three errors. 50
4.2.4.1 Result 50
4.2.4.2 Observation result 52
4.2.5 Experiment 5- Determine the correction
factor for images using white balance
correction. 52
4.2.5.1 Result 53
vii
5 DISCUSSION AND ANALYSIS OF RESULT
5.0 Discussion 58
5.1 Problem 59
5.2 Analysis of result 61
6 CONCLUSION AND RECOMMENDATION
6.1 Introduction 66
6.2 Conclusion 66
6.3 Recommendation 68
REFERENCES 69
viii LIST OF TABLES
TABLE TITLE PAGE
2.1 Processing result of ten images colour chip 7
2.2 Processing results of five couple images of similarly colour chip 7
2.3 The comparison table of methods 8
4.1 Fluorescent coating with different lighting illumination 39
4.2 Matte coating with different lighting illumination 40
4.3 Glossy coating with different lighting illumination 41
4.4 Colour Frequency and Colour Range for Red ball 43
4.5 Colour Frequency and Colour Range for Yellow ball 43
4.6 Colour Frequency and Colour Range for Green ball 44
4.7 Different between benchmark D65 and other lighting fixtures 49
4.8 Error between D65and spotlight 150W 50
4.9 Red image under different lighting is same after correction 53
4.10 Yellow image under different lighting is same after correction 54
4.11 Green image under different lighting is same after correction 55
4.12 Value of the comparison result after correction 56
ix LIST OF FIGURES
FIGURE TITLE PAGE
2.1 Different colour image in different illuminant 3
2.2 Colour Temperatures 4
2.3 Example image with different colour temperature 9
2.4 Incident Light 10
2.5 Diffuse Reflection 11
2.6 Specula Reflection 11
2.7 The L channel, which specifies of Luminant or Lightness 12
2.8 The a channel, which specifies the colour as either a Green or a Magenta hue
13
2.9 The b channel, which specifies the colour as either a Blue or a Yellow hue
13
2.10 RGB colour space 13
2.11 YCbCr colour space 14
2.12 DFK 72AUC02-F USB CMOS Color Autofocus Camera 5MP 15
3.1 Flow Chart of the Project 17
3.2 Writing Program using Matlab Software 19
3.3 Flow Diagram of the Project 20
3.4 Flow Chart experiments 2 31
3.5 Lighting affects image background 35
3.6 Flow Chart for White Balance 36
4.1 Result Overview 38
4.2 The histogram (based on luminant only) of different lighting compared to benchmark –red
45
4.3 The histogram (based on luminant only) of different lighting compareto benchmark –yellow
46
4.4 The histogram (based on luminant only) of different lighting compared to benchmark – green
47
4.5 Bar chart for comparison histogram 49
4.6 Line chart for angular error between D65and spotlight 150W 51
4.7 Line chart for Euclidean error between D65and spotlight 150W 51
4.8 Line chart for RMS error between D65and spotlight 150W 52
x LIST OF APPENDICED
APPENDIX TITLE PAGE
A Gantt Chart PSM1 71
B Gantt Chart PSM2 72
C K-chart Matlab Code 73
D Other histogram of various lighting 74
E Other errors under lighting fixtures 83
1 CHAPTER 1
INTRODUCTION
1.1Backgr ound
Colour of the object is perceptual and human depends on their vision to process what they
see and learn. It is also difficult to identify the actual colour of an object when it is exposed to
illumination, shadows, highlights, and background clutter on the objects [1]. The
inhomogeneous object is one of the factors that make the colour of an object difficult to be
identified; the reason being the surfaces are not linear. The analysis is more focused on the
effect of colour temperature when the object is situated under different lightings such as
indoor illumination, daylight, tungsten or fluorescent; which may cause the changes in the
colour of the object. The correction factor will be obtained to ensure the result of the image
colour after processing is almost similar with the colour of the benchmark image.
1.2Pr oblem Statement
Daylight, incandescent, warm white and fluorescent are various typical lighting fixtures
which are often used. These lighting fixtures will cause the colour of the image captured to be
different from the image’s actual colour. Different coating surfaces such as matte, glossy and
fluorescent which are painted on the inhomogeneous object may change the characteristic of
the reflection. Therefore, these lighting fixtures will produce uncertainness which will impede
2 1.3Objectives
• To analyze the effect of different white light illumination on coloured objects
• To obtain the generalization of various lighting fixtures on the object
• To obtain the correction factor of the inhomogeneous object colour captured by industrial digital camera with white light illuminants.
1.4Pr oject Scope
This project focuses on analysis of these factors:
• The objects are inhomogeneous with spherical shapes.
• Three different white light illuminants (Incandescent 60W and 250W, Spotlight, Warm White 20W) with the benchmark (Daylight D65) will be used for analysis.
• Objects are coated with three different type of coating material which is matte, glossy and florescent paints.
• The object colour will be in three colour of traffic light.
• Industrial digital camera is used.
This project however does not include:
• The measure of effectiveness of colour recognition.
• The analysis of surface roughness for inhomogeneous objects.
3 CHAPTER 2
LITERATURE REVIEW
2.1 Intr oduction
The object colour is categorized into uniform colour (single colour of object) and
multicolour (many colour in one object). Human has a different perceptual on the object
colour while the computer vision measures the image colour on this three aspects which are
surface roughness, illuminations and sensor characteristic. Of all the three aspects, the
illumination is closely related to this project. The illumination is divided into two categories
which are coloured illuminant and natural illuminant. The colour illuminant has more colour
such as red, green, yellow, blue, and white and so on so forth. The white colour itself
possesses variety of lighting fixtures which are daylight (D65), incandescent, warm white and
fluorescent (F). This incident white light may change the image of object as below:
In Daylight illuminant In Spotlight illuminant
(Green Fluorescent) (Green Fluorescent)
4 Therefore, this chapter will discuss about colour temperature, the effect on incident
light to inhomogeneous object, camera and will explain the methods and the persons who
created the solution for the effect of the illumination.
2.2 Colour Temper atur e
Colour temperature is a way to measure the quality of a light source. It is based on
ratio of the amount of blue light to the amount of red light. The unit for measuring this ratio is
in degree Kelvin (K). Colour temperature of lamp is very crucial to attune white light using
camera. The colour temperature is different under different lightings such as candle, indoor
tungsten, indoor florescent, outdoor sunlight, outdoor shade and north sky. The colour
temperature scale is shown in Figure 2.2.
Figure 2.2 Colour Temperatures [2]
A colour temperature may be obtained by using a colour histogram to represent the
colour compositions of an image. In this respect, Finlayson [3] claimed that the RB plane is
divided into a regular grid with small even intervals. The array of grid has 256x256 with fine
regular cells and the value of 256x256 is obtained as binary image. All cells are represented
by the filled squares. The array is set as ‘1’ and the other open square is set as ‘0’. Besides
5 original RGB values are normalized with maximal intensity over all pixels in image. As the
outcome, the pixel should be stable and making the normalization reliable.
Brian A.Wandell [4] considered the estimation of colour temperature of scene
illumination from a single image and acquire less than one illumination can be rendered for
viewing in an illumination with a different colour temperature. Bright image region contains
more information of illuminant compared to dark image region. The algorithms of illuminant
colour temperature are valid for many light source including sunlight, incandescent lamp and
fluorescent lamp.
After reviewing these two methods that were suggested by Finlayson [3] and Brian
A.Wandell [4], the method that are related and to be employed to this project is from Brian
A.Wandell [4] because this particular method used different colour temperature and the
algorithm is capable to any illuminations. Therefore, the light meter can be used to get the
colour temperature easily when the camera is placed on the right position.
2.3 Analysis on effect colour temper atur e
Robby Tan Towi [5] had figured out the method for testing his algorithm by using two
types of surface which are uniform colour surface and multicolour surface. The first step
begins with counting an intersection distribution before obtaining several peaks in which the
number depends on the number of illuminant colour. The point on this distribution needs to be
observed in three spaces which are inverse intensity chromaticity space, Hough space and
illumination chromaticity-count space in order to solve this uniform colour illumination. This
method should consider two aspects which are, cluster points that have the same direction in
inverse-intensity chromaticity space and finding all peaks of the Gaussian like distribution in
histogram (intersection count) space.
The result obtained by Robby Tan Towi [5] shows a real image of green object with
6 lamp and halogen lamp. Under these illuminations, white as references of image chromaticity
taken by the camera has chromaticity value of which, for the incandescent light; the value
is = 0 .5 03, = 0.29 8 = 0 .1 9 9 while for halogen lamp, the value is = 0 .3 71,
= 0.31 8 = 0.31 0.
Long Yonghong et al. [6] had found that the interface component distributed the
illuminant by estimating the spectral power distribution of the illuminant. Firstly, illumination
chromaticity needs to be estimated by intersection of two colour signal from two
inhomogeneous surfaces to get the illuminant spectral power distribution. Then the original
images are able to be recovered to the image with standard illuminant D65 using the
finite-dimensional model. Yonghong’s solution of estimating the scheme of illumination is based on
dichromatic reflection model exploits and finite-dimensional linear model [7] to achieve the
colour correction in the second stage of colour recovery. It gives a precise, clear and efficient
way to describe relation between illuminants, surface reflectance and reflected lights.
In view of the experiments, the steps for colour recovering start with estimating the
illuminant chromaticity by the intersection of two colour signal planes and afterward,
estimating the illuminant spectral distributions. After that, image was taken under chromatic
illuminant and CIE Standard Illuminant D65 is obtained in which the latter is regarded as the
standard images. The original images are transformed to the standard image with CIE
Standard Illuminant D65 and lastly the colour difference between original images is computed
and image is recovered.
The result [6] shown in table 2.1 which show the recovery result and colour difference
between original images and standard images as well as colour differences between recovered
image and standard images. From the table, the colour-biased appeared when images are
taken under chromaticity illuminant. After processed method, the images are much similar
with the standard images taken under standard illuminant D65 and it also has a colour
7 Table 2.1 Processing result of ten images colour chip
Then process the five couple image of colour chip and each couple of original images
is transformed to the standard image which shown in Table 2.2. From that table, the colour
difference of each couple of original is much different from those of standard images.
8 2.3.1 Compar ison table for the two methods
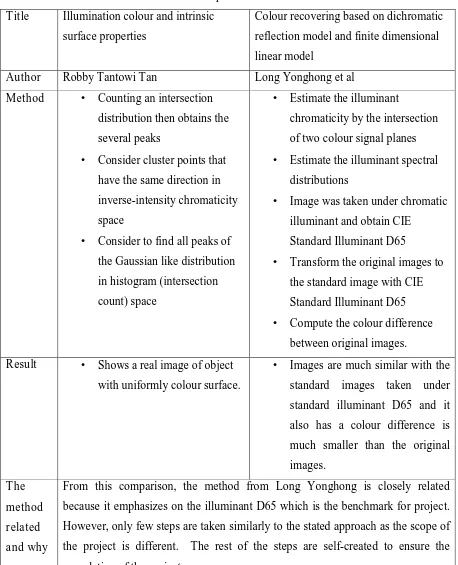
Table 2.3: The comparison table of methods
Title Illumination colour and intrinsic
surface properties
Colour recovering based on dichromatic
reflection model and finite dimensional
linear model
Author Robby Tantowi Tan Long Yonghong et al
Method • Counting an intersection
distribution then obtains the
several peaks
• Consider cluster points that have the same direction in
inverse-intensity chromaticity
space
• Consider to find all peaks of the Gaussian like distribution
in histogram (intersection
count) space
• Estimate the illuminant
chromaticity by the intersection
of two colour signal planes
• Estimate the illuminant spectral distributions
• Image was taken under chromatic
illuminant and obtain CIE
Standard Illuminant D65
• Transform the original images to the standard image with CIE
Standard Illuminant D65
• Compute the colour difference between original images.
Result • Shows a real image of object
with uniformly colour surface.
• Images are much similar with the
standard images taken under
standard illuminant D65 and it
also has a colour difference is
much smaller than the original
images.
The
method
r elated
and why
From this comparison, the method from Long Yonghong is closely related
because it emphasizes on the illuminant D65 which is the benchmark for project.
However, only few steps are taken similarly to the stated approach as the scope of
the project is different. The rest of the steps are self-created to ensure the
9
2.4 White Balance
White balance is a process whereby unrealistic colour cast is being removed. [7] When
the process is completed, the display image will have the same general appearance as the
colour in the original scene. Here, it must be noted that the colour of each pixel in an image
captured directly by digital camera does not solely depends on the object, but also the colour
temperature light of light source. When the object is illuminated under a low colour
temperature light source, the recorded image will appear to be reddish. On the other hand,
when the colour temperature of the light source is high, the object will appear to be bluish.
The figure shown below is best to describe the example of the colour image with different
colour temperature.
Figure 2.3: Example of image with different colour temperature [7]
Nowadays, there are a lot of algorithms that have been proposed by engineers for the
purpose of maintaining the colour consistency of image captured from an object under
different light sources [7]. Here, the emphasis and attention must be given to the methods of
choosing the reference pixel to estimate the illumination. The illumination estimation is one
issue that must be given due care and consideration due to numerous factors that control the
colour of the display image such as the object shape, illumination geometry, background
10 2.5 Effect on incident light to inhomogeneous object
Generally objects are of inhomogeneous materials. Hence, the reflection will appear
when an incident light is illuminated on these objects and materials. The standard dichromatic
reflection model which assumes the surface of inhomogeneous materials or objects when the
light is reflected is further decomposed into two preservative components. The independence
of wavelength is separated into two which are body refection and interface reflection.
Figure 2.4: Incident Light [8]
Yifan Chen [8] had acquired that the real incident light information is associated to a
basic light source and real incident light source which resulted in the buildup of level pixel
mapping. Obviously, the same direction of rays from actual light source will light up the same
point of the object when the actual light source is at the same position. The ray reflected from
11 Inhomogeneous object which has a linear combination of diffuse and specula reflection
component evidently shows that these two components need to be separated or decomposed.
Most inhomogeneous objects are made of acrylics and plastics which exhibited both diffuse
and secular reflections. The diffused reflection is due to varying refractive index in the bodies
and object surface, while the specula reflection is primarily due to the refractive index
difference between air and the object surface. If the presence of these indexes is very minor,
inhomogeneous object will ignore. Unlike diffuse reflection, the location of secular reflection
depends on viewing an illumination direction, causing its appearance to be consistent. On the
other hand, diffuse reflection is independent from viewing position and is only dependent on
illumination direction in terms of its intensity magnitude.
Figure 2.5: Diffuse Reflection [9]
Figure 2.6: Specula Reflection [9]
The characteristic of reflection of inhomogeneous object is depending on the
effectiveness of light position selection. Takashi Machida [3] had examined the cause of
considering interreflection in surface reflectance parameter estimation using object with
uniform and non-uniform surface properties. The image clearly shows that the specula
reflectance parameter and also illustrate the surface roughness parameter with grey scale
where the largest value is coded as white. This image defined shows that the smaller the value