SURFACE ROUGHNESS ANALYSIS VERSUS DEPTH OF
CUT IN CNC MILLING
CYRIL DONOVAN NICHOLAS
UNIVERSITI TEKNIKAL MALAYSIA MELAKA
SURFACE ROUGHNESS ANALYSIS VERSUS DEPTH OF CUT IN CNC
MILLING
This report submitted in accordance with requirement of the Universiti Teknikal Malaysia Melaka (UTeM) for the Bachelor Degree of Manufacturing Engineering
(Manufacturing Design) with Honours.
by
CYRIL DONOVAN NICHOLAS
UNIVERSITI TEKNIKAL MALAYSIA MELAKA
BORANG PENGESAHAN STATUS LAPORAN PROJEK SARJANA MUDA
TAJUK: Surface Roughness Analysis Versus Depth Of Cut In CNC Milling
SESI PENGAJIAN: 2009/10 Semester 2
Saya CYRIL DONOVAN NICHOLAS
mengaku membenarkan Laporan PSM ini disimpan di Perpustakaan Universiti Teknikal Malaysia Melaka (UTeM) dengan syarat-syarat kegunaan seperti berikut:
1. Laporan PSM adalah hak milik Universiti Teknikal Malaysia Melaka dan penulis. 2. Perpustakaan Universiti Teknikal Malaysia Melaka dibenarkan membuat salinan
untuk tujuan pengajian sahaja dengan izin penulis.
3. Perpustakaan dibenarkan membuat salinan laporan PSM ini sebagai bahan pertukaran antara institusi pengajian tinggi.
4. **Sila tandakan (√)
SULIT
TERHAD
TIDAK TERHAD
(Mengandungi maklumat yang berdarjah keselamatan atau kepentingan Malaysia yang termaktub di dalam AKTA RAHSIA RASMI 1972)
(Mengandungi maklumat TERHAD yang telah ditentukan oleh organisasi/badan di mana penyelidikan dijalankan)
Alamat Tetap:
No. 181 Tabuan Laru, Lorong 4A6
Jalan Kedandi, 93350
DECLARATION
I hereby, declare this report entitled “Surface Roughness Analysis Versus Depth of Cut in CNC Milling” is the results of my own research except as cited in references.
Signature : ……….
Author’s Name : CYRIL DONOVAN NICHOLAS
APPROVAL
This report is submitted to the Faculty of Manufacturing Engineering of UTeM as a partial fulfillment of the requirements for the degree of Bachelor of Manufacturing Engineering (Manufacturing Design) with Honours. The member of the supervisory committee is as follow:
i
ABSTRACT
ii
ABSTRAK
Laporan ini menumpu kepada kesan kedalaman pemotongan menggunakan mesin
iii
ACKNOWLEDGEMENT
iv
TABLE OF CONTENT
Abstract i
Abstrak ii
Acknowledgement iii
Table of Content iv
List of Tables vi
List of Figures vii
List of Abbreviations ix
1. INTRODUCTION 1
1.1 Background 1
1.2 Problem Statement 5
1.3 Research Objectives 5
1.4 Scope of Research 6
2. LITERATURE REVIEW 7
2.1 Surface Parameters 7
2.1.1 Height Parameters 8
2.1.2 Wavelength Parameters 9
2.2 Tool Wear and Tool Life Relationships 10 2.3 Equivalent Chip Thickness (ECT) 11
2.4 Taylor’s Tool Life Equation 11
2.5 Previous Studies 12 2.5.1 Surface Roughness Prediction 12 2.5.1.1 Artificial Neural Network (ANN) Overview 12 2.5.1.2 Genetic Algorithm (GA) Overview 13
2.5.1.3 Response Surface Methodology (RSM) Overview 16
2.5.2 Cutting Parameters Overview 16
v
3. METHODOLOGY 24
3.1 Experimental Material 24
3.1.1 End Mill Tool 24
3.1.2 Work Material 26
3.2 Experimental Apparatus 28
3.2.1 HAAS CNC Mill 28
3.2.2 Surface Roughness Tester 31
3.3 Experimental Procedure 34
3.3.1 XRD Analysis 34
3.3.1.1 XRD Analysis Procedure 35
3.3.2 Control Factor s 37
3.3.3 Design and Simulation of G-CODE 38
3.3.4 Milling Process Using HAAS CNC Milling Machine 40
3.4 Roughness Measurement Method 42
3.5 Methodology Flow Chart 44
4. RESULTS AND DISCUSSION 45
5. CONCLUSION AND RECOMMENDATIONS 76
5.1 Conclusion 76
5.2 Recommendations 78
REFERENCES 80
vi
LIST OF TABLES
1. Surface Roughness (Ra) Produced By Common Production Methods (ANSI B46.1-1962, R1971)
4
2.1 Training Data Set adapted from Hayajneh et al. (2009) 17 2.2
2.3
Testing Data Set for Cutting Parameters adapted from Hayajneh et al.(2009)
Multiple Regression Model (α=0.05) adapted from Hayajneh et al.( 2009)
18
18
3.1 Specifications of IPG 4 Flute TiALN Coated Carbide End Mill 25
3.2 Chemical Analysis of Alloy 6061 27
3.3 Mechanical Properties for Alloy 6061 27
3.4 Lists of comparative characteristic of alloys 28 3.5a Travels, Table, T-slots and Spindle for HAAS CNC 3-axis
mini mill
29
3.5b Motor, Feed Rate, Tool Changer, Accuracy and General Specifications for HAAS CNC Mini Mill
30
PSM Process Planning Gantt Chart
Position [2° Theta] Height Count
Score Rating for Different Compounds in Al 6061-T6511 Mean Arithmetic Roughness for DOC 0.5mm
Mean Arithmetic Roughness for DOC 1.0mm Mean Arithmetic Roughness for DOC 1.5mm Mean Arithmetic Roughness for DOC 2.0mm
45
Mean Arithmetic Roughness for DOC 2.5mm Mean Arithmetic Roughness for DOC 3.0mm
Horsepower and Tangential Force at Varying Depth of Cut
vii
LIST OF FIGURES
1
2.1
Illustration of surface texture
Ra = Average Absolute Deviation of Profile y(x) from the Mean
Line = Total Shaded Area (L)
2
8
2.2 Surface Profile showing the ISO Definition for the Peak Spacing Parameter Sm
9
2.3 Flank Wear (mm) vs Cutting Time (min) for Four Different Conditions
10
2.4 Mutation and Crossover Genetic Operators 14
2.5 Compensated Surface (Perpendicularly) using Genetic Algorithm
15
2.6 2.7
2.8
Effect of Tool Feed on Surface Roughness
Comparison between surface roughness (µm) in AISI 1020 and AISI 1040 under similar cutting parameters
The effects of spindle speeds (r/min) on surface roughness (µm)
20 21
22
3.1 Picture IPG TiALN Coated 4 Flute Short Carbide End Mill 25
3.2 Schematic of HAAS 3-axis CNC Mini Mill 31
3.3 Schematic Diagram of Surface Roughness Tester Instrument 32 3.4
Effects of Various Cutoff Values from ANSI B46.1-1985 XRD Analysis 6061-T6511 alloy specimen
G-CODE simulation Illustrating Machining Profile Measurement Segmentation of Machining Profile
Graph of Height Counts vs Angle at room temperature Elements Found in Diffraction Positions
Graph of Average Mean Arithmetic Roughness Indicating Roughness Trend of 0.5mm DOC
Ra values for Specific Machining Time for DOC = 0.5mm
Average Mean Arithmetic of 1.0mm DOC Roughness Trend
viii
Graphic Representation of Exponential Increase in Ra Due To Tool Failure
Average Mean Arithmetic Roughness, Ra of DOC 1.5mm
Graph of Ra vs Machining Time for DOC 1.5mm
Average Mean Arithmetic Roughness, Ra of DOC 2.0mm
Graph of Ra vs Machining Time for DOC 2.0mm
Effects of Critical Tool Failure on Mean Arithmetic Roughness,
Ra
Average Mean Arithmetic Roughness, Ra of DOC 2.5mm
Graph of Ra vs Machining Time for DOC 2.5mm
Average Mean Arithmetic Roughness, Ra of DOC 3.0mm
Graph of Ra vs Machining Time for DOC 3.0mm
Graph of DOC (mm) versus Horsepower (hp) Required at Spindle for DOC 0.5 – 3.0mm
Graph of DOC (mm) versus Tangential Forces (lbs) for DOC of 0.5 – 3.0mm
Bar Chart illustration of the DOC, Horsepower and Tangential Force Relationship.
ix
ANSI - American National Standard Institute ASME - American Society of Mechanical Engineers Bhn - Brinell Hardness Number
ISO - International Standard Organization JIS - Japanese International Standard
kV - Kilo-volt
mA - Milli-ampere
Manganese - Manganese
Mg - Magnesium
x
Mm - Millimeter
MPa - Mega Pascal
MRR - Material Removal Rate
N - Newton
Nf - Number of Flutes
PSM - Projek Sarjana Muda
Ra - Arithmetic Mean Value / Arithmetical Mean Deviation Revs/min - Revolutions Per Minute
RPM - Revolutions Per Minute
Rq - Root Mean Square
RSM - Response Surface Methodology SEM - Scanning Electron Microscopy Sfpm / spm - surface feet per minute
Si - Silicone
Sm - Mean Peak Spacing
TiALN - Titanium Aluminium Nitrate TiC - Titanium Carbide
TiN - Titanium Nitrate
Vc - Cutting Speed
1
CHAPTER 1
INTRODUCTION
Surface roughness plays an important part in the functional performance of many engineering components. To illustrate the impact of this criterion, surface roughness or texture quality plays a vital role in the corrosion rate of materials, residual stress, heat resistance, friction capabilities, surface reflectability as well as aesthetic value. In addition, surface roughness is often used as the fingerprint of the process used in the production which therefore correlates to both dependent and independent variables in the machining process. Using the correlation between the machining parameters and the surface roughness, the machining parameters could well be adjusted to meet the desired surface finish.
1.1 Background
2
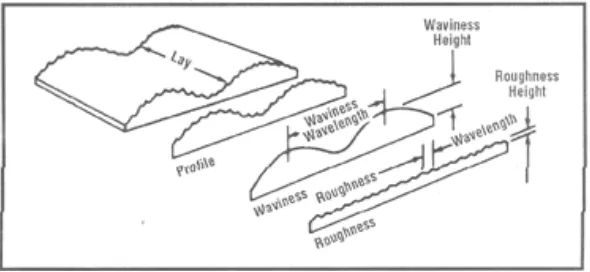
the cutting parameters, cutting tool geometry, tool properties, environmental conditions, chip formations, heat distribution, mechanical and chemical properties of the work material. Whitehouse (1994) stated that solid surfaces, irrespective of their method of formation (casting, hot forming, drawing, etc…) contains irregularities or deviations from the prescribed geometrical form. The surfaces contain irregularities of various orders ranging from shape deviations to irregularities of the order of inter atomic distances. No machining method, however precise, can produce a molecularly flat surface on conventional materials as clarified by Whitehouse (1994). Surface finish as described in the ASME International Handbook Vol. 16 (1999) is concerned with only the geometric irregularities of surfaces of solid materials and the characteristics of instruments for measuring roughness. Surface texture is defined in terms of roughness, waviness, lay and flaws as illustrated in Figure 1:
Surface roughness consists of fine irregularities in the surface texture, usually including those resulting from inherent action of the production process such as feed marks produced during machining as stated by Whitehouse (1994).
ASME Vol. 16 (1999) defines waviness is a more widely spaced component of surface texture and may result from such factors as machine or work deflections, vibration or chatter.
Lay is the direction of the predominant surface pattern.
Flaws are unintentional, unexpected and unwanted interruptions in the surface – for example cracks, nicks, scratches and ridges.
3
The specification of unimpaired or enhanced surfaces require an understanding of the interrelationship among metallurgy, machinability, and mechanical testing. To point out here that the main purpose of this study is to distinguish the effects of increasing depth of cut on the quality of the surface finish. According to the ASME Vol. 16 (1999) to satisfy such requirement, an encompassing discipline known as surface integrity was introduced, and it has since gained worldwide acceptance. Surface integrity technology describes and controls the many possible alterations produced in a surface layer during manufacture, including their effects on material properties and the performance of the surface in service. Simplified, surface integrity technology is a discipline of the study of various metallurgical, characteristic and machining parameters and its effects on surface quality. Surface integrity is achieved by the selection and control of manufacturing processes, estimating their effects on the significant engineering properties of work materials, ASME Vol. 16 (1999). Surface integrity involves the study and control of both surface roughness or surface topography, and surface metallurgy. Surface roughness is closely tied to the accuracy or tolerance of a machine component as shown in Table 1 below. According to Table 1 adapted from ANSI B46.1-1962, milling would most likely produce Ra values of between 0.2 – 25µm in which the most permissible and applicable values are between 0.8 – 6.3µm. However, this figure is merely a summation or estimation of the Ra values obtained through milling as milling as we know, has many facets to it. A close-tolerance dimension requires a very fine finish, and the finishing of a component to a very low roughness value may require multiple machining operations. For example when dynamic loading is a principal factor in a design, useful strength is frequently limited by the fatigue characteristics of materials. Fatigue failure and stress points almost always nucleate or permeate at or near the surface of a component; similarly stress corrosion, a structural phenomenon, is also likely to occur. Therefore, the nature of surface from a metallurgical point of view is important in the design and manufacture of critical parts or hardware.
4
applications include alloy steels with the hardness of 50 to over 600 HRC and heat-treated alloys with strength levels as high as 2070 MPa (300 ksi). Additional materials include stainless steels, titanium alloys, and high-temperature and corrosion-resistant applications.
Unfortunately, according to the ASME Vol. 18 (1998) the alloys for high-strength applications are frequently difficult to machine. The hard steels and high-temperature alloys for example, must be turned or milled at low speeds, which tend to produce built-up edge and poor surface finish. The machining of these alloys tends to produce undesirable metallurgical surface altercations, which have been found to reduce fatigue strength. However workpiece material composition and chemical properties of this research will be discussed further in chapter 3.
Table 1: Surface Roughness (Ra) Produced by Common Production Methods (adapted from ANSI
5
To conclude, this study focuses on the effect of depth of cut (DOC) on the surface roughness quality and as an added advantage to study the effects of tool wear in an effort to understand the needs in optimization of surface integrity.
1.2 Problem Statements
In metal cutting operations, one of the most important aspects is the process of establishing operating conditions such as depth of cut, feed rate, and surface speed. Operating conditions control tool life, productivity, and manufacturing cost. Take for example, if operating conditions are changed to increase the material removal rate (MRR), machining time is reduced at the cost of tool life which decreases as well as the quality of the surface roughness. To address this matter further, a few issues are identified that would underline the foundation of this research such as:
i. Nature of the correlation between surface roughness and the level of dependency on depth on cut – adversely or in adverse.
ii. The permissible tangential forces exerted by the DOC under pre-determined cutting conditions to obtain surface finish within the ANSI B46.1-1962 standards.
iii. Cutting profiles and the effects on surface finish – if any.
iv. Overall relationship between depth of cut, cutting horsepower, tangential forces, and Ra.
To point out, the above statements provide a niche or a trend in directing this study by providing a guideline in drawing out the objectives of this research.
1.3 Research Objectives
6
upon which will be quantified into surface roughness measurement parameters or more accurately the arithmetical mean deviation (Ra). Furthermore, the impact of depth of cut will also be catalogued in the tool wear as well as chip morphology to corroborate the impact of these factors on overall surface integrity. Variations in cutting profiles ideally will also be studied. In a summary, objectives of this research are:
i. To isolate and study the depth of cut as a separate entity and its tribological impact on surface roughness using CNC milling.
ii. To determine correlations between tool wear and depth of cut, as well as the effect of tool wear on overall surface texture.
iii. Formulation of material removal rate, MRR based on the variations in depths of cut to determine correlation to surface roughness.
iv. Design and execution of an experiment setup to meet the abovementioned objectives.
1.4 Scope of Research
7
CHAPTER 2
LITERATURE REVIEW
The term “surface texture” refers to the fine irregularities (peaks and valleys) produced on a surface by a forming or material removal process. By convention, the texture comprises of two components: roughness and waviness. Avallone et al. (1997) stated that roughness consists of the finer irregularities characteristic of the process itself such as the teeth spacing in a milling cutter or the feed of a single-point tool. Waviness on the other hand, according to Whitehouse (1994) consists of the more widely spaced irregularities that are often produced by vibration in the machining process. Yet the ASME Handbook Vol. 18 (1998) defines the terms “surface texture” and “roughness” are used interchangeably, because roughness is specified and measured more often than waviness.
At this point the need arises to conjugate past literatures to the current study. However to fully understand what is being studied in this research, the surface parameters used in this study would first need to be highlighted.
2.1 Surface Parameters
8
roughness as height parameters is sufficient enough in measuring roughness as clarified by Bhushan (2001).
2.1.1 Height Parameters
The most common statistical descriptors of surface height are the roughness average or the arithmetic mean average, Ra, and the Root Mean Square (RMS) roughness, Rq. These
are closely related and are given by the following formulas, as shown in Bhushan (2001) in integral and digitized form:
(Eq. 1)
(Eq. 2)
where y(x) is the surface profile, sampled by the N set points over yi over the length, L,
as shown in Figure 2.1. The parameters Ra and Rq are useful estimators of the average
heights and depths of surface profiles. The RMS roughness is commonly specified for the surfaces of optical components. In Drozda and Wick (1983), the lower RMS roughness of an optical component, the less stray scattered light and thus the higher the quality of the component.
9
Roughness average (Ra)is used in the automotive and other metalworking industries to
specify the surface finish of many types of components, ranging from cylinder bores to brake drums. In addition to these two averaging height parameters, an assortment of other height parameters has been defined for various applications, including several for characterizing peak-to-valley height according to Bhushan (1999).
2.1.2 Wavelength Parameters
Wavelength parameters are used to characterize the spacings of the peaks and valleys of the surface. The spacings or wavelength are often characteristic of the process that forms the surface, such as the grit size of a grinding wheel, or the feed of a tool. A typical wavelength parameter, as recognized as standard by the International Organization for Standardization (ISO) in Figure 2.2, is the mean peak spacing Sm, defined for a surface
profile, as the average spacing between two successive negative crossings of the mean line given in the equation below:
(Eq. 3)