UNIVERSITI TEKNIKAL MALAYSIA MELAKA
LABOR UTILIZATION AND MAN TO MACHINE RATIO AT A
SEMICONDUCTOR FACILITY
This report submitted in accordance with requirement of the Universiti Teknikal
Malaysia Melaka (UTeM) for the Bachelor Degree of Manufacturing Engineering
(Manufacturing Management) with Honours.
by
AIDA BAHIYAH BT MOHD RODZI
oval
UNIVERSITI TEKNIKAL MALAYSIA MELAKA
BORANG PENGESAHAN STATUS LAPORAN PROJEK SARJANA MUDA
TAJUK: LABOR UTILIZATION AND MAN TO MACHINE RATIO AT A SEMICONDUCTOR
FACILITY
SESI PENGAJIAN: 2008/2009
Saya AIDA BAHIYAH BT MOHD RODZI
mengaku membenarkan Laporan PSM ini disimpan di Perpustakaan Universiti Teknikal Malaysia Melaka (UTeM) dengan syarat-syarat kegunaan seperti berikut: 1. Laporan PSM adalah hak milik Universiti Teknikal Malaysia Melaka dan penulis. 2. Perpustakaan Universiti Teknikal Malaysia Melaka dibenarkan membuat salinan
untuk tujuan pengajian sahaja dengan izin penulis.
3. Perpustakaan dibenarkan membuat salinan laporan PSM ini sebagai bahan pertukaran antara institusi pengajian tinggi. atau kepentingan Malaysia yang termaktub di dalam AKTA RAHSIA RASMI 1972)
** Jika Laporan PSM ini SULIT atau TERHAD, sila lampirkan surat daripada pihak berkuasa/organisasi berkenaan dengan menyatakan sekali sebab dan tempoh tesis ini perlu dikelaskan sebagai SULIT atau TERHAD.
iii
DECLARATION
I hereby, declared this report entitled “Labor Utilization and Man to Machine Ratio at a Semiconductor Facility.” is the result of my own research except as cited in references.
Signature : ……….
Author‟s Name : Aida Bahiyah Bt Mohd Rodzi
iv
APPROVAL
This report is submitted to the Faculty of Manufacturing Engineering of UTeM as a partial fulfillment of the requirement for the Degree of Bachelor of Manufacturing Engineering (Manufacturing Management) with Honours. The member of the supervisory committee is as follow:
……….
Rohana Bt Abdullah Lecturer
v
ABSTRACT
vi
ABSTRAK
Produktiviti adalah elemen utama di dalam industri pembuatan. Terdapat pelbagai alternatif untuk meningkatkan produktiviti. Secara am nya, kajian ini adalah mengenai penggunaan pekerja dan nisbah mesin kepada pekerja dengan menggunakan kaedah MOST (Maynard Operation Sequence Technique). Di dalam kajian ini, kaedah yang digunakan adalah kaedah pengiraan kerja (work measurement). Terdapat tiga cara yang boleh digunakan iaitu kajian masa kerja (work study), kajian contoh kerja (work sampling) dan system penetapan masa (Predetermined Time System, PTS). Kajian ini memberi focus terhadap pergerakan pekerja dan dengan ini, kaedah MOST digunakan untuk menjalankan kajian masa dan pergerakan (motion and time study). Kajian ini dijalankan di sebuah syarikat Multinational yang menghasilkan cip elektronik (semiconductor). Kajian ini memberi penekanan terhadap aktiviti yang dijalankan oleh pekerja, disamping mendapatkan kadar penggunaan operator dan mencadangkan nisbah pekerja dan mesin yang ideal. Daripada kajian ini, waktu keseluruhan dan kadar pengeluaran harian akan didapatkan, disamping kadar penggunaan pekerja semasa. Nisbah mesin kepada pekerja ideal akan dicadangkan sebagai hasil kajian, sebagai langkah untuk meningkatkan produktiviti. Kesimpulannya, peningkatan ini boleh dibuat melalui kaedah seperti yang dinyatakan dan boleh member manfaat kepada pelajar dan juga syarikat.
vii
DEDICATION
For my beloved parents:
Mr. Mohd Rodzi B. Ismail Mrs Hamisah Bt Ahmad
For my supportive siblings
Mohd Haniff B. Mohd Rodzi Amni Bahirah Bt Mohd Rodzi
viii
ACKNOWLEDGEMENT
First and foremost, I would like to thank my parents and family for the endless encouragement and undying support for me to complete this report. They have been my inspiration to bring out the best of me in completing this study.
Special thanks to my supervisor, Puan Rohana bt. Abdullah for her continuous supervision and constant advice, support, guidance and encouragement from the beginning towards the end of the study. Special thanks to my panel as well, En Nik Mohd Farid b. Che Zainal Abidin for his advices and ideas.
I also would like to thank all PSM Committee members and also lecturers as well as FKP staffs for their help throughout this study.
Gratitude is also extended to employees of Texas Instruments (M) Sdn. Bhd, especially Mr. Tay Bok Yam and Mr. Alex Ting for their cooperation and also for giving me the opportunity to conduct this study.
ix
1.1.1 Current issue in productivity 3
1.2 Problem statement 5
2.2.2 Operation standardization 14
x
2.2.3.1 Types of Charts 17
2.3 Motion and time study for lean manufacturing 21
2.4 Work measurement 24
2.4.6 Predetermined time system (PTS) 31
2.5 Maynard Operation Sequence Techniques (MOST) 33 2.6 Current study on work method and work measurement 36
2.6.1 Case study 1: Intel Technology Sdn. Bhd. 36
2.6.2 Case study 2: North Carolina State College Dairy Plant 37
2.6.3 Case study 3: York Casket 38
3.3 Research flow chart explanation 54
3.3.1 Define project title and search for project source 54
3.3.2 Factory search 54
3.4 Data collection flow chart 57
xi
3.5.1 Area selection 58
3.5.2 Operator and machine selection 58
3.5.3 Data collection for each operator 58
3.5.4 MOST analysis 60
3.5.5 Determine current operator utilization 61
3.5.6 Recommendation for improvements 62
4. CASE STUDY
5.2.2 Activity summary in descending order 77
5.3 MOST result for STI 13 and 14 78
5.3.1 Activity summary 79
5.3.2 Activity summary in descending order 80
5.4 MOST analysis 81
5.5 Allowance 83
5.6 Frequency ratio 84
5.7 Overall Equipment Efficiency (OEE) 85
xii
6. RECOMENDATIONS AND CONCLUSION
6.1.1 Performing work study on operator‟s activity 90
6.1 Summary 90
6.1.2 Standard time establishment 91
6.1.3 Determine the current operator‟s utilization 91 6.2 Recommendations to achieve ideal man to machine ratio 94
6.2.1 Elimination of Non Value Added activities. 94
6.2.1.1 Preparing end plug 95
6.2.1.2 Run 2 95
6.2.1.3 Improvements after eliminating „preparing end plug‟ and „run 2‟ 96 6.2.2 Standard Operation Procedure (SOP) for new operators 96
6.2.3 Increase man to machine ratio 98
6.3 Conclusion 101
REFERENCES 103
APPENDICES
A MOST Data Card General Move B MOST Data Card Controlled Move C MOST Data Card Tool Move
xiii
LIST OF TABLES
2.1 Symbol used for process charting 15
2.2 Types of process charts 16
2.3 Operation Charts 16
2.4 Performance Rating Table 25
2.5 Comparison on Average Actual Times and Times 33 Determined from Predetermined Time Data
3.1 Gantt Chart for PSM I 51
3.2 Data collection table 59
3.3 MOST table for data computation 61
5.1 MOST table description 72
5.2 Overall activity summary for STI 1 and 2 74
5.3 Activity task for starting lot preparation 75
5.4 Overall activity summary for STI 13 and 14 79
5.5 The OEE calculation for STI 1, 2, 13 and 14 85
5.6 The comparison between MOST analysis and overall
calculation for operator‟s utilization for STI 1 and 2 87 5.7 The comparison between MOST analysis and overall
calculation for operator‟s utilization for STI 13 and 14 89
6.1 Comparison between the time taken to complete same task
by different operator 92
6.2 Comparison between % of MTM before and after
eliminating Non-value added activities 96
6.3 Suggested SOP for new operators 96
6.4 MOST for STI 1 and 2 (revised and proposed) 100
xiv
LIST OF FIGURES
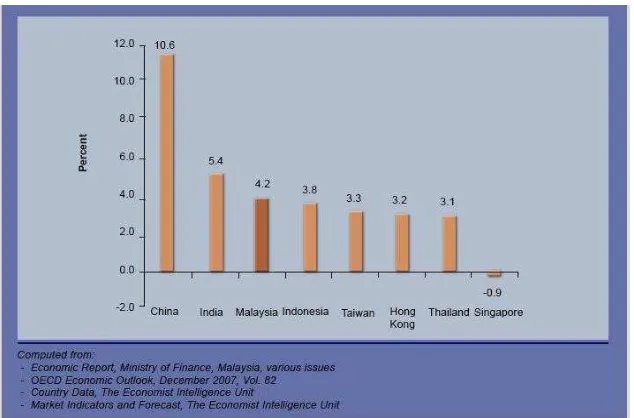
1.1 Productivity Growth, Malaysia and Selected 4
OECD Countries, 2007
1.2 Productivity Growth, Malaysia and Selected 4
Asian Countries, 2007
2.1 Example of Flow Process Chart in manufacturing 17
a product
2.2 Example of Process Flow Chart in manufacturing 18
a product
2.3 Example of Assembly Process Chart 19
2.4 Example of Operation Chart: Simo Chart 20
2.5 Work measurement method 23
2.6 Example of Personal and Fatigue allowance used by 27 a company
2.7 Example of time study sheet 29
3.1 Research flow chart 53
3.2 Data collection flow chart 57
4.1 Layout of EOL of QFN department 66
4.2 Flow Chart of assembly process in QFN 67
5.1 MOST table 71
5.2 MOST table for STI 1 and 2 73
5.3 MOST table for STI 13 and 14 78
xv
ICT - Information and Communication Technology ILO - International Labor Organization
IMVP - International Major Vehicle Program MNC - Multinational Company
MOST - Maynard Operation Sequence Technique
MS - Machine Specialist
PTS - Predetermined Time System QFN - Quad Flat No Lead
SMI - Small and Medium Industry SOP - Standard Operation Procedure
TI - Texas Instruments Inc
TIM - Texas Instruments Malaysia TMU - Time Measurement Unit TPS - Toyota Production System
xvi US - United States of America
VM - Visual Mechanical
1
CHAPTER 1
INTRODUCTION
This chapter explains the background of this research, objectives, scope, problem statements as well as the limitations in completing this research. The basic fundamental of productivity as a whole, as well as lean manufacturing will be discussed in the background of study. Current issues in productivity will be highlighted to support the background. Comparisons are made between developed and developing countries based on the current economic review. This research is mainly about labor utilization and the impact of labor productivity in a manufacturing sector.
1.1 Background of Study
2
Productivity may be conceived of as a measure of the technical or engineering efficiency in production. As such quantitative measures of input, and sometimes output, are emphasized. Productivity is distinct from measures of efficiency which take into account both the value of what is produced and the cost of inputs used, and also distinct from measures of profitability, which address the difference between the revenues obtained from output and the expense associated with consumption of inputs. High productivity results greater numbers of output with minimal cost, labor, resources as well as capital.
Lean production falls under the big concept of productivity as optimal way of producing goods through the removal of waste and implementing flow, as opposed to batch and queue. The implementation of smooth flow exposes quality problems which already existed and thus waste reduction naturally happens as a consequence. The elimination of waste is the goal of Lean, and Toyota defined three types of waste: mura, muri and muda (Meyers and Stewart, 2002). Shigeo Shingo observed that only the last turn of a bolt tightens it—the rest is just movement. This ever finer clarification of waste is the key to establishing distinctions between value-adding activity, waste and non-value-adding work. Non-value adding work is waste that must be done under the present work conditions. Motion and time study has finally found a home in the modern plant by helping in understanding the nature and true cost of work, assisting management in reducing unnecessary cost and balancing work cells to make work flow more smoothly.
Multinational Company (MNC) is a corporation that manages production establishment or deliver services in at least 2 countries. Multinational Corporation has a great influence on international relations, local economics and also globalization. International relations are enhanced by the relationship with the government and people from different countries.
3
ideal operator utilization rate and man to machine ratio can be proposed to improve the productivity of the identified process.
1.1.1 Current issue in productivity
Productivity improvement refers to the increase in output per work-hour or time expended. The United States has long enjoyed the world‘s highest productivity. Over the last 100 years, productivity in the United States has increased approximately 4 percent per year. However, in the last decade, the U.S rate of productivity improvement has been exceeded by that of Japan, Korea and Germany, and it has been challenged by Italy, acceleration in productivity growth (2% in 2006 compared to 1.3% in 2005) even though most of its economic recovery is likely to be cyclical. External factors in the form of improved export performance account for a substantial part of Germany's productivity revival while the domestic sector, particular consumer expenditure, still remains weak. Nordic countries, in particular Finland (3.7%) and Sweden (2.8%), showed productivity growth well above the European average. In contrast, the productivity record of most Mediterranean countries, particularly Italy, Portugal and Spain, remains consistently weak at 0.1%, 0.3% and -0.5% respectively (The Conference Board, 2007).
4
investment response to infrastructure investments and other reforms measures and continued strong demand for commodity products. Last year, the productivity growth of Malaysia at 4.2% surpassed many of the Organization of Economic Cooperation and
Development (OECD) countries, as well as Asian countries (Productivity Report, 2007).
Figure 1.1: Productivity Growth, Malaysia and Selected OECD Countries, 2007
(Productivity Report, 2007)
Figure 1.2: Productivity Growth, Malaysia and Selected Asian Countries, 2007
5
Looking from 2 years performance, the productivity of US, Europe, Germany, as well as Malaysia has improved in the first quarter of year 2008. Manufacturing productivity growth in United States was slower in the first quarter of 2008 than reported on May 7 as output was revised down by more than hours. Output and hours in manufacturing, which includes about 12 percent of U.S. business-sector employment, tend to vary more from quarter to quarter than data for the aggregate business and nonfarm business sectors (U.S Department of Labor, 2007). The Malaysian economy is expected to expand faster in 2008, with real gross domestic product (GDP) growth projected at between 6% and 6.5%. Inflation is projected to remain low, as output growth is below potential level. Furthermore, global inflation is also seen cushioned by a weaker US dollar, higher productivity growth and proactive measures taken by major economies to curb inflationary pressures. The manufacturing sector, a long-time engine of growth, is projected to expand 3.8%, compared with 3.1% in 2007 (Malaysia Economic Update, 2007).
Today, most U.S business and industries are, by necessity, restructuring themselves by downsizing, in order to operate more effectively in an increasingly competitive world. With more intensity than ever before, they are addressing cost reduction and quality improvement through productivity improvement. Actions were taken as an early step to prevent economic crisis caused by manufacturing sectors as most countries has listed manufacturing as the main contribution to the economic status.
1.2 Problem statement
6
enhance their competitiveness in the market due to the increased in efficiency and improved productivity. There are some issues based on observations that lead to this report writing. It is found that some tasks performed by operators are unnecessary and repetitive. The unnecessary tasks effect the cycle time and daily production rate of the department. Moreover, some operators experienced muscle fatigue due to long-hour standing position. Elimination of unnecessary movements or activities will automatically improve the productivity of the company. The cycle time and average time output rate is important to be used as a counter measure.
1.3 Objectives of study
The motion and time study needed to be conducted precisely and accurately to get the ideal labor utilization and at the same time, contribute to the increase of productivity. The purpose to research and produce a report about the times study and work measurement is to:
i. Observe the sequence of tasks performed by operators ii. Perform work study on operators activities
iii. Determine the current utilization of the operator iv. Propose the ideal man to machine ratio
1.4 Scope
7
outcome of this research will explain the ideal man to machine ratio as well. However, on the other hand, this research will not cover the labor utilization and man to machine ratio at mold, deflash, laser and saw process.
1.5 Importance of study
There are many benefits from the problem statement that leads to the productivity improvement in the company. The importances of this study are
i. Determine cycle time and output rate daily ii. Establish current operator‘s utilization
iii. Determine and recommend ideal man to machine ratio
1.6 Research methodology reviewed immediately on completion of each interview. The data analysis will be done using appropriate work measurement methods and tools in order to obtain the desired result.
8
itself (details of current situation is the company) and also work measurement and time study books. As for the secondary sources, it is obtained from journals, articles, reports as well as from electronic media publications. Case studies on related topics will also be included in the literature review. 2nd factory visit will be performed (PSM II) for observation and data collection. From the data obtained, analysis using MOST will be carried out to get the current operator utilization. The result will be presented, along with recommendation for ideal operator utilization and man to machine ratio.
1.7 Outline of report
As for PSM 1, this report will be segmented into four chapters. The first chapter is the introduction of the report. It generally discusses about the background of study, problem statement, scope, objectives as well as the limitation of the study, importance of study, and research methodology.
Chapter two is the literature review which will be done based on journals, books, internet resources and previous studies done on the related topics. Based on information gathered, this chapter will discuss the definition of work study and work measurement, its importance and its implementation in the industry.