Copyright@ EM International ISSN 0971–765X
*Corresponding author’s email : [email protected]; [email protected]; [email protected]; [email protected]; [email protected]
1Lecturer at Faculty of Engineering, 2 Professor, (3) Professor, (4) Lecturer, (5) Lecturer
Model of trees appraisal using an International
shading tree evaluation method at the Ciliwung
Riparian area
Budi Susetyo1, Hadi Susilo Arifin2, Machfud3, Widiatmaka4 and Nurhayati HS. Arifin5
1Bogor Ibn Khaldun University, West Java, Indonesia
2Department of Landscape Architecture (ARL), Faperta-Bogor Agricultural University,
West Java, Indonesia
3Department of Agriculture Industrial Technology (TIN) Fateta- Bogor Agricultural University,
West Java, Indonesia
4Department of Soil Sciences & Land Resources (ITSL) Faperta-Bogor Agricultural University,
West Java, Indonesia
5Department of Landscape Architecture (ARL), Faperta-Bogor Agricultural University,
West Java, Indonesia
ABSTRACT
Riparian zones are globally dominated by illegal settlements leading to reduced green open space area (GOS) and negative ecological impacts. Several tree appraisal method were implemented in many research in the world, such as ISA formula-Texas, CTLA-USA, Burnley-Australia, Helliwell-UK, STEM-New Zealand and Norma Granada-Spain. Commonly, the methods consider the basic value, species of tree, condition and location aspect of the tree. The main objective of this research is to evaluate trees value around the Ciliwung riparian. The current research is a case study of the Ciliwung riparian area of Bogor City, Indonesia. Tree appraisal method in this research is using ISTEM (International Shading Tree Evaluation Method), as the modification of ISA formula. The total researched area was approximately 303.84 ha, which consisted of a buffer area of 200 meters on either side of the river up to a distance of 15.19 km from the Ciliwung River, limited to Bogor City. The land cover consisted of a settlement area of 58% and a GOS area of 42%. Potential trees were evaluated using the standard sampling plot method with three repetitions of each type of structure (i.e. rare, moderate and dense areas) depending on the density of building (settlement) and density of standing trees (GOS). The percentage of standing trees area in the settlement were; rare area 12% of total settlement area, moderate area 17%, and dense area 30%, while in the GOS the values were rare area 8% of total GOS area, moderate area 16%, and dense area 8%. Total tree values for 2014 were calculated to be US $ 16.791.234. Current dynamic model was designed to estimate the projected trees value until the year 2030. Three scenarios developed resulted in trees yield value of U.S. $ 64,706,109 (optimistic); U.S. $ 78,556,923 (moderate), and U.S. $ 93,623,117 (pessimistic). The finding of research is implementation of trees appraisal model using ISTEM to predict the potential trees value in the river riparian through the urban area in Indonesia. Hence the model should serve as a tool for new regulations formulation of riparian management.
Introduction
The riparian area is a very large conservation area, but it has the specific problem of growing illegal settlements, especially across the city. Hence, there is an urgency to balance the growing human settle-ments with provision of basic facilities, and creating green open space areas to control the city‘s ecology for increased environmental quality,1 since built up areas have caused significant ecological damage (Widigdo and Hartono, 2009). Changes in the land-scape, caused by change in land use, can be related to certain aspects such as structure, function and landscape dynamics (Arifin et al., 2009). Structural change is related to the changes in the land cover type; the functional aspect can be associated with changes in the role of individual land cover area, and land cover dynamics is related to wildlife and anthropogenic activities in the riparian area. The current research area, including the Ciliwung ripar-ian area is limited to Bogor city which is approxi-mately 303.84 ha. The main concern is the anthropo-genic encroachment on the land cover area and the population of about 2269 families (10.345 inhabit-ants). The illegal settlements have resulted in changes in land use and landscape dynamics which, in turn, lead to unsustainability, endangering the functionality of conservation and environmental governance in the region. Obviously, this has caused a high negative ecological impact by reducing the green open space area. (Eckbo, 1984)
According to Indonesian regulation on the ripar-ian area by Ministry of Public Works (Decree No. 63/PRT/1993), states that any construction of build-ing across the riparian up to fifteen meters from the edge of the river is strictly prohibited (1993). Other relevant Indonesian regulations related to spatial and environmental management are as follows: Government Regulation No. 35 of 1991 on River (1991), Regional Regulation No 8 of 2011 on spatial planning of Bogor City 2011-2031 (2004), Act No 32 of 2004 on Local Government Autonomy (2007), Act No 26 of 2007 on spatial planning (GI, 2007), and Act No 32 of 2009 on environmental management (GoI, 2009).
Trees have four main functions: (1) they modify the temperature and humidity, (2) they prevent soil erosion, hold water, muffle noise, reduce air pollu-tion, reduce sun glare and reflect the light, (3) archi-tecture, and (4) beauty (Dreesen, 2005). Site evalua-tion is the first step in selecting the proper trees for
a plantation site. It is important to consider both above-ground and below-ground site attributes dur-ing this assessment (Gilman et al., 2007). Riparian ar-eas are the most critical landscape as they maintain a rich diversity of plants and animals and hence maintain water quality, terrestrial and aquatic habi-tats (Gilman and Sadowski, 2007). Riparian areas have one or both of the following characteristics: 1) distinctly different vegetative species than in adja-cent areas, and, 2) species similar to adjaadja-cent areas but exhibiting more vigorous or robust growth forms (Phillip et al., 1996). Riparian areas have ef-fects on water quality and quantity-enhancement (URS, 2002).
In the riparian zones, trees are an important part of the regional watershed system and have hydro-logical and ecohydro-logical significance. Effective conser-vation of trees in riparian areas needs proper plan-ning and best management practices, such as: (1) conserving at least 70% tree canopy cover in riparian zones, (2) saving existing woodlands with undis-turbed understory trees, shrubs, herbaceous plants, leaf litter, and soil, (3) planting and conserving trees in mixed groups and stands, (4) selecting species that are adaptable to alluvial soil conditions, (5) managing areas containing young trees to develop valuable mature tree stands over time, (6) avoiding exotic species as many are aggressive along creeks and streams, (7) maintaining a 75 foot undisturbed buffer zone along streams. (Head, 2001)
To improve the ecological functionality, sustainability and liability in an urban environment, following concept and method such as green space network (Cranz and Boland, 2005), the parking sys-tem (Jongman and Pungetti, 2004 and Maruani and Cohen, 2007) and greenway network [McHarg, 1969; Ahern, 1995; Ahern, 2002; Fabos, 2004; Turner, 2006) can be developed as an initiative to develop and connect the natural network. These efforts need to be more supported in term of operational policies that benefit the environment and society. Many local governments are interested in developing effective, comprehensive riparian buffer regulations, but are uncertain of the legal compliance (Wenger, 1999). Allocation of budget (APBD) is important for im-provement and conservation of green open space area (Suwarli, 2012).
de-scribed in the ISA guide [3]. This method consider-ing the basic value, species, condition of tree and location percentages in the formula, where basic value itself is replacement cost for trees up to 8 inches of diameter (D2 x 0.7854 x US$ 22). Compar-ing formula methods of tree appraisal have done and resulting the different value for five countries [4], i.e. (1) CTLA Method (USA), (2) Burnley method (Australia), (3) Helliwell method (Great Britain), (4) STEM (Standard Tree Evaluation Method-New Zealand), and (5) Norma Granada method (Spain). Result of the comparison are the CTLA and Helliwell methods consistently produced the lowest values, and the Norma Granada method values were most often the highest. There was a strong re-lationship between variation among appraisers and the mathematical operations used in calculating the formula values. The Helliwell method, which mul-tiplies all of the rated factors together, consistently produced the highest variation among appraisers. STEM, which adds all the factors together, consis-tently produced the lowest variation among ap-praisers. Minimizing the number of multiplication operations used in the formulas is an effective way of reducing appraiser variation, but in doing so, the influence of individual factors may be diminished too much [4]. CTLA methods, like any valuation methods, are simply tools. They cannot be used meaningfully without an understanding of basic concepts, including value and valuation [5].The re-search aimed to evaluate trees value around the Ciliwung riparian using ISTEM, especially by find-ing the potential trees value in the urban green open space area which indicates the ecological value in the riparian area.
Research Methodology
The tools and materials used in this research were GPS Garmin Oregon 550 for geographical position-ing, a measuring scale, stakes for making bound-aries of a square, raffia for the demarcation of the sampling plot, high resolution satellite imagery of Ciliwung river (Quickbird Panchromatic, 0,445-0,900 ˜m of spectral band, 0,61 m x 0,61 m of reso-lution), and a base map with scale resolution 1: 10,000. The research was carried out in the four sub districts of the Bogor city, namely East Bogor, Cen-tral Bogor, Tanah Sareal, and North Bogor, geo-graphically located between 106o50’50’ – 108o46’8” E and 6o38’10” – 6o32’33” S. According to the
regu-lations of Ministry of Public Works No. 63/PRT/ 1993, setting out the river boundary, under Section 8 (b), it is forbidden to erect any building structure within fifteen meters from the river [5]. Current re-search has a logical framework and a methodologi-cal approach (Fig. 1).
Fig. 1. Logical frame work of Methodology
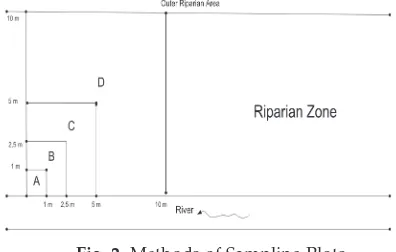
The survey of trees was carried out by sampling method in the following manner (see Fig. 2). In Fig. 2, the sample plots measured 10 meters x 10 meters (triple), with a class of seedlings (A), class of stakes (B), class of pole (C) and class of tree (D).
Fig. 2. Methods of Sampling Plots
According to the collected data the calculation of trees value using ISTEM Model could be predicted.
Trees Evaluation Method
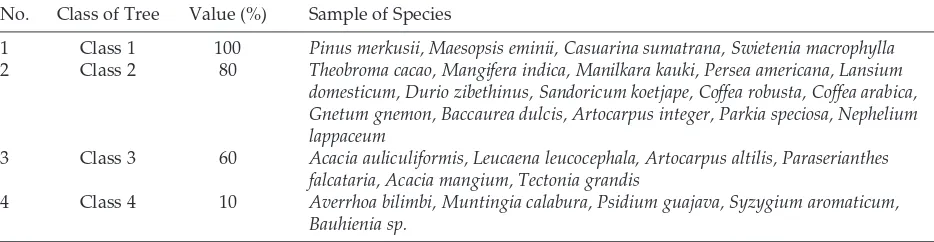
Table 1. Class of Trees
No. Class of Tree Value (%) Sample of Species
1 Class 1 100 Pinus merkusii, Maesopsis eminii, Casuarina sumatrana, Swietenia macrophylla
2 Class 2 80 Theobroma cacao, Mangifera indica, Manilkara kauki, Persea americana, Lansium domesticum, Durio zibethinus, Sandoricum koetjape, Coffea robusta, Coffea arabica, Gnetum gnemon, Baccaurea dulcis, Artocarpus integer, Parkia speciosa, Nephelium lappaceum
3 Class 3 60 Acacia auliculiformis, Leucaena leucocephala, Artocarpus altilis, Paraserianthes falcataria, Acacia mangium, Tectonia grandis
4 Class 4 10 Averrhoa bilimbi, Muntingia calabura, Psidium guajava, Syzygium aromaticum, Bauhienia sp.
ISTEM was used to assess tree value using the fol-lowing formula (Dreesen, 2005):
Tree value = π r2 x% Quality x %Class x% Location
x UU$ 40
... (1) Where: π = 22/7; r = radius (inch); % quality-based on visual stands, branch and canopy architec-ture; % Class-using Pirone’s trees maintenance for shading trees (Table 1), where: Class I=100%, Class II=80%, Class III = 60%, Class IV = 40%, & Class V = 20%; % Location-based on accessibility, strategic position, role & usefulness as shading trees, etc. The value of US$ 40 was used in this research for calcu-lating tree value per inch. It was modified from the previous research US $ 36 per inch (Dreesen, 2005). A tree consists of three parts: root, stem and leaves; they all make a tree attractive and healthy [11]. Commonly, the characteristics of shading trees in the city are: (Ruspendi, 2011)
(1) Shade trees of medium height (<15m). (2) Trees forming canopy should be columnar. (3) The height of the lower branches from the base
should be 5m.
(4) They shouldn’t endanger public; should be non-spiny, having big seeds and strong branches. (5) They shouldn’t have extensive roots which
could damage the pavement and drainage channels.
According to the above criteria, following trees are grouped in Table 1.
The assessment of tree condition is determined by six factors (A-F): A-the stem condition, B-growth (various species), C-structure, D-crown develop-ment, E-life expectancy and growth and F-disease [11]. Four criteria whose overall points give the loca-tion percentage were proposed Webster, (1978), which included the functional aspects (resistance, availability, and effectiveness), participation of the
tree in the site, site and the quality of the location. Trees, which are often associated with landscaping, enhance residential property value (Payne, B. (1973) and Morales et al., 1983). In terms of the value of trees location, following criteria should be consid-ered; residential landscape trees (80-90%), trees in the mall or shopping center (75-85%), public areas and commercial trees (70-85%), trees in arboretum parks and street trees 80%), windbreak trees (60-70%), recreation and picnic area trees (60-(60-70%), and natural forest trees (30-40%). Each tree has a score that indicates the importance of the location. [11]
The relationship between diameter of tree (D) and height (H) was stated in the hyperbolic curve [31]:
1 1 1
= + ... (2)
H AxDh Hmax
Where, H : tree height (m) D : stem diameter (dbh, cm)
A, h, Hmax : specific coefficient, Hmax represent maximum height of tree in study area.
Model validation test using statistic method, Ab-solute Mean Error-AME (range 5-10%): [32]
AME = (Si = Ai)/Ai ... (3)
where:
Si = Si N and Ali = Ai N
and N = time observation interval A = actual value S = simulation value
Identification of Plant Type
A few species of plants that grow in riparian areas were studied based on the timber plant origin [33] and crop plant origin [34], of which Maesopsis eminii
came from Africa, Persea americana of Latin America,
In-dian sub continent, Laos, Burma, Thailand & Philip-pines; Artocarpus integer from Malaysia, Sumatra and Borneo. Artocarpus heterophyllus naturalization is a plant of Southeast Asia, Mangifera indica of the Indo-Burma region, and Averrhoa bilimbi also of Southeast Asia. The Durio zibethinus, Lansium domesticum, Gnetum gnemon and Pinus mercusii are all grown in Southeast Asia, Psidium guajava is from Tropical America (Mexico and Peru), and
Sandoricum koetjape is a naturalized plant in Indone-sia, Nephelium lappaceum is of unknown origin, but is grown in the tropics; Paraserianthes falcataria is not known, but it is also grown in the tropics and
Artocarpus altilis from the equator. Syzygium aromaticum is from Southeast Asia and Muntingia calabura is from neo-tropical countries.
Thus among them there are types of plants that are endogenous to southeast Asia, particularly Indo-nesia, as plants included and recommended to be developed. Considering this fact, the types of plants to grow well in the Ciliwung riparian area should include endogenous plant species that are native to Indonesia, or tropical regions of southeast Asia such as Durio zibethinus, Gnetum gnemon, Artocarpus altilis,
Artocarpus heterophyllus, Averrhoa bilimbi, Lansium domesticum, Sandoricum koetjape and Psidium guajava.
Land Cover Analysis
The land cover analysis was performed through an extrapolation approach of the available data from 2006, 2009, 2011 and 2013. The land cover study re-sults and analysis showed a tendency of increase in settlement areas leading to reduction in green open space area. Increasing the area of settlement within the rare area would directly reduce the open space area due to land conversion. Using spatial analysis, change in land cover area was identified. Land
cover is classified into six types, rood, business & commercial area, warehousing & industrial area, settlement, agriculture & open space area and water body.
Spatial analysis involves simple calculations, clas-sifications, structuring, geometric overlaying, and cartographic modeling [35]. Based on the analysis of change in land cover, it could be concluded there was a large increase in settlement area (5.14%/year) within the research area from 171.85 ha (2006) to 185.93 ha (2013), whereas green open area decreased (1.65%/year) from 97.48 ha (2006) to 83.40 ha (2013).
Dynamic Modeling
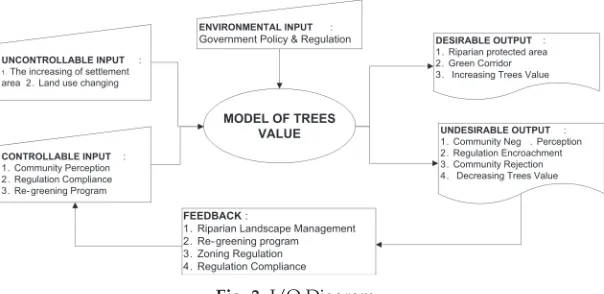
The area of riparian is a complex system, where the components of system are interlinked. The compo-nents of the system are trees population, land area, settlement area, water body, community and ripar-ian boundary itself. The interaction of the system component describing the quality of ecology with the main indicator being tree value. When the trees value is worse then the existing condition, it means a decrease in environmental quality, otherwise the increasing environmental quality happenned. The I/O diagram shows controllable and uncontrollable input as input component, environmental input, desirable and undesirable output as output compo-nent, and also feedback (Fig. 3).
The casual loop diagram is a tool to describe the interactions among system components (see Fig. 4). Based on Fig. Four, the beginning of the settlement area in the Ciliwung riparian affects the decrease of green open space area in the same place. The inter-action between the areas affect the trees value as an ecological indicator of the Ciliwung riparian area.
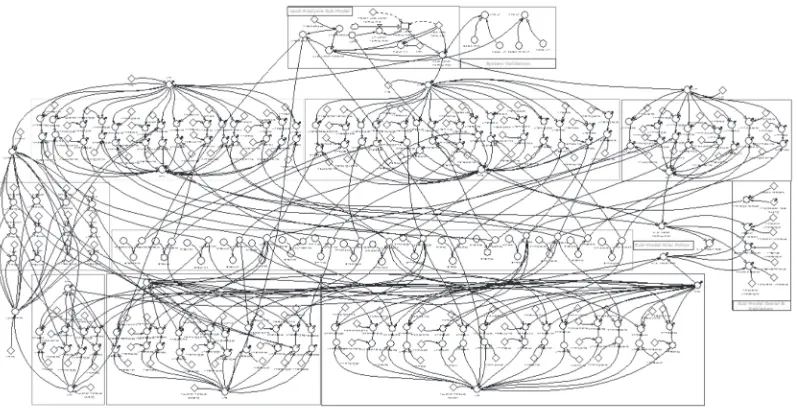
The model has three sub-models, i.e.: land evalu-ation, social and policy and tree value (Fig. 5). Sub
models include the value of the component of tree growth sub model, predicting values of riparian trees and re-greening.
Land Evaluation Sub Model
The sub-model of land evaluation includes the analysis of the impact of land occupation are influ-enced by social/policies related to compliance as-pects and public perception, which tend to be less concerned about the environmental conditions and border violations. The initial value of compliance with the ministrial regulation was obtained from a large proportion of settlements of the riparian area
(15 m from the river side). The index value was ob-tained from the public perception through question-naires based on the environmental managment porformance by the governament on a Likert scale of scores 1-5 ,where score 3 is considered as moder-ate. In terms of sub-models of land evaluation, two groups of land capability classes, i.e., Class I-IV and Class V-VIII, were analyzed particularly for open space area. Fractions of settlement areas rare, me-dium and dense were analyzed using high-resolu-tion imagery (2011), in which the frachigh-resolu-tions obtained were rare settlement 0.049; moderate 0.1536 and dense 0.7975. The fraction of rare open space area was 0.2792; moderate 0.3051 and dense 0.4157. To restrict the growth area of available land function ‘Max’ was used particularly in rare and moderate areas.Similarly in order to limit open space area do not exceed the existing available land area ‘Max’ function is used.
Social-Policy Sub Model
The sub models focused more on the role of social policy in the Bogor city government control of land settlement with variable government performance. Policy analysis was also done to determine the value of financial / budgetary incentives maintenance to maintain the asset value of the trees as the city of Bogor, the insurance value of trees and the amount of fines that need to be set.
Some assumptions were set up as below: (1) The amount of the incentive value of tree
Fig. 4. Causal Loop diagram
maintenance was set at 1% per year of the value of trees in settlement areas and in the area of open space area.
(2) The estimated receipts fines or damage due to tree drop was set 2% per year of the value of trees in settlement areas and 1% per year of the value of trees in the area of open space area. (3) Insurance of trees set at 3% per year of the
value of trees in settlement areas and 2% per year of the value of trees in the area of open space area.
Trees Value Sub Model
In the trees value sub-model, some assumptions were used as follows:
(1) The proportion of re-greening program in rare settlement area is 20% and 80% in rare open space land.
(2) The initial value of re-greening program is 0 ha for every species of crop.
The results of sampling plots indicates the vari-able ecological value of trees, where the plot repre-sents the condition of research area. There is a ten-dency that in the moderate settlements area have a higher tree value of (U.S. $ 2.857/ha) than in the rare settlement areas (U.S. $ 2.467/ha). As a result of rare settlement area, there were a relatively small num-ber of trees and they were poorly maintained. How-ever, in areas with medium dense housing in gen-eral form, there were more trees as shade trees and they were relatively preserved. Whereas in densely populated areas (settlements solid), its value is
rela-tively small because of the availability of land is relatively narrow, hence the value of trees in the residential plots and the ecological value of trees obtained is only U.S. $ 1.442/ha. The value of each plot also varyied. The highest values were found in dense area (U.S. $ 179.669/ha), then the moderate was at U.S. $ 36.969/ha and rare green space at U.S. $ 7.596/ha.The evaluation of trees is based on the results of trees per hectare. Considering the calcula-tions, it was inferred that there was a potential settlement in the area of trees with a value of U.S. $ 429,169 (database 2006), whereas the green open space area had more potential value than U.S. $ 8,719,424 trees. Hence this indicates that in 2006 the city government actually had the value of assets in the riparian region of U.S. $ 9,148,593. Similarly the data can be calculated from 2007 and 2013.
Model Simulation
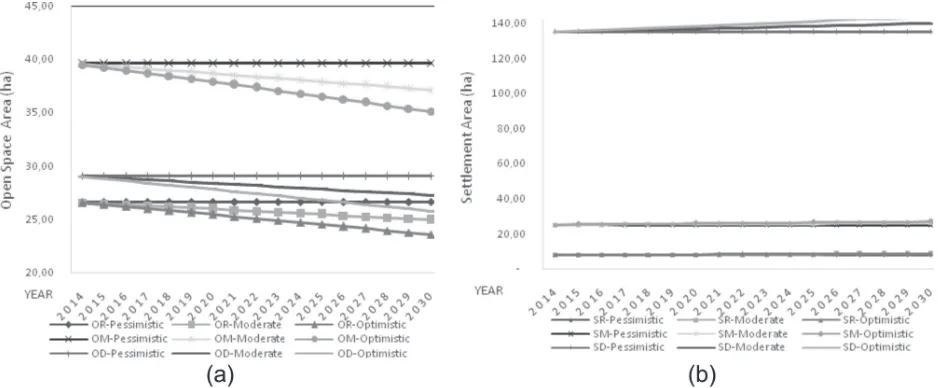
Simulation of Land Area Development
Occupation rate of the green open space and settle-ment area were simulated (Fig. 6). According to Fig. 6.a, it was difficult respectively to prevent the de-crease of land area in the all of type green open space (rare, medium and dense of trees density). The other hand the increasing of land settelement is tend quite easly for every type of settlement density (Fig 6.b).
Encountering a pessimistic scenario, the interven-tion of government policy can be proposed for the protection of green open space area. The magnitude
of intervention affecting the result of development 13 area (pessimistic and moderate scenarios), other-wise, the decreasing of the green open space area tends following the optimistic scenario model (lowless). Complemented with the policy in the green open space area, the government should con-trol the developing of settlement area in the riparian with a strict permit system followed by law enforce-ment (following the pessimistic and moderate sce-narios), otherwise, the increasing of illegal settle-ment to be uncontrollable (optimistic scenario).
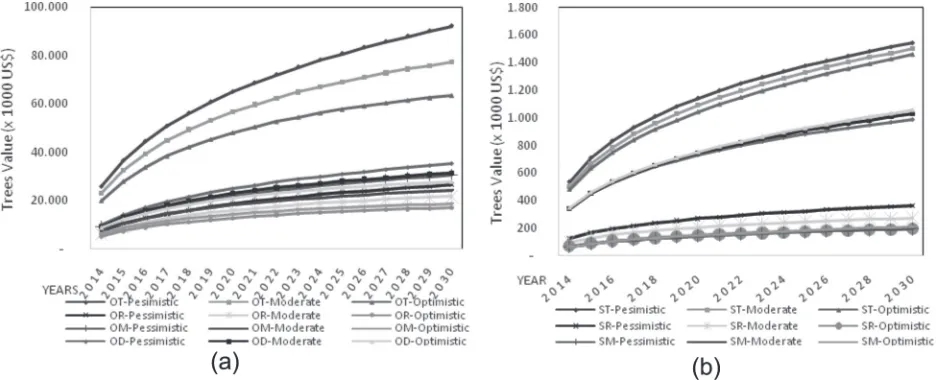
Simulation of Trees Value
The simulation was done under three scenarios, e.g. optimistic, moderate and pessimistic (Fig. 7). The optimistic scenario means introducing the model using minimum effort by the participants (govern-ment policy), the moderate scenario means that the effort is medium, and the pessimistic scenario means that the government should implement maxi-mum effort using the regulation and introducing the program (compliance of regulation, re-greening and community campaign).
The graph result shows the downward trend of the ecological value of trees in the area of green space, but on the contrary a slight increase in the value of trees in residential areas was noticed. The increasing of trees value in the settlement area is inline with the development of intense settlement may occur along the riparian areas, affect the reduc-tion of trees value as a result of conversion of the green space. Analysis of the sub model of trees value
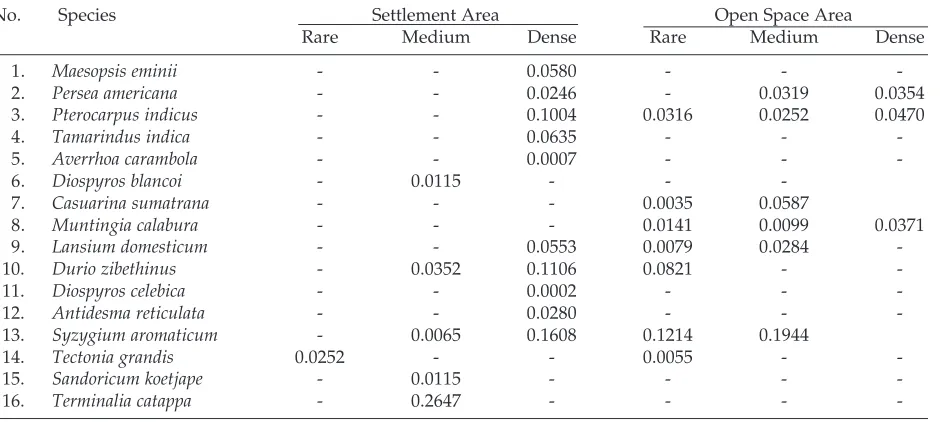
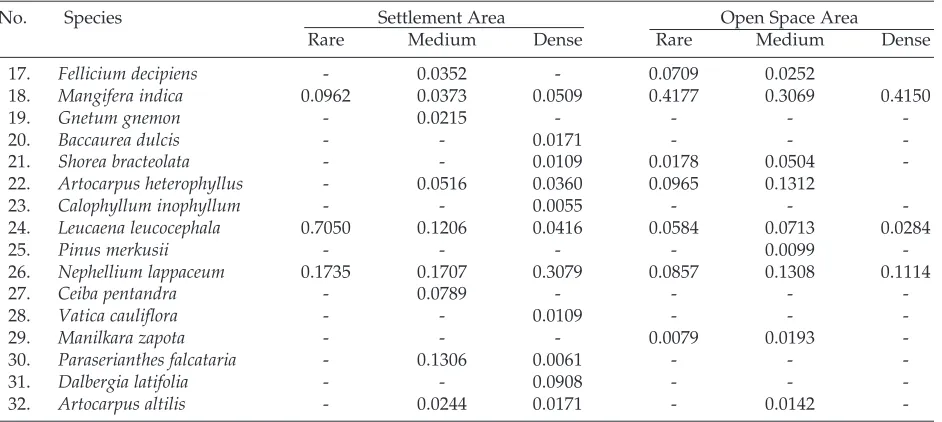
begins with the calculation of the value of trees planted area for each type of tree density index based on the proportion of each group of sample (Table 2).
Input is variable on sub-model of trees growth initiated in years until 2031 (Table 3).
Referring to Table 4, then the canopy density frac-tions obtained by 0.2792 (rare), 0.4157 (medium), and 0.3051 (meeting). Thus the massive wide canopy along the river width of 15 m is 3.88 ha. It can be assumed for certain greening tree species with a diameter of 6 m canopy, extensive plant canopy is 28.26 m2, so it is predicted there are about 1,375 trees across the riparian. Projected revenues were $ 200,000 in 2014. Technically in the amount of fine pitch can be adjusted to the diameter and height as well as the condition of the tree stand.
The value of trees is affected by different factors like condition itself, maturity, desease, The equation for individual species of trees growth is ilustrated in Table Four. Thus, the rate of growth of the radius (r) of each type of plant (in inches) can be calculated with the formula, ri = (D/2) / 2.54.
In sub-models the assumed fraction of re-green-ing area in the settlement zone is 0.2 and the fraction of open space area is 0.8. This means that the green-ing programs recommended 80% of the trees planted in the area of open space and are rare and only 20% of trees planted in rare settlement. Sub model performed for each type of plant in each group sampling the input parameter value trees per hectare.
Table 2. Trees Value in the Sampling Area of Settlement
No. Common Name Species Value/ha (US$)
Settlement Area Open Space Area
Dense Moderate Rare Dense Moderate Rare
1 Umbrella/African tree Maesopsis eminii - - - 2,543.4 -
-2 Tamarind Tamarindus indica - - - 4,295.5 -
-3 Butter fruit Diospyros discolor - - -
-4 Bignay/Buni tree Antidesma bunius - - - 1,582.6 -
-5 Santoi/Sentul Tree Sandoricum koetjape - - - - 1,978.2
-6 Tropical Almond Terminalia catappa - - - - 2,826.0
-7 Yellow Menteng tree Baccaurea racemosa - - - 1,695.6 -
-8 Tamanu/Nyamplung/ Calophyllum inophyllum - - - 4,239.0 -
-Oil Nut Tree
9 Kapok/ Silk Cotton tree Ceiba pentandra - - - - 5,312.9
-10 SengonBatai/jeungjing Paraserianthes falcataria - - - - 2,713.0
-11 Indian Rosewood Dalbergia latifolia - - - 8,760.6 -
-12 Avocado Persea americana 43.3 19.8 - 1,978.2 -
-13 Amboyna wood Pterocarpus indicus 25.8 22.2 18.2 11,304.0 -
-14 Sumatran Rhu Casuarina sumatrana - 160.6 20.2
15 Calabura/Cherry Tree Muntingia calabura 13.8 14.8 15.1
16 Langsat Lansium domesticum - 28.0 16.1 3,560.8 -
-17 Durian Durio zibethinus - - 30.8 7,686.7 2,260.8
-18 Clove Syzygium aromaticum 59.6 38.4 102.9
19 Teak Tectonia grandis - - 18.2 - - 2,637.6
20 Fern Tree Fellicium decipiens - 13.6 41.1
21 Mango Mangifera indica 73.2 114.3 209.6 3,617.3 2,260.8 3,165.1
22 White Meranti Shorea bracteolata - 22.2 18.2
23 Jakfruit Artocarpus heterophyllus 29.5 19.7 17.1 - 1,978.2
-24 Sataw/ Stink bean Parkia javanica 20.1 25.9 15.3 3,165.1 2,734.2 3,025.9
25 Merkus’s Pine Pinus merkusii - 22.2
-26 Rambutan Nephelium lappaceum 51.2 58.1 50.2 9,749.7 3,626.7 5,934.6
27 Sapodilla Manikara zapota - 17.3 20.0
28 Breadfruit Artocarpus altilis - 21.6 - 1,582.6 1,978.2
-Table 3. Analysis of the fraction of plants in settlement areas
No. Species Settlement Area Open Space Area
Rare Medium Dense Rare Medium Dense
1. Maesopsis eminii - - 0.0580 - -
-2. Persea americana - - 0.0246 - 0.0319 0.0354
3. Pterocarpus indicus - - 0.1004 0.0316 0.0252 0.0470
4. Tamarindus indica - - 0.0635 - -
-5. Averrhoa carambola - - 0.0007 - -
-6. Diospyros blancoi - 0.0115 - -
-7. Casuarina sumatrana - - - 0.0035 0.0587
8. Muntingia calabura - - - 0.0141 0.0099 0.0371
9. Lansium domesticum - - 0.0553 0.0079 0.0284
-10. Durio zibethinus - 0.0352 0.1106 0.0821 -
-11. Diospyros celebica - - 0.0002 - -
-12. Antidesma reticulata - - 0.0280 - -
-13. Syzygium aromaticum - 0.0065 0.1608 0.1214 0.1944
14. Tectonia grandis 0.0252 - - 0.0055 -
-15. Sandoricum koetjape - 0.0115 - - -
-Table 3. Continued ...
No. Species Settlement Area Open Space Area
Rare Medium Dense Rare Medium Dense
17. Fellicium decipiens - 0.0352 - 0.0709 0.0252
18. Mangifera indica 0.0962 0.0373 0.0509 0.4177 0.3069 0.4150
19. Gnetum gnemon - 0.0215 - - -
-20. Baccaurea dulcis - - 0.0171 - -
-21. Shorea bracteolata - - 0.0109 0.0178 0.0504
-22. Artocarpus heterophyllus - 0.0516 0.0360 0.0965 0.1312
23. Calophyllum inophyllum - - 0.0055 - -
-24. Leucaena leucocephala 0.7050 0.1206 0.0416 0.0584 0.0713 0.0284
25. Pinus merkusii - - - - 0.0099
-26. Nephellium lappaceum 0.1735 0.1707 0.3079 0.0857 0.1308 0.1114
27. Ceiba pentandra - 0.0789 - - -
-28. Vatica cauliflora - - 0.0109 - -
-29. Manilkara zapota - - - 0.0079 0.0193
-30. Paraserianthes falcataria - 0.1306 0.0061 - -
-31. Dalbergia latifolia - - 0.0908 - -
-32. Artocarpus altilis - 0.0244 0.0171 - 0.0142
-Table 4. Diameter growth rate for each species
No. Local Name Common Name Species Name Diameter growth rate (cm/year) R2
1 Alpukat Avocado Persea americana d(t) = 69.88 ln(t) + 11.74 0.8427
2 Angsana Angsana Pterocarpus indicus d(t) = 14.81 ln(t) + 34.35 0.9464
3 Cemara Fir/Spruce Casuarina sumatrana d(t) = 6.72 ln(t) + 28.55 0.9003
4 Chery Cherry Muntingia calabura d(t) = 6.91 ln(t) + 46.65 0.7769
5 Duku Duku Lansium domesticum d(t) = 41.79 ln(t) + 15.78 0.8854
6 Durian Durian Durio zibethinus d(t) = 4.24 ln(t) + 27.25 0.9516
7 Jambu Guava Syzygium aromaticum d(t) = 14.59 ln(t) + 39.03 0.8568
8 KreyPayung - Fellicium decipiens d(t) = 6.81 ln(t) + 26.93 0.9962
9 Mangga Mango Mangifera indica d(t) = 8.40 ln(t) + 28.10 0.9532
10 Meranti Meranti Shorea bracteolate d(t) = 11.22 ln(t) + 30.47 0.8555
11 Nangka Jackfruit Artocarpus heterophyllus d(t) = 7.42 ln(t) + 38.18 0.8961
12 Petai Petai Parkia speciosa d(t) = 17.75 ln(t) + 40.82 0.9741
13 Pinus Pine Pinus merkusii d(t) = 6.72 ln(t) + 28.55 0.9003
14 Rambutan Rambutan Nephelium lappaceum d(t) = 12.66 ln(t) + 22.30 0.9444
15 Sawo Sapodilla Manikara kauki d(t) = 5.07 ln(t) + 19.34 0.9383
16 Sukun Breadfruit Artocarpus altilis d(t) = 30.65 ln(t) + 40.10 0.9970
Simulation of Green Open Space (GOS)
The tendency of changes in land/transfer function if the condition is left as it is now. GOS broad down-ward trend is attributable to an increase in the rate of occupation of land into settlements without any effort or any scenario. As we know that land settle-ment has now reached 169.28 ha (2014 projection data), and tend to continue to rise until the end of 2030 reached over 175.36 ha.
Therefore there is a government effort to sup-press the rate of land conversion that reduces green space in the area of the Ciliwung river border. The
program is regarded as a reliable Greening Pro-gram, supported by awareness raising (increasing the level of perception) and regulatory compliance (Spatial Regulation, Ministerial Decree, Governor Decree, local regulation and so on), associated with the maintenance of river banks/riparian.
Scenarios of Policy Formulation
simulation can be performed for several scenarios (pessimistic, moderate and optimistic). The pessi-mistic scenario is an attempt to maintain the pres-ence of green space in riparian areas. Other sce-narios are predictive of what happens when the city government less active role in the management landscape border region.
(1) Optimistic: This scenario increases efforts to im-prove the public perception of the achievement standard little perception indices are (0,7), regu-latory compliance rate of 50% and an increase in the greening of 1% per year.
(2) Moderate: This scenario pursues good perfor-mance standards with improved public percep-tion index of 0.8, 75% regulatory compliance and increase the rate of deforestation in the area of green space at 2% per year.
(3) Pessimistic: This scenario seeks the government’s performance with an increase in full public per-ception, regulatory compliance and an increase of 100% greening rate of 3% per year.
Similarly for medium and dense settlements, also has a pattern of development that is likely to in-crease, but several scenarios are applied is not too significantly increase the value of trees in both loca-tions. When compared with the value of settlement area development tree, it appears that the whole sce-nario in the settlement area trees value is relatively less significant increase over time. This happens be-cause of limited land availability and policy direc-tives that allocate only 20% of re-greening trees to be planted in this area.
Analysis of the model of trees values seems to decrease in open space area from time to time. Al-though the land area is reduced, there was signifi-cant growth of trees so increasing the trees values (optimistic scenario). Analysis of the trees value in an open space area is solid and also has a pattern of significant increase over time due to tree growth. Moderate and pessimistic scenarios were simulated in this model to be able to develop the value of the tree. The direction of the re-greening program allo-cates 80% of the trees planted in this location, and is particularly rare. This condition is possible because availability of land in this region is relatively sup-portive. This policy is intended to prevent occupa-tion and restrain the rate of growth of settlements in the Ciliwung border region, where the tree is the main component of green infrastructure.
The total trees value in 2014 is estimated at USD $ 16,791,234. As for the value of trees in settlement
areas, it is US $ 445,015 (USD. 4.9 billion) and the value of trees in open land areas, US $ 16,346,219 (USD. 179.8 billion). Under the proposed policy sce-narios, there would be development of the total trees value, the trees value in settlement areas and the trees value in open fields.
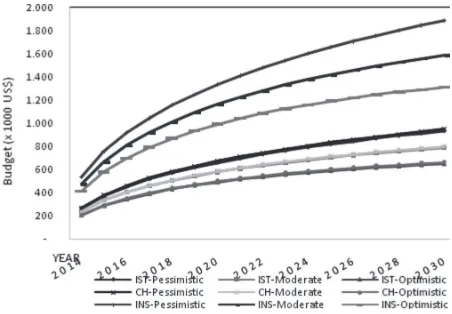
In order to implement the policy, city govern-ment needs to implegovern-ment a program of incentives and penalties as well as protection through tree in-surance. Policy direction for the determination of fines imposed on the community can refer to an an-nual projection of simulation as Fig 8. Projected amount of fine almost equal to the incentive budget is prepared. Theoretically, a fine of more directed at the destruction / felling trees to 15 m wide plains region either side of the river, where the current oc-cupation rate has reached 62%, so the rest only 38% of large banks. The logic of such calculation can also be applied in determining the amount of insurance of the tree.Policy direction for determining the amount of financial incentives tree maintenance each year and the value of the proposed tree insur-ance through the budget mechanism can refer to the simulation as Fig. 8.
Fig. 8. Budgeting scenarios related to the cost and rev-enue
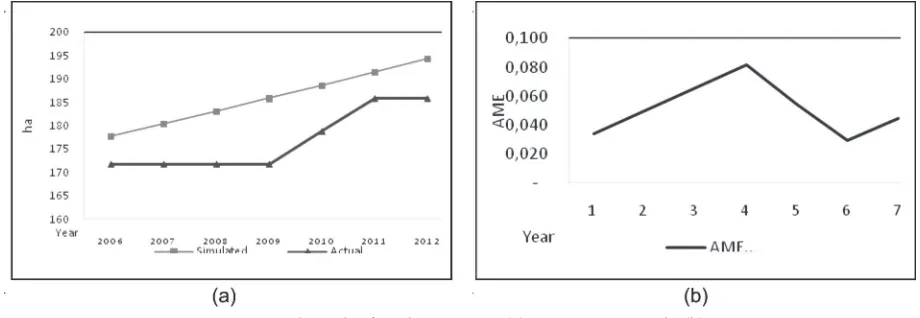
Validation of the Model
Validation of models using actual data of settlement area in 2006-2013, where the data is compared with the simulation results with AME (Mean Average Error). AME value (average 0.051) less than 0, 1, it means the model is valid (Fig. 9):
Conclusion
pre-dicted by using dynamic model and based on International Shading Trees Evaluation Method (ISTEM).
(2) The projected trees value in the Ciliwung ripar-ian using dynamic model based on ISTEM is valid untill the year 2030 which worth of about U.S. $ 64,706,109 (pessimistic scenario), U.S. $ 78,556,923 (moderate scenario)and U.S. $ 93,623,117 (optimistic scenario).
(3) According to the trees value, the planning of re-greening program at Ciliwung riparian area can be setup under local government policy and formulating green budgeting (incentives of trees maintenance, trees insurance and penaltyfor logging the tree).
Recommendations
(1) The trees value shows the current asset value of Bogor city in the Ciliwung riparian, that should be preserved and maintained by the local gov-ernment.
(2) The Bogor city government should sustain the presence of trees in the Ciliwung riparian area as a regional asset.
(3) The government needs to implement a re-green-ing program to improve the trees value.
Acknowledgements
This research result and analysis is a unit of a re-search report submitted at IPB as a partial fulfill-ment of requirefulfill-ment of Ph.D degree. I am thankful to SEAMEO-BIOTROP, who has supporting the Re-search Grant DIPA BIOTROP 2012. Special thanks to ETH Zurich – NUS who has given great challenge to joint Workshop on Ciliwung River Rehabilitation in Jakarta and Singapore year 2013.
References
Ahern, J. 1995. Greenways as a planning strategy. Land-scape Urban Planning 33:131–155. DOI:10.1016/ 0169-2046 (95)02039-V.
Ahern, J. 2002. Greenways as strategic landscape planning: theory and application. Dissertation, Wageningen University, Wageningen, the Netherlands. Arifin, H.S., Christine, W., Qodarian, P., R.L. Kaswanto.
2009. Analysis of Agroforestry Landscape. Published by IPB Press. Bogor.
Cranz, G. and Boland, M. 2005. Defining the sustainable park: a fifth model for urban parks. Landsc J 23(2– 04):102–120.
De Mers. 1997. Fundamentals of Geographical Informa-tion System, John Wiley & Sons, Canada.
Dreesen, A.D. 2005. Evaluation of Texas Shade Trees. Texas Cooperative Extension. The Texas A&M Uni-versity System. Texas.
Eckbo, G. 1984. Urban Landscape Design. McGraw-Hill Inc. New York. 248 p.
Fabos, JG. 2004. Greenway planning in the United States: its origins and recent case studies. Landscape Urban Planning 68:321–342. doi:10.1016/j.landurbplan. 2003.07.003.
Gilman, E.F. and Sadowski, L. 2007. Choosing suitable trees for urban and suburban sites: site evaluation and species selection. Institute of Food and Agricul-tural Sciences-University of Florida. http:// edis.ifas.ufl.edu.
Government of Indonesia. 1991. Government regulation No. 35 of 1991 on River.
Government of Indonesia. 1993. Ministerial Decree (Pub-lic Works) No. 63 of 1993 on the riparian river. Government of Indonesia. 2004. Act No 32 of 2004 on
lo-cal government – autonomy.
Government of Indonesia. 2007. Act No 26 of 2007 on Spatial planning.
management and environmental.
Hall, F. C. 1988. Characterization of riparian systems. Pages 7-12 in K. J. Raedeke, editor. Streamside Man-agement: Riparian Wildlife and Forestry Interac-tions. Institute of Forest Resources, Contribution No. 59, University of Washington, Seattle, WA. Head, C.P., Fisher, R., O’Brien, M., Cauthen, R. 2001. Best
Management Practices for Community Trees: A Technical Guide to Tree Conservation in Athens-Clarke County, Georgia. Urban Tree Advisory Com-mittee and the Future of Trees ComCom-mittee, Athens-Clarke County Central Services Department. Land-scape Management Division Office at 350 Pound Street, Athens, GA 30601.
Jongman, R. and Pungetti, G. 2004. Ecological Networks and Greenways Concept, Design, Implementation. Cam-bridge University Press, UK.
Local Government of Bogor City. 2011. Regional regula-tion No 8 of 2011 on spatial planning of Bogor city 2011-2031.
Maruani, T. and Cohen, I. 2007. Open space planning models: A review of approaches and methods. Landscape Urban Plan 81:1–13. doi:10.1016/ j.landurbanplan. 2007.01.003.
McHarg, IL. 1969. Design with Nature. The Natural His-tory Press, Garden City, New York, USA.
Morales, D. J., Micha, F. R. and Weber, R. L. 1983. Two methods of valuating trees on residential sites. Jour-nal of Arboriculture. 9 (1) : 21-24.
Muhammadi, E. Aminullah dan B. Soesilo. 2001. Analysis of Dynamic System: Environmental, Social, Economy, Management. UMJ Press. Jakarta Nopiyanto. 2009. Sustainable Landscape Planning of
Sintang Citv with Spatial Dynamic Model Ap-proach. Thesis, Graduate School-Bogor Agricultural University. Bogor.
Payne, B. 1973. The twenty-nine tree home improvement plan. Natural History.
Phillip, M.J, L.W. Swift, Jr., and C.R. Blinn. 1996. Best Management Practices for Riparian Area. Riparian Forest Management p. 273-286.
Prosea. 1992. Plant Resources of South-East Asia (Prosea): Edible Fruits and Nuts. No. 2, Ed. E.W.M. Verheij and R.E. Coronel. Bogor, Indonesia.
Prosea. 1994. Plant Resources of South-East Asia (Prosea): Timber Trees: Major Commercial Timbers. No. 5, Ed. I. Soerianegara and R.H.M.J. Lemmens. Bogor, Indo-nesia.
Ruspendi, D. 2011. Landscape Planning of Ciliwung Ri-parian for Natural Environmental Quality Improve-ment in Bogor City. Thesis, DepartImprove-ment of Land-scape Architecture, Bogor Agricultural University. Bogor.
Suwarli, Santun P.S, Widiatmaka, Eka I.K, Putri, and Kholil. 2012. Land use Change Dynamics and Green Open Space Allocation Strategy Based on Environ-mentally Sound Regional Budgeting (A Case Study of Bekasi City). Forum Pascasarjana-IPB. Bogor. Turner, T. 2006. Greenway planning in Britain: recent
work and future plans. Landscape Urban Planning 76:240–251. DOI:10.1016/j.landurbplan.2004.09.035. URS. 2002. Terrestrial Habitat Characterization. Arid West Water Quality Research Project Habitat Character-ization Study, Appendix Q. United States. Webster, B.L. 1978. Guide to judging the condition of a
shade tree. Journal of Arboriculture 4 (11) : 247-249. Wenger, S. 1999. A Review of the Scientific Literature on
Riparian Buffer Width, Extent and Vegetation. Of-fice of Public Service & Outreach, Institute of Ecol-ogy, University of Georgia. USA.
Widigdo, W. and Hartono, S. 2009. Kali Jagir River Bank, Surabaya as Green Open Space (GOS). Department of Architecture, Faculty of Civil & Planning Engi-neering, Christian University of Petra. Surabaya. Yamakura, T. 1985. Tree height distribution in