ANALYSIS OF CUSTOMER SATISFACTION BASED ON
EXTRINSIC AND INTRINSIC VALUE
DEWI CAHYANI
DEPARTMENT OF STATISTICS
FACULTY OF MATHEMATICS AND NATURAL SCIENCE BOGOR AGRICULTURAL UNIVERSITY
PERNYATAAN MENGENAI SKRIPSI DAN
SUMBER INFORMASI SERTA PELIMPAHAN HAK CIPTA*
Dengan ini saya menyatakan bahwa skripsi berjudul Analysis of Customer Satisfaction Based on Extrinsic and Intrinsic Value adalah benar karya saya dengan arahan dari komisi pembimbing dan belum diajukan dalam bentuk apa pun kepada perguruan tinggi mana pun. Sumber informasi yang berasal atau dikutip dari karya yang diterbitkan maupun tidak diterbitkan dari penulis lain telah disebutkan dalam teks dan dicantumkan dalam Daftar Pustaka di bagian akhir skripsi ini.
Dengan ini saya melimpahkan hak cipta dari karya tulis saya kepada Institut Pertanian Bogor.
Bogor, August 2015
Dewi Cahyani
ABSTRACT
DEWI CAHYANI. Analysis of Customer Satisfaction Based on Extrinsic and Intrinsic Value. Supervised by ASEP SAEFUDDIN and DIAN KUSUMANINGRUM.
I Love Indonesia is one of the solutions given by the Indonesian Government to improve the awareness of local products. The development of local product quality does not only build the nation's economy, but also brings a good image of Indonesia in international trade. To retain customers and survive in the industry, every company should understand the customers by fulfilling their needs, both of which can be assessed before purchase or after purchase so that customer satisfaction can be maintained. This study analyzes the effects of extrinsic and intrinsic value on customer satisfaction and loyalty of undergraduate students of IPB on an Indonesian local bag company, XYZ with Structural Equation Modeling (SEM). A total of 300 respondents was collected and analyzed. The results shows the goodness fit indices are adequate. It concluded that both extrinsic and intrinsic value influence customer satisfaction and they are not statistically different with a coefficient 0.42 and 0.46, respectively. It is also known that customer satisfaction influences customer loyalty with a coefficient 0.70. Beside that the most important things for customer are the bag performance in extrinsic value and perceived quality of product in intrinsic value.
Keywords: customer loyalty, customer satisfaction, extrinsic value, intrinsic value, product quality, structural equation modeling
ABSTRAK
DEWI CAHYANI. Analisis Kepuasan Konsumen Berdasarkan Nilai Ekstrinsik dan Intrinsik. Dibimbing oleh ASEP SAEFUDDIN dan DIAN KUSUMANINGRUM.
dalam nilai ektrinsik dan persepsi kualitas produk yang termasuk dalam nilai intrinsik.
Scientific Paper
to complete the requirement for graduation of Bachelor Degree in Statistics
at
Department of Statistics
ANALYSIS OF CUSTOMER SATISFACTION BASED ON
EXTRINSIC AND INTRINSIC VALUE
DEPARTMENT OF STATISTICS
FACULTY OF MATHEMATICS AND NATURAL SCIENCE BOGOR AGRICULTURAL UNIVERSITY
ACKNOWLEDGEMENTS
Alhamdulillah, many thanks to Allah Subhanahu Wata’ala for giving me the strength so I can finish my research and bachelor thesis. This research theme is about Structural Equation Modeling (SEM) with the title Analysis of Customer Satisfaction with Extrinsic and Intrinsic Value.
I would like to express my sincere gratitude to my supervisors, Prof Dr Asep Saefuddin MSc and Dian Kusumaningrum SSi MSi for all suggestions, comments, and kindness of their heart to guide me to do my research. Besides I also want to thanks to SURE GSB IPB and all of my respondents, without all of you, the data would not be collected and this research could never be done. Also thanks to all my friends who have continuously supported me during this research and paper writing that I cannot mention one by one. Especially for my family who always give support to keep on fighting to finish this research.
I hope this research can be useful for many people.
Bogor, August 2015
TABLE OF CONTENT
LIST OF TABLE vii
LIST OF FIGURE vii
LIST OF APPENDIX vii
INTRODUCTION 1
Background 1
Objectives 1
STRUCTURAL EQUATION MODEL 2
METHODOLOGY 3
Data Source and Sampling Technique 3
Methods 3
RESULTS AND DISCUSSIONS 7
Validity and Reliability of Questionnaire 7
Description of Respondents 7
Parameter Estimation of Structural Equation Model 8
CONCLUSIONS AND RECOMMENDATIONS 11
Conclusions 11
Recommendations 12
REFERENCES 12
APPENDIX 13
LIST OF TABLE
1 Goodness of Fit 6
2 Reliability of latent variables in the questionnaire 7 3 Construct reliability of measurement model 9
4 The fit indices of measurement model 9
5 The fit indices of structural model 10
6 Path coefficients between latent variables 11 7 Direct and indirect effects between latent variables 11
LIST OF FIGURE
1 Path diagram 4
2 Distribution of respondents based on type of bag 7 3 Distribution of respondents based on place of purchase 8
4 Structural model 10
LIST OF APPENDIX
1 List of latent variables and indicators 13
2 Structural and measurement model 14
3 Questionnaire 15
4 Qplot of standardized residuals 18
5 Validity of each statement in the questionnaire 19
6 Profiles of the respondent 20
7 Standardize loading factor of measurement model 21
8 Initial measurement model 22
9 Modified measurement model 23
INTRODUCTION
Background
I Love Indonesia is one of the government program launched by the President in 2009. It aims to improve the competitiveness of domestic products hoping that all Indonesians can afford to buy it. The government strongly supports any local company to expand its business not only in Indonesia but also abroad. The President said that there are 2.2 million innovative industries in Indonesia that were able to absorb 5.4 million workers, while 700 000 handicraft industries absorbed 1.8 million workers (Setneg.go.id 2009). The development of local product quality does not only build the nation's economy, but also brings a good image of Indonesia in international trade.
One of the famous Indonesian local brand for bags, which took part in the development of domestic business is XYZ. It has produced bags for more than 35 years. XYZ focuses more on backpack, it is segmented for female and male teens between 12 and 20 years old, oriented to urban sport, and from middle to upper level economic class (Sudarmadi 2007).
To retain customers and survive in the industry, every company should understand the customers by fulfilling their needs, both of which can be assessed before purchase or after purchase so that customer satisfaction can be maintained. Product quality that can be felt before buying a product is known as extrinsic value while the product quality that can be felt after buying a product is known as intrinsic value (Hajjat and Hajjat 2014). If they are satisfied with the product, they will be loyal with a brand (Fornell 1992). Furthermore, Tjiptono (2007) found that customer satisfaction contributes to customer loyalty.
This study discusses the effect of product’s extrinsic and intrinsic value on customer satisfaction, meanwhile customer satisfaction is also assumed to build their loyalty. This study was applied to XYZ bag owners in undergraduate program of IPB. The extrinsic and intrinsic value of product quality, customer satisfaction, and loyalty are variables that cannot be measured or observed directly and needs indicators to explain their value. Therefore, Structural Equation Model (SEM) is used to analyze the relationship among unobserved variables. The relationship was based on Garvin’s product quality dimensions (1984), Hajjat and Hajjat (2014), and Fornell (1992) theory. Therefore, Confirmatory Factor Analysis (CFA) SEM approach was used in this study to confirm their relationship. By using this approach, unobserved variable is measured by one or more observed variables based on the theory or the definition of an unobserved variable.
Objectives The objectives of this study are:
1. To identify the effect of extrinsic and intrinsic factors on customer satisfaction of XYZ bag owners.
2
(reliability, durability, serviceability, and perceived quality) on customer satisfaction and loyalty of XYZ bag owners.
STRUCTURAL EQUATION MODEL
Structural Equation Modeling (SEM) is one of the multivariate analysis to analyze the relationship between complex variables. SEM can perform a variety of tests of theoretical models such as confirmatory factor analysis and multiple regression. There are two types of variables in SEM, latent and indicator variables. Latent variable is a variable that cannot be measured directly but can be measured by one or more indicators while indicators can be measured directly (Bollen 1989). The models built in SEM consist of structural model and measurement model. Structural model is to explain the relationship between the cause variable (exogenous latent variable) and the effect variable (endogenous latent variable). While measurement model is to explain the operationalization of the theory or latent variable into indicators which is can be used to measure latent variable value (Kusnendi 2008).
The structural equation for latent variable model is: = � + �� + �
where,
B : mxm vector of coefficient matrix for latent endogenous variables
� : mxn vector of coefficient matrix for latent exogenous variables
: mxl vector of latent endogenous variables
� : nx1 vector of latent exogenous variables
� : mx1 vector of latent errors in equation
m : number of latent endogenous variables n : number of latent exogenous variables
While, the structural equation for measurement model is: = � +
= � � +
where,
y : px1 vector of observed indicator of latent endogenous variables
x : qx1 vector of observed indicator of latent exogenous variables
Ʌy : pxm vector of coefficient relating y to latent endogenous variables
Ʌx : qxn vector of coefficient relating x to latent exogenous variables
ɛ : px1 vector of measurement errors for y
δ : qxl vector of measurement errors for x
3 There are two types of errors in SEM namely errors associated with structural models and measurement models. Errors in structural models are represented by zeta (ζ) and errors in the measurement model are represented by epsilon (ɛ) for endogenous variables and delta (δ) for the exogenous variables.
METHODOLOGY
Data Source and Sampling Technique
The data used in this research is collected by a survey. The type of sampling technique used are snowball and purposive sampling. The data was collected among undergraduate students of Bogor Agricultural University (IPB). Purposive sampling was used because the population of IPB’s undergraduate students who owned XYZ bag is unknown. Snowball sampling was used because the ownership of goods, in this case bags, can be known by first asking people who own this bag, therefore respondents can connect the researchers to other respondents who also have XYZ bag. Respondents were approached one-by-one and were asked about the ownership of XYZ bag. This study used the undergraduate students of IPB as a sample because it is considered to represent the segmentation of XYZ, which is associated with female and male teens between 12 and 20 years old, oriented to urban sport, and from middle to upper level economic class. Although the main segmentation of XYZ is teenagers, in fact it is also suitable for college students and young executives because its design is still suitable for them. The total sample of this study is 300 XYZ owners because the model in this study have 4 latent variables where one of them is underidentified constructs (latent variable with fewer than three indicators). Therefore based on Hair et al. (2010) the minimum sample size is
300. The samples are taken from 36 Departments in IPB and from batch 2010 to 2014.
Methods The step of analysis conducted are:
1. Data preparation and exploration which describes the product. 2. Conceptualization of structural equation model was based on theory.
Garvin (1984) suggested that companies could compete on product quality dimensions, which include performance, features, reliability, conformance, durability, serviceability, aesthetics, and perceived quality. According to Hajjat and Hajjat (2014) these dimensions can also be identified as extrinsic and intrinsic value for customers. Extrinsic value can be felt before buying a product and intrinsic value can be felt after buying a product. The first include product performance, features, conformance and aesthetics and the second include product reliability, durability, serviceability, and perceived quality. Customers will be loyal with a brand if they are satisfied with the supplier or product (Fornell 1992). Thus, the latent variables are extrinsic and intrinsic value, customer satisfaction, and loyalty. The list of latent variables and their indicators can be seen in Appendix 1.
4
Path diagram helps to explain the causal relationship between the latent variables or structural model and between latent variable and its indicators or measurement model. The path diagram developed can be seen in Figure 1 while the matrix of structural and measurement model is included in Appendix 2.
Figure 1 Path diagram 4. Identifying the model using t-Rule.
According to Bollen (1989), if a parameter is not identified then a consistent estimator cannot be determined for this parameter. Parameter identification test using t-Rule is based on the formula:
� ≤ + + +
where t is the number of unknown parameters and (p + q) is the number of indicators.
5. Collecting data from XYZ bag owner with the following stages:
a. Making the conceptual questionnaires. The questionnaire consist of seven questions about the characteristics of respondents and 26 questions that will be used to measure the latent variables or known as indicator. The latent variables were developed based on the theory. Likert scale was used with a score of 1 to 5, where 5 indicates strongly agree and 1 indicates strongly disagree. The questionnaire can be seen in Appendix 3;
5 the validity while Cronbach Alpha method was used to check the reliability;
c. Distributing questionnaires to undergraduate students of IPB who owned XYZ bag based on purposive and snowball sampling techniques.
6. Conducting data exploration to analyze the customer’s characteristic about gender, faculty, batch, income per month, the place of purchase, type of bag purchase, and duration of use. Income per month and the place of purchase will explain the market segmentation of respondents.
7. Determining the input matrix to estimate parameters.
The input matrix used in this research was the covariance matrix because the indicators have the same scale and units.
8. Estimating parameters.
In this study, estimation of the parameters used Unweighted Least Squares (ULS). The ULS fitting function is:
���= ( ) � [ � − � ]
where,
S : sample covariance matrix of observed variables Σ(θ) : covariance matrix of model variables
According to Morata-Ramirez and Holgado-Tello (2013), ULS is a parameter estimation used for ordinal data and have a multivariate normal distribution. ULS is also recommended for data that has a small sample size (250 subjects). This study used ordinal data with Likert scale and the sample size is 300. Then check the normality of data by using a Qplot of standardized residuals. If the data are close to the 45 degree line, it can be say the data is normal distributed (Kusnendi 2008). The Qplot in Appendix 4 shows that the data is normal distributed.
9. Evaluating model fit with following step: a. Measurement model fit;
i. Indicator Validity
Valid indicators indicate that indicators measure the latent variables correctly. An indicator is valid when the t-value of loading factor is above 1.96 or the standardized loading factor is above 0.50 (Wijanto 2007). Moreover, to check multicolinearity between indicators it can be tested with a correlation test (Chatterjee and Hadi 2006). A correlation between 0.70 - 0.90 has a strong relationship (Dancey and Reidy's 2004). Thus, one of the indicators having high correlation should be removed in the model.
ii. Construct Reliability
6
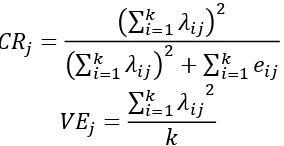
variable, λij is standardize loading factor ith indicator and jth latent variable, and ei is the measurement error of ith indicator in jth latent variable.
Construct reliability values greater than 0.70 or variance extracted values greater than 0.50 show that the variable has a good reliability (Wijanto 2007).
b. Structural model fit.
The evaluation of the structural model includes significance test of estimated coefficient. The relationship between variables is significant when the t-value is above 1.96 (Wijanto 2007).
c. Overall model fit;
SEM does not have the best statistical test that can explain the goodness of fit of the model like other multivariate analysis. This causes the development of several statistical tests to evaluate the goodness of fit of the model. Table 1 provides guideline for using fit indices based on Hair
et al. simulation that was used in this research, N applies to number of
respondents and (p+q) is the number of observed variables. Overall model fit is used both in measurement and structural model.
Table 1 Goodness of Fit
Goodness of Fit N > 250 and 12 < (p+q) < 30 Criteria for
Chi-square p-value less than 0.50
Comparative Fit Index (CFI) Above 0.92 Standardized Root Mean Square
Residual (SRMR) 0.08 or less (with CFI above 0.92) Goodness of Fit Index (GFI) Above 0.90
Source: Hair et al. (2010).
7
RESULTS AND DISCUSSIONS
Validity and Reliability of Questionnaire
Pretest was conducted to test the validity and reliability of the questionnaire. This test was conducted on 30 respondents. The test results show that all the indicators are valid at alpha 5% and all indicators of a latent variable is reliable with Cronbach Alpha value greater than 0.5. Validity and reliability value are shown in Appendix 5 and Table 2, respectively.
Table 2 Reliability of latent variables in the questionnaire Dimension and Latent
Variable Cronbach Alpha Dimension and Latent Variable Cronbach Alpha
Performance 0.76 Serviceability 0.62
Feature 0.65 Aesthetics 0.81
Reliability 0.75 Perceived Quality 0.94
Conformance 0.74 Satisfaction 0.86
Durability 0.77 Loyalty 0.86
Description of Respondents
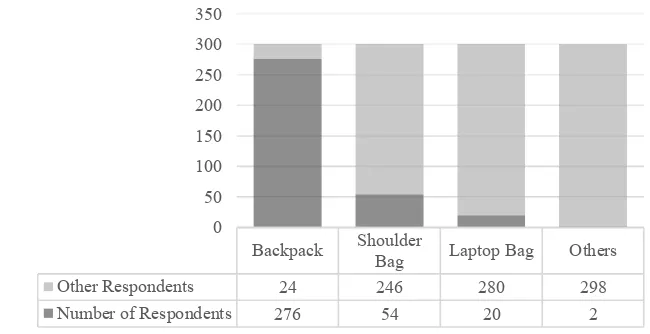
The respondents are undergraduate students of IPB who owned XYZ bag. The detail profiles of the respondents can be seen in Appendix 6. More than three-fourths of respondents (78.7%) were female. Most of them are students from batch 2013 with 109 respondents (36.3%) and from FMIPA with 126 respondents (42%). It was easier to get respondents from FMIPA faculty because it is the researcher’s faculty. See the bar chart at Figure 2. Almost all respondents (92%) had a backpack (the respondents can be have more than one type). It is not surprising because XYZ is more focuses on backpack than others and it popular with this type. In addition, half of them (59%) have used these bags for 1-5 years.
Figure 2 Distribution of respondents based on type of bag
The majority of respondents had an income Rp 500 000 – Rp 1 000 000 with Backpack ShoulderBag Laptop Bag Others
Other Respondents 24 246 280 298
8
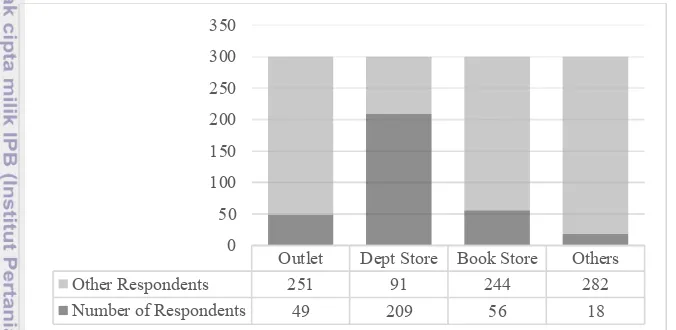
196 respondents (65.3%). It indicated that an economic class of respondents is middle level. Figure 3 explained the distribution of respondents based on place of purchase (the respondents can buy the bag in more than one place). Approximately two-third of them (69.7%) have bought the bag in Department Store. The percentages of respondents who bought the product in Book Store and Official Outlet are 18.6% and 16.3%. Only a few of respondents (6%) bought the product in other places such as traditional market and a bag store. This indicates that XYZ bag oriented to urban communities because the purchase proportion in modern market such as Department Store and Book Store more than buying in the traditional market (Sudarmadi 2007).
Figure 3 Distribution of respondents based on place of purchase
Parameter Estimation of Structural Equation Model
SEM is used to test the measurement model and structural model of the path diagram based on the theory. The result of identification using the t-Rule shows that the model used in this analysis is an over-identified model with t equal to 56. It means, the model created has a smaller number of estimated parameters than the number of data used. Structural equation model testing uses a two stage approach, first testing the measurement model and then testing the structural model.
Measurement model explains the relationship between latent variable and its indicators. Measurement model uses first order confirmatory factor analysis (CFA). First order CFA is a measurement model where the latent variable is only measured by its indicators and does not involve other latent variable (Kusnendi 2008).
The measurement model test results show that there is only one indicator having standardized loading factor less than 0.5, which is the resistance to water (X18). Afterwards, we check the Spearman correlation between indicators too. This is done to make sure that there are no multicollinearity between indicators. Spearman correlation between the indicators can be seen in Appendix 10. If a pair of indicators have a correlation above 0.7, one indicator will be removed by trial and error. Deletion will be performed on indicators having the most decreasing chi-square value in the measurement model. Therefore, there are four indicators that will be removed, namely design (X8), the likelihood of functionality (X20), the likelihood of reliability (X21), and consistency (Y5). Hence, there are five indicators
Outlet Dept Store Book Store Others
Other Respondents 251 91 244 282
9 deleted from the model based on standardized loading factor and Spearman correlation, namely X8, X18, X20, X21, and Y5. The standardized loading factor of measurement models can be seen in Appendix 7 which also explains visually by path diagram in Appendix 8 and 9 for initial and modified measurement model respectively. After modification, all indicators have standardized loading factor above 0.5 and t-value above 1.96.
The reliability of a latent variable is calculated based on the construct reliability or variance extracted. The results show that all the latent variables are reliable. It can be seen from the value of reliability construct greater than 0.70 and variance extracted greater than 0.50. The value of construct reliability and variance extracted can be seen in Table 3.
Table 3 Construct reliability of measurement model
Latent Variable Construct Reliability Variance extracted Result
Extrinsic Value 0.9 0.5 Reliable
Intrinsic Value 0.9 0.5 Reliable
Satisfaction 0.9 0.8 Reliable
Loyalty 0.8 0.7 Reliable
Fitting indices of the measurement model can be seen in Table 4. There is significant change between the initial and modified measurement model. Before modification, the model has square value 1303.11 then after modification, chi-square model is getting smaller, which is 590.28. Chi-chi-square value indicates that the modified model has a better fit with significant p value. Besides that CFI and GFI are high (1.00 and 0.99) and SRMR is low (0.051). Thus, it can be concluded that the modified measurement model is adequate.
Table 4 The fit indices of measurement model Goodness-of-Fit
Statistics (N = 300 and (p+q) = 26) Fit guideline values* Initial Measurement model Modify
Chi-square Smaller value 1303.11 590.28
Significant p-value Significant Significant
CFI Above 0.92 1.00 1.00
SRMR Less than 0.08 0.059 0.051
GFI Above 0.90 0.98 0.99
* Based on Hair et al. (2010).
10
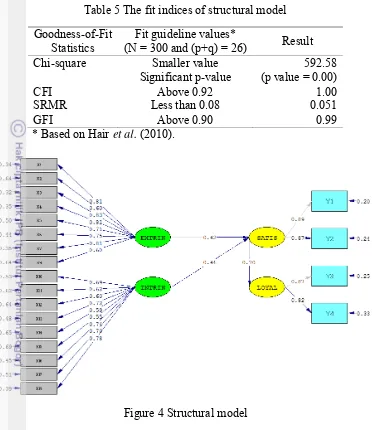
Table 5 The fit indices of structural model Goodness-of-Fit
Statistics (N = 300 and (p+q) = 26) Fit guideline values* Result
Chi-square Smaller value 592.58
Significant p-value (p value = 0.00)
CFI Above 0.92 1.00
SRMR Less than 0.08 0.051
GFI Above 0.90 0.99
* Based on Hair et al. (2010).
Figure 4 Structural model
Path diagram of structural model illustrated in Figure 4. Based on that figure, the indicators of product quality that have the greatest value to the extrinsic value is functionality (X3) with standardized loading factor 0.83. It indicates that the bag performance is very important for the customers. The intrinsic value of likely quality (X19) reach the highest value of standardized loading factor (0.78). It means that the high quality product will have great appreciation from the customers. Then the perceived quality is also important.
11 Table 6 Path coefficients between latent variables
Structural Relationship Path Coefficient t-value Result Extrinsic Value → Satisfaction 0.42 2.23 Significant Intrinsic Value → Satisfaction 0.46 2.42 Significant
Satisfaction → Loyalty 0.70 15.66 Significant
From path coefficient of structural model, it can be used to calculate the direct effect and indirect effect between latent variables. Direct effect is the directly effect from one variable to a second variable while indirect effect is the effect between two variables that mediated by one or more variables. Then total effect is sum of direct and indirect effect (Kusnendi 2008). See Table 7, based on the total effect, the extrinsic and intrinsic value are not statistically different at alpha 5%. Therefore the company is suggested to emphasize both extrinsic and intrinsic performance in order to increase customer satisfaction. At the end, it will increase the loyalty.
Table 7 Direct and indirect effects between latent variables
Structural Relationship Direct effect Indirect effect Total effect
Extrinsic Value → Satisfaction 0.42 - 0.42
Intrinsic Value → Satisfaction 0.46 - 0.46
Satisfaction → Loyalty 0.70 - 0.70
Extrinsic Value → Loyalty - 0.29 0.29
Intrinsic Value → Loyalty - 0.32 0.32
These results are relevant only for the IPB market segmentation. The research is based on IPB students having a specific market segmentation. Based on income and place of purchase, the respondents are urban college student that have a middle level economic class. The result might be different for upper level economic class, where the extrinsic and intrinsic value may have different effect.
CONCLUSIONS AND RECOMMENDATIONS
Conclusions
12
Recommendations
First, the company has to increase both extrinsic and intrinsic value to increase customer satisfaction. The increasing of customer satisfaction will lead to more loyal customer. Second, to have a broader conclusion, the respondent must be extended on other level of economic class.
REFERENCES
Bollen KA. 1989. Structural Equations with Latent Variables. New York (US):
John Wiley & Sons.
Chatterjee S, Hadi AS. 2006. Regression Analysis by Example. 4th Edition. New
Jersey (US): John Wiley & Sons.
Dancey C, Reidy J. 2004. Statistics without Maths for Psychology: Using SPSS for Windows. London (US): Prentice Hall.
Fornell. 1992. A National Customer Satisfaction Barometer: The Swedish Experience. Journal of Marketing. 56(1): 6-21.
Garvin DA. 1987. Competing on the Eight Dimensions of Quality. Harvard Business Review [Internet]. [download 2015 Feb 21]; November-December
1987:101-109. Available at:
http://cc.sjtu.edu.cn/G2S/eWebEditor/uploadfile/2013042709184994 4.pdf Hair JF, Black WC, Babin BJ, Anderson RE. 2010. Multivariate Data Analysis. 7th
Edition. New Jersey (US): Pearson Prentice Hall.
Hajjat MM, Hajjat F. 2014. The Effect of Product Quality on Business Performance in Some Arab Companies. Journal of Emerging Trends in Economics and Management Sciences. 5(5): 498-508.
Kusnendi. 2008. Model-Model Persamaan Struktural (Satu dan Multigroup Sampel dengan Lisrel). Bandung (ID): CV Alfabeta.
Morata-Ramirez MDA, Holgado-Tello FP. 2013. Construct Validity of Likert Scales through Confirmatory Factor Analysis: A Simulation Study Comparing Different Methods of Estimation Based on Pearson and Polychoric Correlations.
International Journal of Social Science Studies [Internet]. [download 2015 June
3]; 1(1): April 2013. Available at: http://dx.doi.org/10.11114/ijsss.vlil.27
Sudarmadi. 2007. 10 Pengusaha yang Sukses Membangun Bisnis dari 0. Jakarta (ID): PT Gramedia Pustaka Utama.
Tjiptono F. 2007. Pemasaran Jasa. Malang (ID): Banyumedia Publishing.
Wijanto SH. 2007. Structural Equation Modeling dengan Lisrel 8.8. Jakarta (ID):
13 Appendix 1 List of latent variables and indicators
Latent Variable Indicator Indicator Notation
Extrinsic Value �
Design and function X6
Price and quality X7
The main materials X10
Color main material X11
Zipper/magnetic clasp/drawstring X12
Comfortable for a long time used X16
Stitching X17
Resistance to water X18
Perceived Quality
Likely quality X19
The likelihood of functionality X20 The likelihood of reliability X21 Satisfaction � Expected quality Overall satisfaction Y1 Y2
Loyalty � Consider to loyal Recommendation Y3 Y4
14
15 Appendix 3 Questionnaire
INSTITUT PERTANIAN BOGOR
FAKULTAS MATEMATIKA DAN ILMU PENGETAHUAN ALAM DEPARTEMEN STATISTIKA
Jl. Meranti Wing 22, Level 4 Kampus IPB Dramaga-Bogor 16680
Kuesioner Penelitian
Terima kasih atas partisipasi Anda menjadi salah satu responden dalam penelitian saya Dewi Cahyani (G14110054), mahasiswa Departemen Statistika IPB, dengan judul penelitian Analysis of Customer Satisfaction Based on Extrinsic and Intrinsic Value. Saya sangat menghargai kejujuran Anda dalam mengisi kuesioner ini.
Identitas Anda akan dijamin kerahasiaannya dan hasil survey ini semata-mata hanya akan digunakan untuk tujuan penelitian, bukan komersial.
PENYARINGAN
(b) Department Store (contoh: Matahari, Ramayana)
16
Silang (X) setiap skor penilaian sesuai dengan penilaian Anda terhadap penyataan-pernyataan berikut
Keterangan:
17
No Pernyataan 1 2 Penilaian 3 4 5
H. PERSEPSI KUALITAS
1 Sangat besar kemungkinan tas XYZ akan berkualitas tinggi 2 Sangat besar kemungkinan tas XYZ akan berfungsi dengan baik 3 Sangat besar kemungkinan tas XYZ akan dapat diandalkan
I. KEPUASAN KONSUMEN
1 Kualitas tas XYZ sesuai dengan yang saya harapkan 2 Saya puas pada keseluruhan tas XYZ J. LOYALITAS KONSUMEN
1 Saya memikirkan akan setia pada tas XYZ 2 Saya merekomendasikan tas XYZ pada orang-orang terdekat saya 3 Saya akan tetap membeli tas XYZ walaupun banyak produk lain sejenis
18
Appendix 4 Qplot of standardized residuals
19 Appendix 5 Validity of each statement in the questionnaire
Dimension and
Latent Variable Indicator Coefficient Correlation
Performance X1 0.88
X2 0.74
X3 0.87
Feature X4 0.91
X5 0.82
Conformance X6 0.87
X7 0.90
Aesthetics X8 0.91
X9 0.90
Durability X10 0.75
X11 0.77
X12 0.87
X13 0.76
Serviceability X14 0.78
X15 0.85
Reliability X16 0.81
X17 0.74
X18 0.83
Perceived Quality X19 0.91
X20 0.85
X21 0.94
Satisfaction Y1 0.92
Y2 0.93
Loyalty Y3 0.94
Y4 0.84
20
Appendix 6 Profiles of the respondent
21 Appendix 7 Standardize loading factor of measurement model
22
24
Appendix 10 Spearman’s correlation between indicators
X1 X2 X3 X4 X5 X6 X7 X8 X9 X10
25 Appendix 10 (Continue) Spearman’s correlation between indicators
26
Appendix 10 (Continue) Spearman’s correlation between indicators
X21 Y1 Y2 Y3 Y4 Y5
27
BIBLIOGRAPHY
Dewi Cahyani was born in Kebumen (Central Java) as the eldest daughter of Dwi Eko Hartoyo and Chalimah on July 3rd, 1993. She lived and grew up in Bekasi (West Java). She was graduated from SMAN 31 Jakarta and SMPN 2 Bekasi and then continue her study in bachelor degree of IPB on 2011. She accepted in IPB by SNMPTN-Undangan.