SUPERVISOR DECLARATION
“I hereby declare that I have read through this report entitle “Study On Tracking Performance For Pollution Insulators By Using Salt Fog Test” and found that it has comply the partial fulfillment for awarding the degree of Bachelor of Electrical Engineering (Industrial Power)”
Signature :………..
Supervisor Name :………..
STUDY ON TRACKING PERFORMANCE FOR POLLUTION INSULATORS BY USING SALT FOG TEST
MUHAMMAD SHAFFIQ IZWAN BIN ABDUL AZIZ
A thesis submitted in fulfillment of the requirement for the Bachelor in Electrical Engineering (Industrial Power)
Faculty of Electrical Engineering
UNIVERSITI TEKNIKAL MALAYSIA MELAKA
STUDENT DECLARATION
I hereby declare that the content in this thesis entitle “Study On Tracking Performance For Pollution Insulators By Using Salt Fog Test” is the result of my own work except references and citations which I have clearly stated the sources of origin.
Signature :
ACKNOWLEDGMENTS
I would like to express my gratitude to En. Mohd Khairi Bin Mohd Zambri for his supervision, encouragement, suggestions and trust throughout the duration of this research.
A million thanks towards Dr. Aminudin Aman for the patience, his guidance, support and discussion that further encouraged and helped me a lot in my research.
My gratitude also to UTeM for providing the needed insulator samples used in this research. Also, I would like to thank Mr Wahyudi, High Voltage Laboratory UTeM technician for the help to handle the experimental works and prepare the apparatus during my research.
I would like to express my gratitude to my extraordinary colleague team who also use the High Voltage Laboratory UTeM for the support had been given me also help technically and mentally during the process of doing this project. It is to my advantage that I have received help and support from them. Thank you for giving me technical advice and idea to enhance my project. I give the greatest thanks and honors for those that had supported me so far.
ABSTRACT
ABSTRAK
Pencemaran prestasi sah penebat umumnya diuji dengan kaedah kabus wap. Walau bagaimanapun, suhu alam sekitar dalam ujian sangat berbeza, jadi kebarangkalian terhadap keputusan ujian adalah tinggi. Selain itu, pengaruh kekonduksian kabus air telah diambil direkodkan. Berbanding dengan kaedah kabus wap, kaedah sejuk kabus simulasi kabus semula jadi adalah lebih persis dengan keadaan operasi sebenar penebat talian penghantaran. Ini berkaitan dengan pengaruh kepadatan deposit garam (KDG) dan kekonduksian kabus air kepada prestasi pencemaran arka. Tahap pencemaran adalah pertimbangan air nisbah dengan garam.
TABLE OF CONTENT
CHAPTER TITLE PAGE
ACKNOWLEDGEMENT ii
ABSTRACT iii
LIST OF CONTENT v
LIST OF FIGURES vii
LIST OF TABLES ix
LIST OF ABREVIATIONS x
1 INTRODUCTION
1.1 Project Background 1.2 Motivation
1.3 Problem Zstatement 1.4 Objective 1.5 Scope 1 3 4 5 5
2 LITERATURE REVIEW
2.1 Review Of Previous Related Works 2.2 Test Equipment
2.3 Standardization 2.4 Specifications
7 8 9 11
3 METHODOLOGY
3.1 Test Facilities, Samples And Test Procedures 3.2 Test Method
3.2.1 Experimental Setup 3.2.2 Salt Fog Technique 3.2.3 Measuring Unit Box 3.3 Safety Procedure
3.3.1 Laboratory Procedure 3.3.2 Interlock System 3.3.3 User Safety 3.3.4 Equipment Safety 3.4 Supply Setup
3.4.1 Hv Supply 3.4.2 Capacitor 3.4.3 Discharge Rod 3.4.4 Displayed
3.4.5 Control And Trigger Unit
3.5 Testing Procedure 3.6 Work Description
3.6.1 Methodology Process 3.6.2 Key Milestone
31 32 32 35
4 EXPECTED RESULT
4.1 Introduction
4.2 Leakage Current Acquisition & Measurement System 4.3 Graphical Result
4.3.1 Light Contaminant 4.3.2 Medium Contaminant 4.3.3 Heavy contaminant 4.3.4 Analysis Data 4.4 Measuring Unit Simulation 4.4.1 Laboratory Simulation
36 37 38 38 40 43 45 47 47
5 CONCLUSION
5.1 Summary Of Project 5.2 Achievement Of Project 5.3 Achievement Of Research 5.4 Recommendation
52 53 53 53
REFERENCES 55
LIST OF FIGURE
FIGURE TITLE PAGE
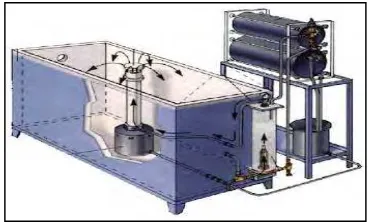
2.1 Example of salt fog tested chamber 9
2.2 Standardization of salt fog test chamber 9
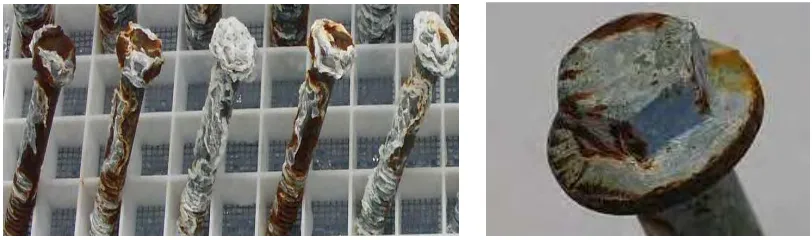
2.3 Corrosion in metal after Salt Fog Tested 10 3.1 Configuration of sample type A (SIR) 14 3.2 Configuration of sample type B (Porcelain) 14 3.3 Configuration of sample type C (Glass) 15
3.4 Salt fog on the chamber 16
3.5 Conventional of test circuit 18
3.6 Simplified of equivalent of conventional of test circuit 18 3.7 Schematic Diagram Inside Measuring Box 20
3.8 Measuring Unit Box 20
3.9 HV structure for AC Configuration 25
3.10 HV supply (a) test transformer (b) regulating transformer 26
3.11 Energy storage capacitor 27
3.12 Discharge Rod 28
3.13 Digital Phosphor Oscilloscope 28
3.14 OT 276 29
3.15 DMI 551 30
3.17 Methodology flow chart 33
3.18 Experiment procedure flow chart 34
LIST OF TABLE
TABLE TITLE PAGE
3.1 Type and characteristic of material used 14 3.2 Project progress and duration for each step 35 4.1 Result for Testing Insulator with Light Contaminant 39
LIST OF ABREVIATIONS
AC - Alternating Current
AEC - Artificial Environmental Chamber C - Capacitor
cm - centimetre
CT - Current Transformer DAQ - data acquisition device DC - Direct Current
EPDM - Ethylene Propylene Diene Monomer EPR - Ethylene Propylene Rubber
ESDD - Equivalent Salt Deposit Density FOV - Flashover Voltage
FFT - Fast fourier transform
Hz - Hertz
IEC - International Electrotechnical Commision
kg - kilogram
kS/s - kilosamples per second kV - kilovolts
LV - Low Voltage m3 - cubic metre mA - miliampere ml - mililitre mm - milimetre min - minute
NSDD - Non-soluble Salt Deposit Density PC - Personal Computer
R - Resistor
Rad - Radian
RH - Relative Humidity rms - root- mean- square SIR - Silicone Rubber
CHAPTER 1
INTRODUCTION
1.1 Project Background
At present, by using salt fog method, the contamination of flashover performance of insulator can be tested. The test leads to a rather big difference between the temperature of the real environment and the high temperature of the test environment (more than 25°C). Moreover, the salt fog conductivity has influenced the test method. The real environment temperature is below 12°C (<12°C) when it is sprayed [1]. Fog-water conductivity is differs depending on the district, the season and environmental contamination. For example, fog-water conductivity is as high in seriously polluted districts, in suburbs, and in outer suburban districts [2]. Therefore compared with the traditional salt-fog method, the suitable method can be use for the research of the contamination flashover performance of insulators and fog-water conductivity is a fresh-fog method. It is more suitable for specific reasons.
papers, and the results show that flashover performance is increases with the decreased the salt density [3]–[7]. It can be expressed by refer to the power function. The influence of non-soluble deposit density (NSDD) into the method also been studied [8]-[10]. For this additional, the result show that the flashover performance is increases with the decreased the non-soluble density. It is also can be expressed by the power function.
Scholars have discovered that the non-uniform contamination distribution between the top and bottom surfaces of insulators has great impact on the PFV. This finding has been studied further in papers [11][12]. The results show that the PFV increases with the increase of non-uniform contamination distribution degree. The influence of atmospheric pressure on PFV has been studied in papers, and the results indicate that PFV decreases with the decrease of atmospheric pressure, which can be expressed by a power function[13]–[18]. The research results of papers show that PFV decreases by 0.7–1.0% when the environmental temperature increases by 1°C within the range, from 5°C to 35°C [19][20]. The influence of contaminating ingredients on PFV has been analysed in papers, and the results of these studies indicate that under the same SDD, PFV varies with different contaminating ingredients [21]–[23]. The influence of acid rain on PFV has also been studied in papers [24][25], and the results show that PFV decreases with the increase of acidity. There are many other factors influencing PFV, such as the profile of the insulators, the materials, the arrangement of the insulators, string length and the environmental parameters [26]-[28]. It can be seen that several factors influencing PFV have been studied. However, the previous studies barely touched on the flashover performance of polluted insulators in cold fog and the influence of fog-water conductivity on the flashover performance of polluted insulators.
This paper attempts to address the said issue. The influence of SDD and fog-water conductivity on the AC contamination flashover performance of typical porcelain, glass and composite insulators under cold foggy conditions will be studied in this paper. The contamination flashover performance will be analysed under different fog-water conductivity conditions. The correction coefficient indicating the influence of fog-water conductivity on U50 will be proposed. The steam-fog method and the cold-fog method will be analysed and compared. This paper is expected to provide a basis for the selection and design of the external insulation of transmission lines.
Many studies have been done to examine the effect of ceramic insulator design under various conditions of wetting. For example, in desert conditions, open profile or aerodynamic designs have been found to perform well when compared to designs having ribs [1]. On the other hand in salt fog conditions, a bell shape design or designs having deep ribs on the underside of the insulator, example of fog type insulators, perform better in coastal areas than open designs. The shed spacing to diameter ratio, shed inclination angle, and protected creepage distance are the various design parameters that have been studied and shown to be important in insulator performance [2,3].
The measurement of flashover voltage and the distribution of pollution density have been used to study the various aspects of insulator design in ceramic insulators [2]. With non-ceramic insulators, less attention has been given to weather shed design. Most of the research has concentrated on the material composition rather than on the design of the weather sheds. As a result, it is not yet entirely clear if insulator design affects the long-time performance of polymer insulators. Research conducted (by Ontario Hydrc) in clean fog concluded that insulator design has a negligible effect on insulator flashover [4]. However, it is believed that when insulators are contaminated and cleaned under natural conditions, their performance will be dependent on weather shed design. On the other hand, the research done at NGK indicated that alternating shed designs showed better contamination performance than straight sheds [5]. Znaidi studied the effect of weather shed design on accumulation of contamination for both ceramic and non-ceramic insulators in actual field and laboratory conditions [6].
Chemey and Stonkus studied the effect of the form factor (L/A where L is the leakage distance and A is the surface area) on the performance of polymer insulators [8].
The leakage current decreased with an increase in the form factor. Measurement of flashover voltage [4], distribution of pollution density [5,6], and leakage current [7,8] have been used to study the effect of insulator design in polymer insulators. Leakage current, during various types of tests, has been measured and analyzed by various researchers. It has been observed that by studying the various components of the leakage current more information on specific characteristics can be obtained. Suds studied the leakage current harmonic components for ceramic insulators in clean-fog. [9]. He noticed that the likelihood of flashover became higher when the peak leakage current and the magnitude of odd-order harmonic components exceeded a particular level. Karady et al. [10] also studied the correlation of the harmonic content of the leakage current to flashover in clean fog. The FFT analysis of the leakage current showed that the harmonic content increased suddenly before flashover. Fernando and Gubanski conducted a detailed leakage current analysis on non-ceramic insulators in clean fog [11-14]. The measured leakage currents were found deformed from sinusoidal shape. However, the measured levels were much lower than the level of leakage current that precede flashover. These deformed waveforms contained a significant third and fifth harmonic components and their content increased with the applied voltage.
1.3 Problem Statement
voltages, compulsory handling steps and safety precaution need to be taken when handling the equipment. The safety precautions cover the laboratory safety, equipment, safety and user safety. Therefore, the standard test procedure accordingly to international standard is vital to be complied and must follow to get reliable results. And it’s also referring to the British Standard Institution. Selection guide for polymeric materials for outdoor use under HV stress. PD IEC/TR 62039.2007 [6]. The minimum dielectric strength to be fulfilled for outdoor high voltage polymeric insulation shall not be less than 10kV/mm. In order to do testing on the dielectric strength of the polymer insulation, the international standard BS EN 60243-1:1998 is used. [7].
1.4 Objective of Study
The main objective of this project is:
1) To investigate the void around the insulator
2) To investigate the leakage current around the insulator
3) To analyze the condition of insulator when adjusted conductivity and maintain the HV or maintain the conductivity and adjusted HV.
1.5 Scope of Study
CHAPTER 2
LITERATURE REVIEW
2.1 Review of Previous Related Works
From the previous related research about salt fog test stated about the parameter and characteristic of salt fog test example of research of Farouk A. M. Rizk in April 1985 with research title Influence of AC Source Parameters on Flashover Characteristics of Polluted Insulators. This paper stated about systematic experimental investigation into the influence of AC test source parameters on the leakage current pulses, voltage fluctuations and flashover voltages of polluted insulators. The test techniques include both salt-and clean-fog methods, while the test insulators comprise long-rod and cap and pin strings of different lengths as well as support columns. Whenever possible the tests results are compared with the predictions of computer modeling of the phenomena involved.
paper also stated the polymeric insulators are gaining acceptability all over the world rapidly because of their advantages over ceramics. This paper is an effort towards introduction of polymeric insulators in Pakistan. In it, the behavior of polymeric insulators under the effect of UV radiation, temperature, electric stress and humidity with specific reference to Pakistani environment was observed and analyzed.
The last related works taken from A. H. El-Hag in 2001 with title research a Design Parameters of Weather sheds That Affect The Ageing of Polymer Insulators In Salt-Fog. This research mention the results of a study in which the third harmonic ti-equency component of leakage current is used to study various design parameters of weather sheds that affect the ageing of polymer insulators in salt-fog. Salt-fog was applied to model insulators for 120 hours at two different conductivity levels, i.e. 1000 pS/cm and 2000 pS/cm as an aging test. The effect of the number of sheds and shed inclination angle on the aging performance of polymer insulators was studied. Model insulators having 2-Sheds showed better performance than 4-Sheds. Also, the shed inclination angle improved the performance of the insulators in salt-fog.
2.2 Testing equipment
Test has been performed with standardize of 5% solution of NaCl (Natrium Cloride) are known as NSS (neutral salt spray). Results are represented generally as testing hours in NSS without appearance of corrosion products (e.g. 720 h in NSS according to ISO 9227). Other solutions are acetic acid (ASS test) and acetic acid with copper chloride (CASS test), each one chosen for the evaluation of decorative coatings, such as electroplated copper-nickel-chromium, electroplated copper-nickel or anodized aluminum.
Some sources do not recommend to use ASS or CASS test cabinets interchangeably for NSS tests, as it is claimed that a thorough cleaning of the cabinet after ASS or CASS test is very difficult. ASTM does not address this issue, but ISO 9227 does not recommend it and if it is to be done, advocates a thorough cleaning.
Figure 2.1 : Example of salt fog tested chamber[29]
[image:22.595.212.398.615.726.2]2.3 Standardization
The standard of chamber construction, testing procedure and testing parameters are standardized under national and international standards, such as ISO 9227 and ASTM B 117. These standards are describe the necessary information to carry out this test, example of testing parameters such as temperature, air pressure of the sprayed solution, preparation of the spraying solution, concentration, pH, and other else. Daily checking of testing parameters is necessary to show compliance with the standards, so records shall be maintained according the standard requirement. The standard requirement is produce by ISO 9227 and ASTM B 117 and it is widely used as reference standards.
[image:23.595.102.508.277.397.2]
Figure 2.3 : Corrosion in metal after Salt Fog Tested
Testing cabinets are manufactured according to the specified requirements here. However, these testing standards neither provide information of testing periods for the coatings to be evaluated, nor the appearance of corrosion products in form of salts. Requirements shall be agreed between customer and manufacturer. In the automotive industry requirements are specified under material specifications. Different coatings have different behavior in salt spray test and consequently, test duration will differ from one type of coating to another. For example, a typical electroplated zinc and yellow passivated steel part lasts 96 hours in salt spray test without white rust. Electroplated zinc-nickel steel parts can last more than 720 hours in NSS test without red rust (or 48 hours in CASS test without red rust) Requirements are established in test duration (hours) and coatings shall comply with minimum testing periods.
2.4 Specifications
Salt spray tested chamber is referring the standard from ISO 9227 and ASTM B 117 for the specification in term of performance and parameter used. The some specification state in that standard are:
1. Temperature range Adjustable from ambient to +50°C/+122°F
2. Salt spray fall-out rates Adjustable from 0.5 to 2.5 ml per 80 cm2 per hour
3. Wetting mode (Premium chambers only) Adjustable from ambient to +50°C/+122°F 4. Drying mode (Premium chambers only) Adjustable from ambient to +50°C/+122°F 5. Cyclic corrosion test chamber performance
6. Wetting mode Temperature range Adjustable from ambient to +60°C/+140°F Humidity range Fixed at 95% - 100%
7. Salt spray mode Temperature range Adjustable from ambient to +50°C/+122°F Salt spray fall-out rates Adjustable from 0.5 to 2.5 ml per 80 cm2 per hour