CHAPTER 2
LITERATURE REVIEW AND THEORETICAL BACKGROUND
2.1. Literature Review
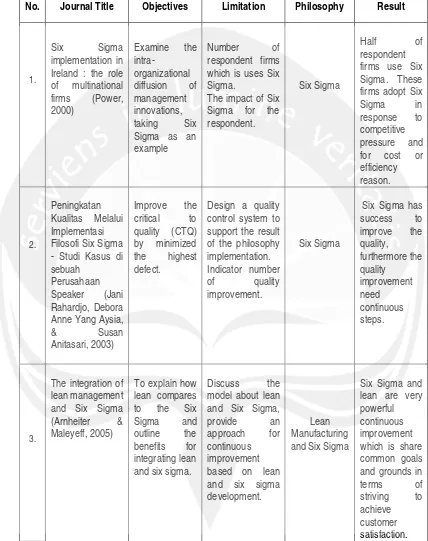
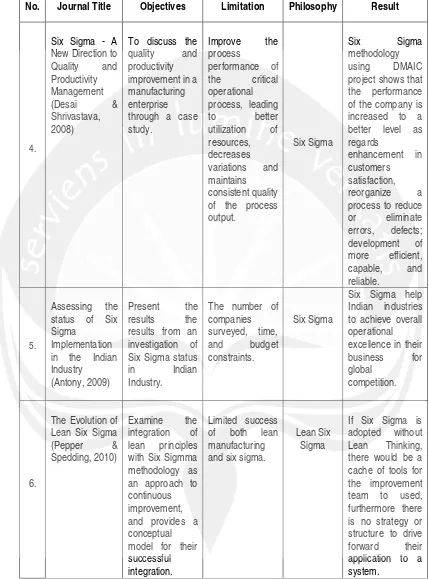
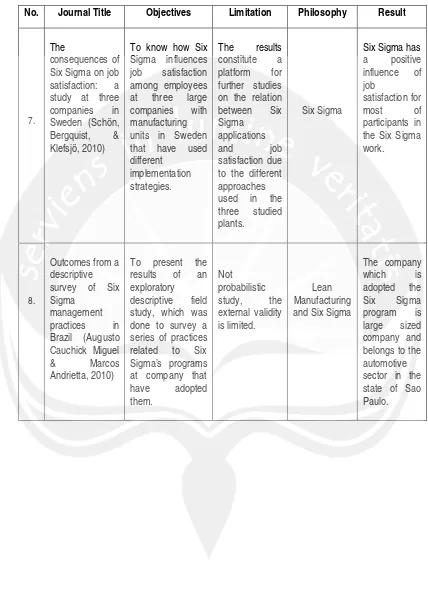
Six Sigma is known as the philosophy, which objectives are increase customer satisfaction and reorganize the process to reduce errors and defect (Desai & Shrivastava, 2008; Arnheiter & Maleyeff, 2005). The other objectives are to improve the quality and to continue step of improvement (Jani et al., 2003). The case study of implementation Six Sigma has been proven in Indian industries, multinational firms in Ireland, and some companies in Sweden (Schön, Bergquist, & Klefsjö, 2010; Antony, 2009; Power, 2000), which results are to achieve overall operational excellence in their business for global competition (Antony, 2009) and to reduce cost (Power, 2000).
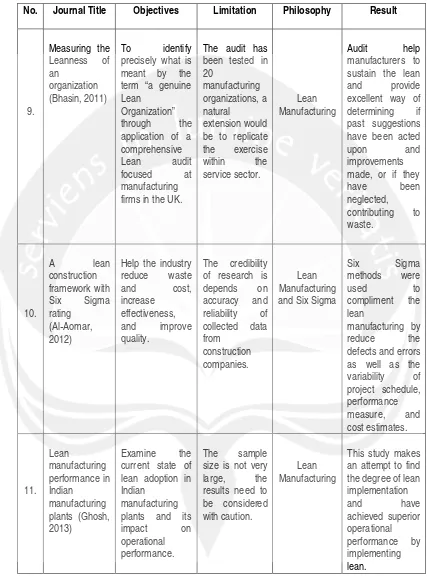
The other philosophy is Lean Manufacturing, which objectives are to achieve superior operational performance (Ghosh, 2013) to identify the meager points in manufacturing system and to manage resource flexibility (Chauhan, 2013). The case study of Lean Manufacturing implementation written by (Bhasin, 2011)is talking about measuring the leanness of an organization. The objectives of the journal is to identify precisely what is meant by the term “a genuine Lean Organization” through the application of a comprehensive Lean audit focused at manufacturing firms in the UK (Bhasin, 2011).
Nowadays, lean is integrated with Six Sigma. It has assisted organization to achieve high level continuous improvement activity and better saving in terms of operation and quality cost. Many industries and companies are recognizing the powerful synergy produced when these two quality initiatives are combined. Lean Six Sigma (LSS) (combining two most important improvements) focuses on operational excellence for continually improvement in customer satisfaction, saving in quality cost, process speed and in turn against competitive advantage. Lean Six Sigma is the latest of the managerial practices. It helps in creating value by reduce the waste and cost, increase effectiveness, and improve the quality (Al‐Aomar, 2012). One case study of LSS implementation is the implementation of LSS in automotive industry (Augusto & Marcos, 2010).
success in the implementation of LSS, a study of the empirical analysis is needed to determine the critical success factors (CSFs) of LSS.
Six Sigma is related to the Lean Manufacturing, if Six Sigma is adopted without Lean Thinking, there would be a cache of tools for the improvement team to used, furthermore there is no strategy or structure to drive forward their application to a system (Pepper & Spedding, 2010).
Table.2.1. Lean Manufacturing, Six Sigma, and Lean Six Sigma Papers Classification
No. Journal Title Objectives Limitation Philosophy Result
1.
Six Sigma
implementation in Ireland : the role of multinational firms (Power, 2000)
Examine the
intra-organizational diffusion of management innovations, taking Six Sigma as an example
Number of
respondent firms which is uses Six Sigma.
The impact of Six Sigma for the respondent.
Six Sigma
Half of
respondent firms use Six Sigma. These firms adopt Six Sigma in response to competitive pressure and for cost or efficiency reason.
2.
Peningkatan Kualitas Melalui Implementasi Filosofi Six Sigma - Studi Kasus di sebuah
Perusahaan Speaker (Jani Rahardjo, Debora Anne Yang Aysia, & Susan Anitasari, 2003)
Improve the critical to quality (CTQ) by minimized the highest defect.
Design a quality control system to support the result of the philosophy implementation. Indicator number of quality improvement.
Six Sigma
Six Sigma has success to improve the quality, furthermore the quality improvement need continuous steps. 3.
The integration of lean management and Six Sigma (Arnheiter & Maleyeff, 2005)
To explain how lean compares to the Six Sigma and outline the benefits for integrating lean and six sigma.
Discuss the model about lean and Six Sigma, provide an approach for continuous improvement based on lean and six sigma development.
Lean Manufacturing and Six Sigma
Table.2.1. (Continued)
No. Journal Title Objectives Limitation Philosophy Result
4.
Six Sigma - A New Direction to Quality and Productivity Management (Desai & Shrivastava, 2008)
To discuss the quality and productivity improvement in a manufacturing enterprise through a case study.
Improve the process
performance of the critical operational process, leading to better utilization of resources, decreases variations and maintains consistent quality of the process output.
Six Sigma
Six Sigma
methodology using DMAIC project shows that the performance of the company is increased to a better level as regards
enhancement in customers satisfaction, reorganize a process to reduce or eliminate errors, defects; development of more efficient, capable, and reliable.
5.
Assessing the status of Six Sigma
Implementation in the Indian Industry
(Antony, 2009)
Present the results the results from an investigation of Six Sigma status in Indian Industry.
The number of companies surveyed, time, and budget constraints.
Six Sigma
Six Sigma help Indian industries to achieve overall operational excellence in their business for global
competition.
6.
The Evolution of Lean Six Sigma (Pepper & Spedding, 2010)
Examine the integration of lean principles with Six Sigmma methodology as an approach to continuous improvement, and provides a conceptual model for their successful integration.
Limited success of both lean manufacturing and six sigma.
Lean Six Sigma
Table.2.1. (Continued)
No. Journal Title Objectives Limitation Philosophy Result
7. The
consequences of Six Sigma on job satisfaction: a study at three companies in Sweden (Schön, Bergquist, & Klefsjö, 2010)
To know how Six Sigma influences job satisfaction among employees at three large companies with manufacturing units in Sweden that have used different
implementation strategies.
The results constitute a platform for further studies on the relation between Six Sigma
applications
and job
satisfaction due to the different approaches used in the three studied plants.
Six Sigma
Six Sigma has a positive influence of job
satisfaction for
most of
participants in the Six Sigma work.
8.
Outcomes from a descriptive survey of Six Sigma
management practices in Brazil (Augusto Cauchick Miguel & Marcos Andrietta, 2010)
To present the results of an exploratory descriptive field study, which was done to survey a series of practices related to Six Sigma’s programs at company that have adopted them.
Not probabilistic study, the external validity is limited.
Lean Manufacturing and Six Sigma
Table.2.1. (Continued)
No. Journal Title Objectives Limitation Philosophy Result
9.
Measuring the Leanness of an
organization (Bhasin, 2011)
To identify precisely what is meant by the term “a genuine Lean
Organization” through the application of a comprehensive Lean audit focused at manufacturing firms in the UK.
The audit has been tested in 20
manufacturing organizations, a natural
extension would be to replicate the exercise within the service sector.
Lean Manufacturing
Audit help manufacturers to sustain the lean and provide excellent way of determining if past suggestions have been acted
upon and
improvements made, or if they
have been
neglected, contributing to waste.
10.
A lean
construction framework with Six Sigma rating
(Al‐Aomar, 2012)
Help the industry reduce waste
and cost,
increase effectiveness, and improve quality.
The credibility of research is depends on accuracy and reliability of collected data from
construction companies.
Lean Manufacturing and Six Sigma
Six Sigma
methods were
used to
compliment the lean
manufacturing by reduce the defects and errors as well as the variability of project schedule, performance measure, and cost estimates.
11. Lean
manufacturing performance in Indian
manufacturing plants (Ghosh, 2013)
Examine the current state of lean adoption in Indian
manufacturing plants and its
impact on
operational performance.
The sample size is not very large, the results need to be considered with caution.
Lean Manufacturing
This study makes an attempt to find the degree of lean implementation
and have
Table.2.1. (Continued)
No. Journal Title Objectives Limitation Philosophy Result
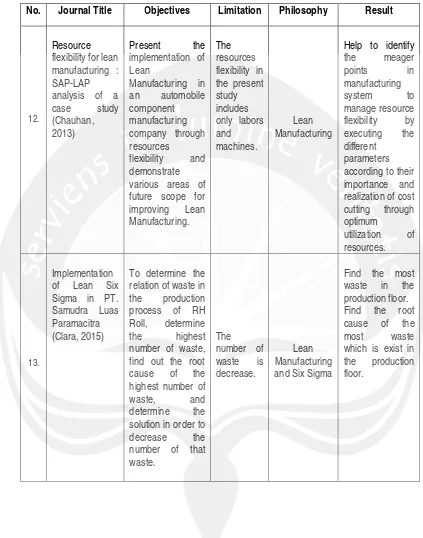
12.
Resource flexibility for lean manufacturing : SAP-LAP analysis of a case study (Chauhan, 2013)
Present the implementation of Lean
Manufacturing in an automobile component manufacturing company through resources
flexibility and demonstrate various areas of future scope for improving Lean Manufacturing.
The resources flexibility in the present study includes only labors and machines.
Lean Manufacturing
Help to identify the meager
points in
manufacturing
system to
manage resource flexibility by executing the different
parameters according to their importance and realization of cost cutting through optimum
utilization of resources.
13.
Implementation of Lean Six Sigma in PT. Samudra Luas Paramacitra (Clara, 2015)
To determine the relation of waste in the production process of RH Roll, determine the highest number of waste, find out the root cause of the highest number of waste, and determine the solution in order to decrease the number of that waste.
The number of waste is decrease.
Lean Manufacturing and Six Sigma
2.2. Theoretical Background
Lean and Six Sigma method has been implemented in some company, such as industrial company in Brazil (Augusto & Marcos, 2010). Lean Six Sigma’s method has been published in the international journal, furthermore there is no journal which is explain about the case study of Lean Six Sigma. In this research, the objective is to decrease the number of waste using the theory of Six Sigma and Lean Manufacturing.
2.2.1. Lean Manufacturing
Lean Manufacturing is one of the philosophies which is used to implement continuous improvement in industrial company. This philosophy is originated in Toyota Production System, Japan since 1970 (Gremyr & Fouquet, 2012). It has enabled many organizations to reach unparalleled levels of excellence. According to Fortune Magazine in Fallis (2013), Toyota made 50% more cars in 2005 than what it did in 2001. It earned $11.4 billion more than all the major manufacturers combined and out of the 10 highest quality rated cars that run in America, 7 were made by Toyota at a time when GM was deemed close to declaring bankruptcy and Ford was mired in financial problems and had to lay off 30,000 employees. These kinds of successful results have made Toyota Motor Company to become the most benchmarked organization in the world.
According to Fallis (2013), Lean focuses on satisfying customers while improving productivity, reducing lead time, reducing manufacturing and product cost, and increasing inventory floor space, reducing new product time to market, and improving the cost of quality. These are done by implementing a strategy that constantly seeks a continuous improvement through the identification of the non-value-added activities (wastes).
Lean needs no advanced statistical training or certified Black and Green Belts. Self-empowerment and responsibility are as important as team building and team efforts. There is no trace in the academic literature of the application of Lean tools in engineering departments (Arnheiter & Maleyeff, 2005). There are seven wastes know (Ghosh, 2013; El-Namrouty, 2013), such as :
a. Overproduction
This increases the risk of obsolescence and the risk of producing the wrong thing. It tends to lead to excessive lead time and storage capacity. In addition, it leads to excessive work-in-process stocks which result in the physical dislocation of operations with consequent poorer communication.
b. Inventory
It means having unnecessarily high levels of raw materials, works-in-process and finished products. The excessive inventory give a negative impact for companies seen in the delayed cash flow, due to excessive number of stocks and non-valuable room which is used as stock room. All products assigned as the inventory products provide non added value. The most significant benefits of the implementation lean concept for this waste is the delayed plan to add more space for stocks.
c. Motion
Ineffective motion caused by several factors, such as: irregular work processes, non-effective plant’s layout, maintenance problems of the machine, there is no work method, and there is no standard of work which is well documented and properly. In order to recognize the waste of labor movements, we have to observe the operator during working time, about how they use their hands and feet. Based on the observations, the arrangements of components and equipments have to be conceivable.
d. Waiting
Waiting time to the arrival of material, information, equipment, fixtures, and all the things which make the organization to stop their process are the waste. Moreover, when the operators just stand beside the machine to control the running of machine, it also counted as waste in the waiting. Lean manufacturing system implement just in time philosophy for all resources in the company in order to make the all things get in the right time.
e. Transportation
f. Defect
The waste of Defects is defined as quality defects resulting in rework or scrap. Defective product could be the result of a naturally occurring defect, such as a knot in a wood product, or it can be a defect caused in the manufacturing process. Regardless of the cause of the defect, one of two things needs to happen; the part either needs to be disposed of and a new part needs to be created to replace the defective part, or the part needs to be sent back through all or part of the manufacturing process to fix the defect.
g. Over-processing
The waste of Inappropriate Processing is defined as using overqualified and incorrect equipment to complete a processing step. Some products are also inappropriately placed on machines, therefore receiving the incorrect production step; resulting in scrapping the product or redoing/reworking as an added wasteful process.
2.2.2. Six Sigma
After World War II, Edwards Deming helped Japanese people to revitalize their industries by focusing on quality. The approach called as Total Quality Management (TQM). This approach attempt to reduced cost, improved customer satisfaction, and facilitated greater growth and profitability. After successes with Japanese industries, Deming attempt to implement this approach in U.S.
In the mid-1980, some of the business community had become impatient and disenchanted with TQM. Continuous improvement is worthwhile, but it wasn’t producing the great financial results that had been expected. Moreover, Six Sigma has become the solution of this problem. Six Sigma is a methodology which is developed at Motorola. In 1989, Motorola set the objective which the defect rate is 3.4 parts per million.
According to Desai & Shrivastava (2008), Six Sigma is a business performance improvement strategy that aims to reduce the number of mistakes/defects to as low as 3.4 occasions per million opportunities. Sigma is a measure of “variation about the average” in a process which could be in manufacturing or service industry. The benefits and advantages of Six Sigma are lowering the cost of loss, improving product’s quality and customer satisfaction; reducing secondary process (rework) and claim; making decisions based on the data; applying in all fields of both industry and services; focusing on the product, process, and people; affect the investment; give impact to the cost; and processing the data using statistics, through the analysis of experimental data becomes clear.
The methodology of Six Sigma is DMAIC (Define, Measure, Analyze, Improve, and Control) methodology. The explanations about DMAIC method according to Desai & Shrivastava (2008) are:
a. Define
The implementations in this stage are determines the objectives and the scope of the project, collect information on the process and the customers, and specify the deliverables to customers (internal and external).
b. Measure
This phase presents the detailed process mapping, operational definition, data collection chart, evaluation of the existing system, assessment of the current level of process performance.
c. Analyze
This phase describes the potential causes identified which have the maximum impact on the low process yield, cause and effect diagram, Pareto analysis of the causes, FMEA analysis which leaded to identify the vital few factors in order to identify the root cause of the problems and to examine the processes that affect the CTQ.
d. Improve
This stage discuss about the ideas for perform a repair based on the analysis that has been done. Moreover, conducted an experiment to see whether the results have been effective or not yet. If the result is effective, it can be standardized in a standard operating procedure.
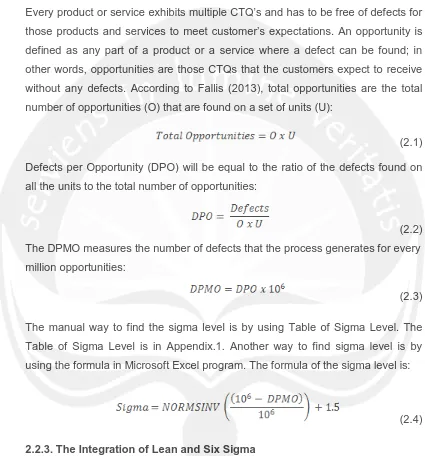
This last stage is to make a plan and design measurement of the results. The improvements are already made to be monitored on an ongoing basis. The key point to survive in an increasingly fierce business competition is trying to keep management of the balance between quality, cost, and on time delivery. Every product or service exhibits multiple CTQ’s and has to be free of defects for those products and services to meet customer’s expectations. An opportunity is defined as any part of a product or a service where a defect can be found; in other words, opportunities are those CTQs that the customers expect to receive without any defects. According to Fallis (2013), total opportunities are the total number of opportunities (O) that are found on a set of units (U):
(2.1) Defects per Opportunity (DPO) will be equal to the ratio of the defects found on all the units to the total number of opportunities:
(2.2) The DPMO measures the number of defects that the process generates for every million opportunities:
(2.3)
The manual way to find the sigma level is by using Table of Sigma Level. The Table of Sigma Level is in Appendix.1. Another way to find sigma level is by using the formula in Microsoft Excel program. The formula of the sigma level is:
(2.4)
2.2.3. The Integration of Lean and Six Sigma
The aim of Lean and Six Sigma integration is to achieve improvement target of organization in every opportunity. Whereas Six Sigma is only implemented by few specific individuals within a company, lean levels the empowerment and education of everyone in the organization and competing for the same resources (Pepper & Spedding, 2010).
When implemented as a stand-alone philosophy, there is a limit to the scope and size of improvements achieved through the application of lean principles. Pepper & Spedding (2010) suggest that this “ceiling” of improvement is reached because the strategy used for improvement depends on the problem trying to be solved, and therefore must be aligned to achieve effective results. Pepper & Spedding (2010) go on to suggest that this is a result of lean principles lacking a directed, cultural infrastructure as can be seen with the Six Sigma approach.
Both approaches have the same end objective, i.e. to achieve quality throughout, whether it is customer service, the product, the process or training and education of the workforce. They are effective on their own, but organizations may well find that after initial improvement, they reach a plateau; and find it difficult to create an ongoing culture of continuous improvement (Pepper & Spedding, 2010). To overcome this, the lean approach must integrate the use of targeted data to make decisions and also adopt a more scientific approach to quality within the system. Six Sigma, on the other hand, needs to adopt a wider systems approach, considering the effects of muda on the system as a whole; and therefore quality and variation levels (Pepper & Spedding, 2010).
2.2.4. Tools for Implementation Lean
The tools which are used to implement Lean Manufacturing are below: a. Benchmarking Process
employed in conducting a benchmarking project, such as internal, competitive/similar industry, and best practice.
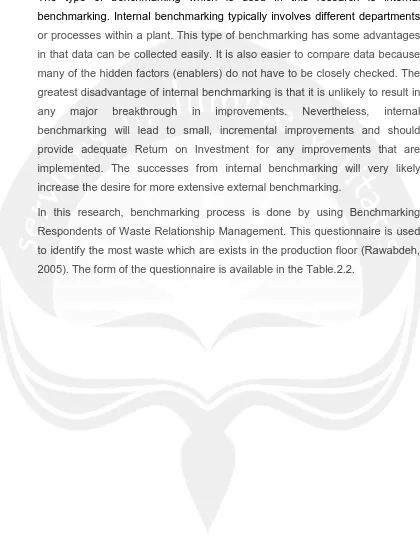
The type of benchmarking which is used in this research is internal benchmarking. Internal benchmarking typically involves different departments or processes within a plant. This type of benchmarking has some advantages in that data can be collected easily. It is also easier to compare data because many of the hidden factors (enablers) do not have to be closely checked. The greatest disadvantage of internal benchmarking is that it is unlikely to result in any major breakthrough in improvements. Nevertheless, internal benchmarking will lead to small, incremental improvements and should provide adequate Return on Investment for any improvements that are implemented. The successes from internal benchmarking will very likely increase the desire for more extensive external benchmarking.
In this research, benchmarking process is done by using Benchmarking Respondents of Waste Relationship Management. This questionnaire is used to identify the most waste which are exists in the production floor (Rawabdeh, 2005). The form of the questionnaire is available in the Table.2.2.
QUESTIONS WEIGHT
1.Does I produce j?
a. Always 4
b. Sometimes 2
c. Rarely 0
2. What is the type of the relation between I and j?
a. As i increases, j increases 2
b. As I increases, j reaches constant level 1
c. Rarely appears with along time 0
3.The effect of j due to i:
a. Appears directly and clearly 4
b. Often appears, but needs time to do 2
c. Only by an instruction 0
4.Eliminating the effect of I on j is achieved by:
a. Engineering and complex method 2
b. Simple and direct 1
c. Only by an instruction 0
5. The effect of j due to I, mainly influences on:
a. Quality of production only 1
b. Productivity of resources only 1
c. Lead time only 1
d. Quality and productivity 2
e. Productivity and lead time 2
f. Quality and lead time 2
Table.2.2. (Continued)(Rawabdeh, 2005)
QUESTIONS WEIGHT
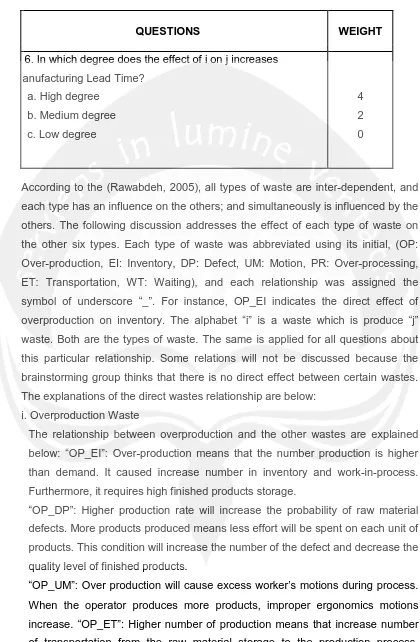
6. In which degree does the effect of i on j increases Manufacturing Lead Time?
a. High degree 4
b. Medium degree 2
c. Low degree 0
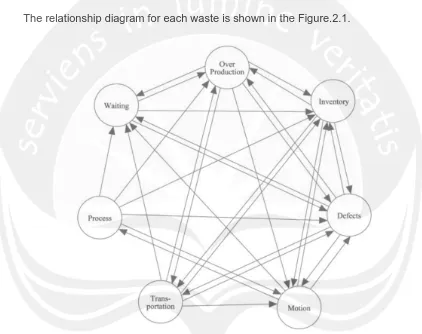
According to the (Rawabdeh, 2005), all types of waste are inter-dependent, and each type has an influence on the others; and simultaneously is influenced by the others. The following discussion addresses the effect of each type of waste on the other six types. Each type of waste was abbreviated using its initial, (OP: Over-production, EI: Inventory, DP: Defect, UM: Motion, PR: Over-processing, ET: Transportation, WT: Waiting), and each relationship was assigned the symbol of underscore “_”. For instance, OP_EI indicates the direct effect of overproduction on inventory. The alphabet “i” is a waste which is produce “j” waste. Both are the types of waste. The same is applied for all questions about this particular relationship. Some relations will not be discussed because the brainstorming group thinks that there is no direct effect between certain wastes. The explanations of the direct wastes relationship are below:
i. Overproduction Waste
The relationship between overproduction and the other wastes are explained below: “OP_EI”: Over-production means that the number production is higher than demand. It caused increase number in inventory and work-in-process. Furthermore, it requires high finished products storage.
“OP_DP”: Higher production rate will increase the probability of raw material defects. More products produced means less effort will be spent on each unit of products. This condition will increase the number of the defect and decrease the quality level of finished products.
Besides that, it will increase the number of transportation between every operation and transportation to the warehouse.
“OP_WT”: Overproduction will increase the waiting time of semi-finished products in every machine. Besides that, it may increase machines breakdown, because of the fullest capacity of the machine. When the maintenance happened, it means the waiting time for the products will be longer.
ii. Inventory Waste
The relationship between inventory and the other wastes are explained below: “EI_OP”: High number of inventory in raw materials will push the company to produce more products. The company will produce the products according to the number of raw material and not according to the market quantity demanded. “EI_ET”: High levels of inventory means more transportation needed between storage and production floor. Furthermore, higher level of finished products means more transportation to the warehouse.
“EI_UM”: Higher levels of work-in-process will increase the time for the motion, such as searching, selecting, grasping, reaching, moving, and handling.
“EI_DP”: Inventory of raw material in the storage or inventory of finished products in the warehouse for long time will increase the probability of the defects.
iii. Defect Waste
The relationship between defect and the other wastes are explained below: ”DP_EI”: As long as the numbers of defects are increase, the number of work-in-process will increase.
“DP_OP”: Higher number of defects means that the company has to produce more products to consume the loss.
“DP_WT”: Producing defective parts requires to explore the causes of errors and to take corrective actions. Therefore, other parts will wait to be processed. “DP_ET”: Higher number of products which will be repaired means more transportation needed.
“DP_UM”: Defective parts require a repairing process for them which requires workers motion.
The relationship between motion and the other wastes are explained below: “UM_DP”: Insufficient workers motions during production will increase the numbers of part’s defects. Furthermore, unskilled and untrained proper motions workers increase the defects.
“UM_EI”: Insufficient workers motions cause accumulating work-in-process. “UM_WT”: When there are no standard motions of the workers during production process, the required time to processed next part increases.
“UM_PR”: When jobs are non-standardized, there will be an opportunity of over-processing. Process waste will also be increased due to lack understanding, the available technology capacity.
v. Transportation Waste
The relationship between transportation and the other wastes are explained below: “ET_UM”: Insufficient and non-standardized transportation methods increase the workers motions by double handling and searching.
“ET_DP”: Insufficient transportation methods and unsafe transportation equipments increase the probability of production defects and also improper handling of the products may cause parts damage.
“ET_EI”: If there are no sufficient methods and number of equipments for transportation, work-in-process inventory increases.
“ET_OP”: Items are produced more than needed to fill materials handling equipments in order to reduce transporting cost per unit and to minimize the number of transports.
“ET_WT”: When the transportation is not on time or ineffective, waiting time for parts to be transported increases.
vi. Over-processing Waste
The relationship between over-processing and the other wastes are explained below: “PR_UM”: Non-standardize process requires more worker motions. “PR_DP”: Insufficient and improper processes lead to produce defects.
“PR_EI”: Combining operations in one cell will decrease the number of WIP because of the eliminating buffers.
“PR_OP”: An important aspect of process waste in order to reduce operation cost per machine time, machines are pushed to operate full time shift which finally results in overproduction.
vii. Waiting Waste
The relationship between waiting and the other wastes are explained below: “WT_DP”: Waiting of parts between workstations increases work-in-process inventory may cause defects due to the surrounding conditions.
“WT_EI”: Waiting of parts between workstations increases work-in-process. Also, waiting of the finished items in warehouse increases inventory.
“WT_OP”: The waiting time of the machine will make the machine is forced to produce more just to keep running.
The relationship diagram for each waste is shown in the Figure.2.1.
Figure.2.1. Direct Wastes Relationship (Rawabdeh, 2005)
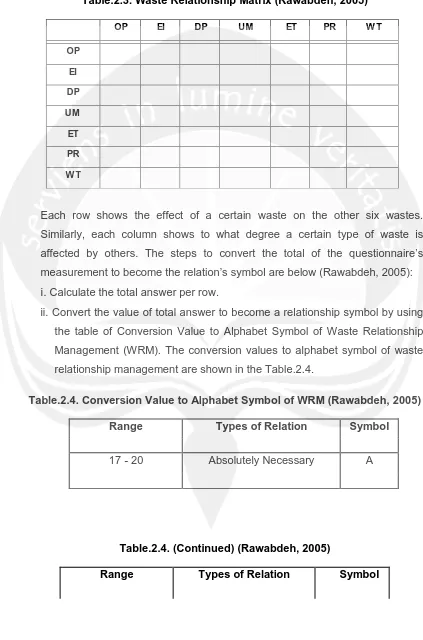
b. Waste Relationship Matrix Measurement
Manager, and Operational Director. The answers of the questionnaire will be summarized by using Table.2.3 below:
Table.2.3. Waste Relationship Matrix (Rawabdeh, 2005)
OP EI DP UM ET PR W T
OP
EI
DP
UM
ET
PR
W T
Each row shows the effect of a certain waste on the other six wastes. Similarly, each column shows to what degree a certain type of waste is affected by others. The steps to convert the total of the questionnaire’s measurement to become the relation’s symbol are below (Rawabdeh, 2005):
i.
Calculate the total answer per row.ii. Convert the value of total answer to become a relationship symbol by using the table of Conversion Value to Alphabet Symbol of Waste Relationship Management (WRM). The conversion values to alphabet symbol of waste relationship management are shown in the Table.2.4.
Table.2.4. Conversion Value to Alphabet Symbol of WRM (Rawabdeh, 2005)
Range Types of Relation Symbol
17 - 20 Absolutely Necessary A
Table.2.4. (Continued) (Rawabdeh, 2005)
13 - 16 Especially Important E
9 - 12 Important I
5 - 8 Ordinary Closeness O
1 - 4 Unimportant U
0 No relation X
c. Matrix Value
The conversion value of alphabet symbol in the previous step will be used to calculate the relationship level from one waste to another. The weights of each alphabet symbol are shown in the Table.2.5.
Table.2.5. Matrix Value (Rawabdeh, 2005)
Type of Relation Weight
A 10
E 8
I 6
O 4
U 2
X 0
The weights of each row and column were added to obtain the score, and then the percentages were calculated by dividing each score by the total score. These percentages represent the probability that a certain type of waste will affect others or be affected by others.
2.2.5. Tools for Implementation Six Sigma
Every Six Sigma’s project which has been choose have to define the key processes, series of process, and the interaction with the customers. The customer can be internal and external customers. Before define the key process and the customer in the Six Sigma’s project, it is necessary to know more about the SIPOC diagram (Hamdi, Fayala, Jmali, & Saidane, 2015). Suppliers-Input-Process-Output-Customers (SIPOC) is a high-level diagram of the five key components of the process that contribute to creating and delivering the value demanded by the customers. It shows what those components are and how each one of them participates in the process. Having a visual map of the process handy makes it easier to link the different significant components of the process together, narrow the scope of the project with fewer resources. According to the (Fallis, 2013), five key components of a SIPOC diagram are:
i. Supplier is the providers of raw materials, services, and information used in the process to generate the value sold to customers.
ii. Input is the actual services, raw materials, and information used to create the value sold to customers.
iii. Process is the sequence of events used within the organization to transform the raw materials and serviced into value.
iv. Output is the value created by the organization to satisfy customers’ demands.
v. Customer is the users of the value created by the organization.
Since in the Define phase, what the project team is mapping is not the ideal state but the current state, the mapping process should start with the inventory of the customers, a high-level view of who the customers are. A nomenclature of the customers according to the kind of products or services that they expect from the organization and how those products are delivered to them should be created. The next step should consist of creating a classification of the products demanded by each group of customers under the Output grouping. Each product is created following a unique production process, so a high-level map of each product under the Output listing should be separately created under Process.
several processes; therefore, the input can be listed in a way that shows which processes it is intended for without unnecessarily duplicating the items in the Input list. Finally, the list of the suppliers of the input should be created with each supplier tied to the product or service that it provides in the Input list. Both the suppliers and the customers can be either internal or external. Figure.2.2 is shown the template of SIPOC diagram.
Figure.2.2. Template of SIPOC Diagram
b. Critical to Quality (CTQ) Tree
In order to be able to quickly solve customers’ problems, it is necessary to understand their requirements and to be able to translate the significant aspects of those requirements into measurable data that can be subjected to critical analysis. The purpose of the critical analysis is to determine what it takes to actually meet the customers’ requirement (Fallis, 2013).
Figure.2.3. CTQ Tree Template
The objectives of the Critical To Quality (CTQ) Tree are:
i. Identify implicit and vague customer needs and convert them into specific requirements.
ii. Make sure that all the critical requirements are inventoried.
iii. Speed up the understanding of those requirements by the project team while narrowing the scope to the critical few.
The following steps used to create a CTQ tree are: i. Identify the product or service that is being analyzed.
ii. Identify the key components of the product or service. These are the features that define the product. Without their presence, the product would not be what it is supposed to be.
iii. Identify the critical customers’ requirements for the products or services. The team identifies the basic requirements (quality, price, and delivery) that the customers expect from the products.
iv. Identify the customers’ first level of requirements. In this step, the team identifies critical requirements that satisfy the key customer need identified in the previous step.
v. Identify the customers’ second level of requirements. In this step, the team identifies critical requirements that satisfy the key customer need identified in the previous step.
c. Operation Process Chart
Operation process map is a diagram which is describes the steps of process which had been around by the raw material about the sequence of the process and the inspection. The operation process map is created from the first operation until it becomes the products, and all the information needed in order to continue the analysis, such as: time needed, material used, and place or machine used (Fallis, 2013).
Therefore, in a operation process map, the activities which are noted are operation process, the inspections, or the inventories. The advantages of the operation process are:
i.
Knowing the machine’s requirement and the budgeting of the machine. ii. Estimating the requirement of raw materials.iii. As a tools to determine the factory’s layout.
iv. As a tools to repair the work methods which are used. v. As a tools for job training.
The principle of making process operations are:
i.
First of all on the top line stated the head of the operation process map which is followed by the other identifications, such as: the object’s name, the creator, the date of mapping, the map number, and the image number. ii. The material which is going to be processed is placed above the horizontalline which is indicates that the material is entered into the process.
iii. The symbols are placed in the vertical directions which is indicates the occurrence of the change process.
Mt
W M
Mt
O-N
I - N M W
Mt Purchased
Material
Mt
Figure.2.4. Operation Process Map ((Fallis, 2013)
Description:
W = The time requirements for the operation or inspection O – N = The sequence number of the operation activity
I – N = The sequence number of the inspection activity
M = Indicate the machine or place where the activities occurred
After all the processes described in full, the summary of this operation process map is created in the end of the page. The summary of this operation process map, such as: number of operations, the amount of inspection, and the amount of time required. Table 2.6 is an explanation of symbols used in the operation process map.
No.
Event
Symbol
Description
1.
Operation
It indicates the main steps in
a process. Generally the
part, materials or product is
modified.
2.
Inspection
It indicates any type of
inspection
checks,
measurement, visual security
for quality and quantity.
3.
Transportation
It indicates the movement of
materials or equipments from
one location to another.
4.
Delay
It occurs when something
stops the process and the
product waits for next event.
5.
Storage
It indicates the steps when a
finished good or raw material
awaits in action. Storage
shows an authorized control
over an item.
d. Control Chart
Statistical Process Control (SPC) is a method of inspection by which it can be determined whether a process is in control. The key tool for statistical process control is the control chart of which several types exist. Control chart was developed by Dr. Walter A. Shewhart during 1920’s (Magar & Shinde, 2014). These charts separate out assignable causes.
Control Limit (LCL), it is a lower control limit for a deviation from the characteristic sample.
SPC is based upon the Central Limit Theorem which shows that the samples will follow a normal distribution regardless of the shape of the parent distribution. Interpreting control charts is, then, all about probabilities. If the observations aren’t probable, there must be a special cause variation. Special cause variation is assumed to exist if:
i.
Any point falls outside the control limits.ii. Nine consecutive observations fall on one side of the mean. iii. Six consecutive observations are increasing (or decreasing).
iv. 14 observations alternate above and below the mean.
v. Two of three consecutive points fall in zone C in one-half of the chart. vi. Four of five consecutive points fall in zone B in one-half of the chart. vii. 15 consecutive observations in the A zones.
viii. Eight consecutive points outside of the A zones.
SPC has the same Type I and Type II risks as acceptance sampling. If the process if in fact in control, however the assumption is out of control, it is Type I error. If the process in fact out of control, however the assumption is in control, it is Type II error. Based on the data category, the control chart is divided into variables data and attributes data.
The control chart which is used in this research is U-chart
.
The analysis of process capability for every CTQ is done by using U-Chart because of the nonconformities which is more than 1 in 1 inspection object and every CTQ is considered have same impact to the company. According to the (Fallis, 2013), the steps to make U-Chart are:i. Calculate the number of nonconformities per products in every observation
(2.5) Note:
U = Number of nonconformities per unit Ci = Number of nonconformities
ni = Sample number
ii. Calculate the central line
(2.6) The symbol = CL
iii. Calculate the Upper Control Limit (UCL)
(2.7)
Note:
= Control Limit = Sample number
iv. Calculate the Lower Control Limit (LCL)
(2.8) Note:
= Control Limit = Sample number
Figure.2.5 is shown the example of U-Control Chart:
Figure.2.5. U-Control Chart e. Pareto Chart
from left to right. Pareto charts are extremely useful for analyzing what problems need attention first because the taller bars on the chart, which represent frequency, clearly illustrate which variables have the greatest cumulative effect on a given system. The Pareto chart provides a graphic depiction of the Pareto principle, a theory maintaining that 80% of the output in a given situation or system is produced by 20% of the input (Fallis, 2013). The Pareto chart is one of the seven basic tools of quality control. The independent variables on the chart are shown on the horizontal axis and the dependent variables are portrayed as the heights of bars. A point-to-point graph, which shows the cumulative relative frequency, may be superimposed on the bar graph. Because the values of the statistical variables are placed in order of relative frequency, the graph clearly reveals which factors have the greatest impact and where attention is likely to yield the greatest benefit. Figure.2.6 is shown the sample of Pareto Chart.
Figure.2.6. Pareto Chart
f. Fishbone Diagram
of one particular problem and therefore assists to uncover all the symptoms of any business problem. For that particular reason it is also termed as “Cause-Effect analysis” (Fallis, 2013).
[image:31.595.85.514.162.702.2]In a typical fishbone diagram the main problem which is required to be resolved has been put on the head of the diagram and the causes are put as the bones and then smaller bones are created as the resemblances of the sub-causes. Ultimately after completion of the diagram it is a comprehensive evaluation of the causes of the main problems and also reveals the root causes as well. There are six classic categories of a fishbone diagram which are categorized as the main causes of any problems of business process. Those are people, equipment, materials, environment, management and process. Figure.2.7 is shown the sample of Fishbone Diagram.
Figure.2.7. Fishbone Diagram
g. FMEA
FMEA is used to prevent the failures, increase the chances of detecting the occurrence of failures, identify the big cause of the failure and eliminate it, reduce the failures opportunities, and set up the quality of both product and process. The advantages of the implementation of FMEA are increase the safety, quality, reliability, customer satisfaction, and lower cost of development.
i. Identify and fully understand potential failure modes and their causes, and the effects of failure on the systems or end users, for a given product or process.
ii. Assess the risk associated with the identified failure modes, effects and causes, and prioritize issues for corrective action.
iii.
Identify and carry out corrective actions to address the most serious concerns.There are many variations in the details of the failure mode and effect analysis. All variations have the same objectives which is need to be achieved, they are:
i.
Identify the potential failure of a product or process which is possible to be happen.ii. Predict and evaluate the impacts of the failure in the function of the system. iii. Show the priority to the improvement of the process through the list of the
process improvement which is should be corrected.
iv. Identify and establish the corrective action which can be taken to prevent or reduce the chances of the potential failures of the system.
v. Documenting the whole process.
FMEA should be the guide to the development of a complete set of actions which is going to reduce the risk associated with the system, sub-system, and component or manufacturing process to an acceptable level. There are three kinds of FMEA (Fundamental & Fmeas, 2012) they are:
i.
For System FMEA’s, the objective is to improve the design of the system. ii. For Design FMEA’s, the objective is to improve the design of the
sub-system or component.
iii. For Process FMEA’s, the objective is to improve the design of the manufacturing process.
Several steps to create FMEA which is executed by the team of Design for Six Sigma (DFSS) are:
i. Establish the process limit which is bounded by the process structure. ii. Establish the mapping process from the FMEA which is described the
production process completely.
iv. Identify the potential failures for every process. v. Study the cause of the failures and the impact.
[image:33.595.88.516.194.660.2]The table of FMEA is possessed of several elements. The elements of the FMEA’s table are available in the Table.2.7.
Table.2.7. Table of FMEA (Morris, 2011)
It e m
Funct i on
Pot ent i al Failure
M ode
Pot ent i al Effect ( s) of Failure S e v e ri ty
Pot ent i al Cause(
s) of Failure O
c c u rr e n c e Current Design Cont rols (Det ect i
on) D
e te c ti o n R P
N Recom m en
ded Act ion(s)
… ……. ……… ……….. .. ……. .. …………. .. .. ………..
Elements of FMEA are formed based on the information which is contributed to analysis. Several elements of FMEA are:
i. Item
Item is the focus of the FMEA project. ii. Function
Function is what the item or process is intended to do, usually to a given standard of performance or requirement.
iii. Failure Mode
Failure mode describes the condition when system, process, and the components which have potential failure fulfill the design specification or performance requirements.
iv. Effects
The potential failure effects are a potential effect which is concerned with the impact of the failures to the users.
v. Severity
Table.2.8. Table of Suggested DFMEA Severity Evaluation Criteria (Fallis, 2013)
Severity Severity of Effect on Process
Rank Effect (Effect on Manufacturing or Assembly)
Fails to meet May endanger operator (machine or assembly)
10 safety or without warning.
regulatory May endanger operator (machine or assembly)
9 Requirements with warning.
Major 100% of product may be scrap. Stop production
8 Disruption or stop shipment.
Portion of a production run may be scrapped.
7 Significant Deviation from primary process, decreased line
Disruption speed, or additional manpower required.
100% of a production run may require off-line
6 rework prior to acceptance.
Portion of a production run may require off-line
5 Moderate rework prior to acceptance.
Disruption 100% of a production run may require rework
4 in-station before it can be processed.
Portion of a production run may require rework
3 in-station before it can be processed.
Table.2.8. (Continued) (Fallis, 2013)
Severity
Rank Effect
Severity of Effect on Process (Effect on Manufacturing or Assembly)
Minor Slight inconvenience to process, operation, or
[image:34.595.88.508.121.772.2]1 No Effect No discemible effect.
vi. Cause
The potential cause is the root cause which is potential to make failures. vii. Occurrence
[image:35.595.86.512.222.664.2]Occurrence is a ranking number associated with the likelihood which the failure mode and its associated cause will be present in the item being analyzed. The rank of occurrence is available in the Table.2.9.
Table.2.9.Table Frequency of Occurrence (Morris, 2011)
Likelihood of
Failure
Occurrence of Causes
(Incidents per items or
vehicles)
Occurrence
Rank
Very High
>100 per 1000
>1 per 10
10
High
50 per 1000
1 in 20
9
20 per 1000
1 in 50
8
10 per 1000
1 in 100
7
Moderate
2 per 1000
1 in 500
6
0.5 per 1000
1 in 2000
5
0.1
per 1000
Table.2.9. (Continued) (Morris, 2011)
Likelihood of
Failure
Occurrence of Causes
(Incidents per items or
vehicles)
Occurrence
Rank
Low
0.01
per 1000
1 in 100.000
3
<0.001 per 1000
1 in 1.000.000
2
Very Low
Failure eliminated by
preventive control
1
viii. Controls
Controls are the methods or actions currently planned, or are already in place, to reduce or eliminate the risk associated with each potential cause. Controls can be the methods to prevent or detect the cause during product development to detect a problem during service.
Prevention type controls describe how a cause, failure mode, or effect in the product design is prevented based on current or planned actions. They are intended to reduce the likelihood that the problem will occur, and are used as input to the occurrence ranking.
Detection type design control describe how a failure mode or cause in the product design is detected, based on the current actions before the product design is released to production, and are used as input to the detection ranking.
ix. Detection
Detection is ranking number associated with the best control from the list of detection type controls, based on the criteria from the detection scale. The table of rank detection is shown in the Table.2.10.
[image:36.595.92.512.97.592.2]Opportunity
for
Detection
Criteria :
Likelihood of Detection by Design Control
Rank
Likelihood
of
Detection
No detection
opportunity
No current design control; can’t detect or is not
analyzed
10
Absolute
Uncertainty
Not likely to
detect at
any stage
Design analysis/detection control have a week
detection capability; virtual analysis is not
correlated to expected actual operating
conditions
9
Very
Remote
Post Design
Freeze and
prior to
launch
Product verification / validation after design
freeze and prior to launch with pass / fail testing
(sub-system or system testing with acceptance
criteria e.g. ride & handling, shipping evaluation,
etc.).
8
Remote
Product verification / validation after design
freeze and prior to launch with test to failure
testing (sub-system or system testing until
failure occurs, testing of system interactions,
etc.).
7
Very Low
Product verification / validation after design
freeze and prior to launch with degradation
testing (sub-system or system testing after
durability test e.g. function check).
6
Low
Prior to
Design
Freeze
Product
validation
(reliability
testing,
development or validation tests) prior to design
freeze using pass/fail testing (e.g. acceptance
criteria for performance, function checks, etc.).
5
Moderately
Product
validation
(reliability
testing,
development or validation tests) prior to design
freeze using test to failure (e.g. until leaks,
yields, cracks, etc.).
4
Moderately
High
Product
validation
(reliability
testing,
development or validation tests) prior to design
freeze using degradation testing (e.g. data
trends, before / after values, etc.).
3
High
x. Risk Priority Number (RPN)
xi. Recommended Actions