The effects of excessive
Disodium Ethylene Diamine Tetraacetic Acid
(Na
2EDTA) anticoagulant concentration toward hematology profile and
morphology of erythrocytes in peripheral blood examination
Tri Ratnaningsih*, Usi Sukorini*, Rizki Amalia Gumilang
Abstrak
Tujuan penelitian ini adalah untuk mengetahui apakah terdapat perbedaan antara hasil pemeriksaan hematologi rutin dan morfologi darah tepi eritrosit pada sampel darah dengan berbagai konsentrasi antikoagulan Na2EDTA yang berbeda. Penelitian ini merupakan penelitian potong lintang. Bahan penelitian berupa 33 sampel darah vena mahasiswa Fakultas Kedokteran UGM Yogyakarta. Dua mL darah dibagi ke dalam 4 tabung Na2EDTA yang masing-masing berisi antikoagulan dengan konsentrasi yang berbeda. Tabung pertama berisi Na2EDTA konsentrasi standar, 2 mg/dl, tabung yang lain secara berurutan berisi Na2EDTA dengan konsentrasi 4 mg/dl, 6 mg/dl, and 8 mg/dl. Sebelumnya dibuat sediaan hapus langsung dari setetes darah tanpa antikoagulan (sebagai kontrol) untuk pemeriksaan morfologi darah tepi (MDT). Darah dalam keempat tabung tersebut segera dilakukan pembuatan sediaan hapus dan diperiksa profil hematologi eritrositnya menggunakan SYSMEX SE-9500 automatic analyzer. Terdapat penurunan yang bermakna dari hitung eritrosit, hemoglobin, hematokrit, dan MCHC serta peningkatan yang bermakna dari nilai MCV dan RDW antara konsentrasi Na2EDTA yang berlebihan, sedangkan nilai MCH tidak ada perbedaan. Pemeriksaan MDT menunjukkan perubahan yang bermakna pada bentuk echinocytes serta ditemukan gambaran ghost cells pada sampel darah dengan Na2EDTA yang berlebihan. Disimpulkan bahwa antikoagulan Na2EDTA yang berlebihan akan berpengaruh terhadap morfologi dan beberapa parameter hematologi eritrosit. (Med J Indones 2006; 15:157-64)
Abstract
The purpose of this study is to know whether there are differences between hematology profile and morphology of erythrocytes of blood specimens which are prepared with excessive Na2EDTA anticoagulant in different concentration. This study was conducted in Faculty of Medicine Gadjah Mada University. The criteria of subject were male, age from 18 until 22 years old and healthy, ascertained from history taking and vital sign examination. Blood samples from 33 subjects were taken using vein puncture. Two millimeters blood was divided into 4 Na2EDTA-containing tubes. Before that, one drop of blood without Na2EDTA anticoagulant was used for making control blood film right after vein puncture. Each tubes contained different concentration of anticoagulant. The first tube contained Na2EDTA in standard concentration 2 mg/dl; the remaining tubes contained consecutively, 4 mg/dl, 6 mg/dl, and 8 mg/dl. Those samples were immediately examined using SYSMEX SE-9500 automatic analyzer for measuring erythrocytes hematological profile and were stained with Wright staining for morphological examination. These procedures were done before 20 minutes of vein puncture. There were significant decrease of RBC count, HGB, HCT, and MCHC and also significant increase of MCV and RDW between different concentrations of excessive Na2EDTA anticoagulant. MCH did not have significant result. Morphological examination showed significant morphological changes in the form of echinocytes and appearance of ghost cells in the sample treated with excessive Na2EDTA anticoagulant concentration. In conclusion, there are differences in hematological profile and morphology of erythrocytes among blood specimen which are prepared with excessive Na2EDTA anticoagulant in different concentration, except for MCH. Excessive Na2EDTA anticoagulant concentration will affect the blood specimen for peripheral blood examination of erythrocytes by interfering morphology and some of hematological parameters. (Med J Indones 2006; 15:157-64)
Keywords: Na2EDTA, erythrocytes, hematology parameters, echinocytes, ghost cells.
Peripheral Blood Examination is one of laboratory procedure which is important in diagnosis of various diseases such as infection, and malignancy – especially blood malignancy-. This examination is used as screening test, diagnostic test and also monitoring of the therapy.
*
Department of Clinical Pathology, Faculty of Medicine, Gadjah Mada University, Yogyakarta, Indonesia
Erythrocytes or red blood cell is one of the common component measures in peripheral blood examination. Its parameters such as RBC count, HGB, HCT, index erythrocytes and its morphology variations are widely used for establishing diagnosis of many diseases. Accuracy of measurement of those items above are influenced by several pre-analytical factors, one of them is the concentration of anticoagulant being used.
Anticoagulant which is commonly used is EDTA. It is suitable for routine hematological work include preparation of blood smear. EDTA has specific standard ratio based on the kind of salt whether it is sodium or potassium. Meanwhile lack of anticoagulant can cause coagulation of blood sample, excess of
(1,4-2,0 mg/mL). The 2 potassium EDTA are usually prepared in vacuum collection tubes (vacutainer), this ensure proper ratio between blood and anticoagulant. Whereas, Na2EDTA is prepared not in vacutainer
tubes, so in this condition inappropriate anticoagulant concentration to blood samples can occur. Many references stated that EDTA has effects on hematology profiles such as RBC and HCT and also can induced changes in blood morphology, but there is no statement in how much concentration EDTA will significantly alter the hematology parameters and blood cells morphology.
Reasons above then lead to development of hypothesis whether there are differences between hematological profile and morphology of erythrocytes of blood specimens which are prepared with excessive Na2EDTA
anticoagulant in different concentration.
METHODS
The study design was cross sectional study. This study was conducted in Faculty of Medicine Gadjah Mada University Yogyakarta. The inclusion criteria of subjects were as follow; male, Melayu race, age between 18 to 24 years old, healthy - this was proven by anamnesis and vital sign examinations-, declared approval on informed consent to join this research as subject, and the results of routine hematology examination by means of automatic cells counter revealed in between
reference range. There were also some exclusion criteria that included in anamnesis sheets. Those criteria consist of history of allergy, recent and chronic disease which subject had, medicine used especially those influenced hematology profile.
This study held on September until November 2004, during that time the sample size equal to 30 was targeted. After the subject had been examined and signed the informed consent then aseptic vein puncture was done to draw blood from antecubital fossa. There was 2 mL blood taken from each subjects.
The blood samples were divided into four groups in four different tubes, 0,5 mL for each tubes. First tube contained Na2EDTA in standard concentration,
second tube contained Na2EDTA in two fold standard
concentrations, third tube contained Na2EDTA in
three fold standard concentration and fourth tube contained Na2EDTA in four fold standard
concen-tration. Routine hematology examination was done by means of SYSMEX SE-9500 automatic cell counter. The results of first tubes were also used as exclusion parameters, hematology profile of first tubes which were not within the reference range of SYSMEX SE-9500 indicated that those blood samples were excluded. Especially for MCV we used cut off point < 74 fL to be excluded.
Routine hematology examination and also blood smear specimen preparation from each tube were done as soon as possible before 20 minutes from blood sampling.1 This was to avoid bias with the effect of preparation time. For the morphology examination, control was made from first drop of blood without anticoagulant.
The slides were examined using binocular microscope, with oil immersion 100x magnifications. The areas of counting are 5 microscope field containing ± 200 erythrocytes. The morphology variants which were reported by manual counter were crenated cells. Other morphology variants were reported whenever present. The results of examination of each slide were recorded in the available forms.
Variables in this study consist of independent and dependent variables. Independent variables are including Na2EDTA anticoagulant in different concentrations;
standard concentration, 2x,3x, and 4x of standard con-centration. For morphology examination, there is non- Na2EDTA anticoagulant specimen, as control variable
consist of parameters in routine hematological examination of erythrocytes which are RBC count, Hemoglobin, Hematocrit, MCV, MCH, MCHC, and RDW, and morphology variation of erythrocytes: just crenated cells which were counted in each microscopic field.
The data were summarized, for both hematology profile and morphology examination, into groups according to the concentration of Na2EDTA. The data were
analyzed using ANOVA (Analysis of Variant) and Kruskal-Wallis test (non parametric) in the SPSS 12.0 statistical software. Other morphology variants, if significantly found, were also analyzed qualitatively.
RESULTS AND DISCUSSION Hemoglobin (HGB), and Hematocrit (HCT) in between standard concentration of Na2EDTA anticoagulant
and concentration of 4 mg/mL, 6 mg/mL, 8 mg/mL of that standard. The differences of those three parameters were already seen since 4 mg/mL which was same with 2X of standard concentration.
As already mentioned above, although all of those three hematological parameters were significantly decrease, but the most prominent decrease was seen in HGB, by the percentage of decrement (Table 1). Hemoglobin was calculated using SLS-Hemoglobin method. The diluted sample mixed with sulfolyzer, agent that hemolyzed erythrocytes, then sent into flow cell for light absorbance measurement that represented the hemoglobin content.9 There was no differentiation of cell shape in this hemoglobin calculation. Correlation of EDTA anticoagulant with decrease of HGB until now is not fully understood due to unavailable references.
There was significant decrease of HCT of the result in this study. This finding was appropriate with one of the effects of EDTA anticoagulant which caused RBC shrinkage yielding decrease in HCT.1,5,8 Furthermore, decrease in HCT also correlated with decrease of RBC. The finding concerning with decrease of RBC in this study should be correlated with the method of
SYSMEX SE-9500 automatic cell counter. The SYSMEX SE-9500 is belonging to Aperture – Impedance Counters. By SYSMEX SE-9500, the RBC was counted by using the sheath flow DC Detection method, in which had special aperture, and back sheath fluid which surrounded the diluted samples as they were sent to the catcher tube.9 As the result, that technique prevented both recirculation of blood cells and the particle size distortion. The single file in that aperture had a function to prevent generation of abnormal cell pulses, since they precisely just detected the normal shape of erythrocytes. Concomitant with detection of RBC count, hematocrit calculation was also done by RBC Cumulative Pulse Height Detection method, in this way, hematocrit or packed red cells which were calculated derived from normal shape erythrocytes.9 Excessive anticoagulant concentration, which in this study Na2EDTA was used, distorted cellular
morphology.6,8 Due to distortion in cellular morphology of erythrocytes, there were morphologically abnormal cells which could not be counted by SYSMEX SE-9500. Therefore the more excessive anticoagulant concentration led to increase in the number of morphologically abnormal erythrocytes and decrease in RBC count in SYSMEX SE-9500 automated cells counter. Those mechanisms also had effect in declining of HCT.
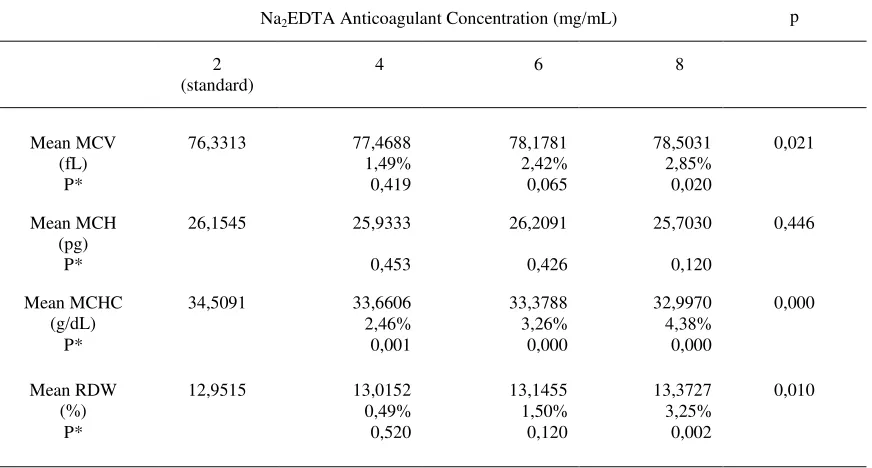
The result data analyses of RBC index are displayed in table 2 in which there were significant result of RBC index except MCH (Mean Corpuscular Hemo-globin). MCV, MCHC and RDW had p values less than 0.05 which mean significant differences of MCV, MCH, and RDW between standard concentration of Na2EDTA anticoagulant and concentration of 2X, 3X,
4X of that standard. On the other hand, MCH showed p value more than 0.05 in which there was insignificant decrease of MCH values between Na2EDTA anticoagulant in standard concentration (2
mg/dl) and in 4 mg/mL, 6 mg/mL, and 8 mg/mL.
Table 1. Result of statistical test in the effects of excessive Na2EDTA anticoagulant concentration toward RBC count(x106/µL),
HGB(g/dL), and HCT (%)
Na2EDTA Anticoagulant Concentration (mg/mL) p
2 (standard)
4 6 8
Mean RBC (x106/µL)
5,9609 4,3518 3,7964 3,5097 0,000 27% 36,31% 41,12%
P* 0,000 0,000 0,000
Mean HGB (g/dL)
15,5515 11,1012 9,7455 8,9970 0,000 28,61% 37,33% 42,15%
P* 0,000 0,000 0,000
Mean HCT (%)
45,0485 33,3030 29,1727 27,2576 0,000 26,07% 35,24% 39,49%
P* 0,000 0,000 0,000
(P* significant level of differences toward standard concentration)
Table 2. Result of statistical test in the effects of Na2EDTA anticoagulant concentration toward erythrocyte index: MCV (fL),
MCH (pg), MCHC (g/dL), and RDW (%).
Na2EDTA Anticoagulant Concentration (mg/mL) p
2 (standard)
4 6 8
Mean MCV (fL)
76,3313 77,4688 78,1781 78,5031 0,021 1,49% 2,42% 2,85%
P* 0,419 0,065 0,020
Mean MCH (pg)
26,1545 25,9333 26,2091 25,7030 0,446
P* 0,453 0,426 0,120
Mean MCHC (g/dL)
34,5091 33,6606 33,3788 32,9970 0,000 2,46% 3,26% 4,38%
P* 0,001 0,000 0,000
Mean RDW (%)
12,9515 13,0152 13,1455 13,3727 0,010 0,49% 1,50% 3,25%
P* 0,520 0,120 0,002
The MCH reflected HGB content in each RBCs. This parameter was acquired from calculation between HGB and RBC count. The percentage of MCH in table 2 showed that this parameter was considered constant. This parameter had insignificant result, meaning that there was no difference of MCH values pertaining to increase of Na2EDTA anticoagulant concentration.
In contrary, MCHC, this was the average concentration of hemoglobin per red cell, yielded significant decline between different concentrations of Na2EDTA
anti-coagulant since 2X of standard concentration or 4 mg/dL (p=0,001). Despite MCH and MCHC often do not add significant clinical information, however, the MCH and MCHC play an important role in laboratory quality control.5
RDW is used for observe variation of sizes and shapes of erythrocytes. It provides information about fragmentation, agglutination, or dimorphic cell populations.5 As well as MCV, the result of RDW in this study was significant and had a trend to be increased. The significant different begin at 4X of standard concentration (p=0,002). This increment of RDW was synchronal with the changes in RBCs morphology due to excessive Na2EDTA anticoagulant
concentration, because RDW reflected the variation of erythrocytes morphology in specimen.
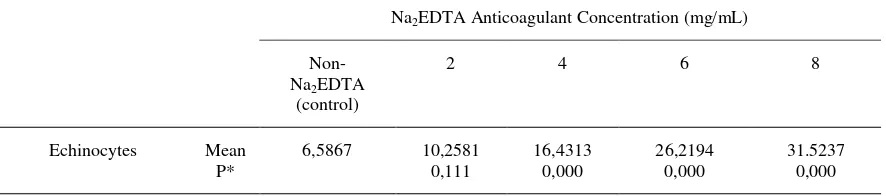
There were two morphological variations of erythro-cytes which were analyzed in this study. One of those variations, crenated cells or echinocytes was processed using statistical test whereas ghost cells were analyzed qualitatively. In this analysis we compared standard concentration of Na2EDTA, 2x, 3x and 4x of standard
with control samples which did not contain Na2EDTA
(non- Na2EDTA).
Information that we could gather from table 3 were the significance differences of echinocytes in Na2EDTA
anticoagulant were started in 2x increment of anti-coagulant concentration (4 mg/mL).
The mechanism of echinocytes formation could be divided into two: (1) pathologic and (2) non pathologic.2 The non pathologic causes of discocyte red cells changed into echinocytes are for instance2:
a. Washing red cells free from plasma and suspending them in 9 g/l NaCl between glass surfaces, particularly at a raised pH.
b. From the presence of fatty substances on the slides on which films are made.
c. From the presence of traces of chemicals which at higher concentration cause lysis.
d. Exposure to fatty acid and certain drug (in vitro
experiment)
Table 3. Result of statistical test in the effects of Na2EDTA anticoagulant concentration toward morphological variations of
erythrocytes: echinocyte
Na2EDTA Anticoagulant Concentration (mg/mL)
Non- Na2EDTA
(control)
2 4 6 8
Echinocytes Mean 6,5867 10,2581 16,4313 26,2194 31.5237 P* 0,111 0,000 0,000 0,000
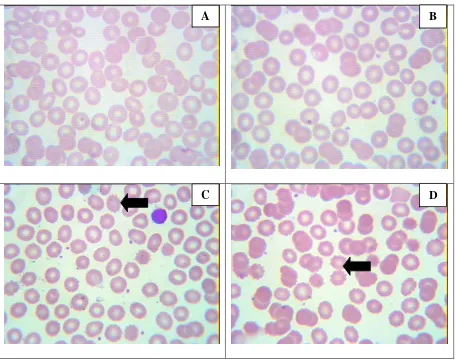
Figure 1. Illustration of erythrocyte ). Arrows indicate echinocytes. In control group (without Na2EDTA) (A) and group with standard anticoagulant (B), echinocytes are very rare. It is more obvious in 2 X (C) and 4 X (D) Na2EDTA Anticoagulant Concentration.
The end stage of crenation is “finely crenated sphere” which is also known as sphero-echinocyte.2,8 This morphology started to appear in 3X of standard concentration slides, as described above as thorn like spicules echinocytes with round shape and loss of central pallor. Echinocytes which appear in specimen due to preanalytical process usually are regarded as artifact.2,8 Commonly it occur in anticoagulated sample which had been stored for several hours.2 Echinocytes formation related with EDTA anti-coagulant concentration involved mechanism that changed membrane structure of erythrocyte, mainly cytoskeleton and Ca2+ components.7,10
Recent study showed that one of discocyte-echinocyte changes mechanisms is related to pH and also to osmosis and diffusion process. As we know, elevated pH in plasma leads to echinocytes formation.8 This finding also supported by other studies that proved that alteration in external PH cause changes in erythrocytes morphology, low PH produced stomatocytes whereas high PH produced echinocytes as observed in intact cell experiment.4 This Na2EDTA anticoagulant
was assumed to produce increase pH, because sodium ion is the component of alkali. These differ with crenation because of storage which more related with fall in ATP or lysolecithin formation.2
C
D
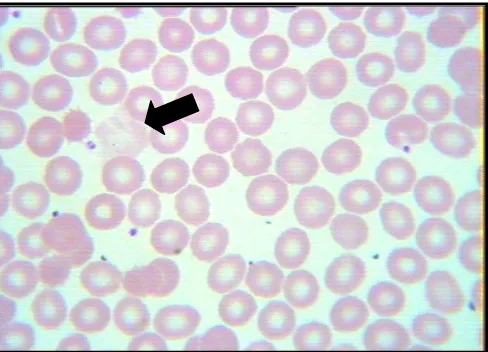
Figure 2. Photograph; erythrocytes ghost cell (specimen of morphology examination)
Ghost erythrocytes were remnant-like cell with unspecific shape and shadow appearance. Ghost cells actually are modified forms of erythrocytes used in research to observe the composition of human erythrocyte membrane. Ghost cells related with EDTA anticoagulant usually has stromalytic forms (long, thin extrusion covered the entire surface of ghost cell) which resolve if the concentration of EDTA was reduced or addition of calcium ions.7
CONCLUSIONS AND RECOMMENDATIONS
There are differences in hematological profile and morphology of erythrocytes among blood specimen which are prepared with excessive Na2EDTA
anti-coagulant in different concentration, except for MCH. The differences are:
- Significant decrease of RBC, HGB, and HCT since 4 mg/dL concentration compared with standard concentration.
- Significant increase of MCV and RDW in 8 mg/dL concentration compared with standard concentration. But within group these parameters showed significant differences
- Significant decrease of MCHC since 4 mg/dL concentration compared with standard concentration.
- Significant increase of echinocytes since 4 mg/dL concentration compared with control (non-Na2EDTA)
specimen. The effects toward hematology profile are as follow:
1. Increase concentration of Na2EDTA
anti-coagulant caused decrease of RBC count, HCT and HGB value.
2. Erythrocyte indexes were significantly affected by increment of Na2EDTA anticoagulant
concentration except MCH whose values are constant with increase of Na2EDTA
anti-coagulant concentration.
There were morphological changes because of increase Na2EDTA anticoagulant concentration. Echinocytes,
which was statistically tested, showed increase in number together with increase of Na2EDTA
anti-coagulant concentration. Ghost cells also could be observed in exposure of sample with excessive Na2EDTA anticoagulant concentration.
Based on the result of this study, if Na2EDTA
anticoagulant is used for preserving samples, there should be an attempt to control appropriate con-centration of anticoagulant. The usage of vacutainer tube is one of strategy to ensure proper ratio between blood samples and anticoagulant concentration.
REFERENCES
1. Aulia D, Wirawan R, Suherli A. Pengaruh Lama Penyimpanan Darah dengan Antikoagulan Tripotassium Ethylene Diamine Tetraacetic acid (K3EDTA) dalam tabung Vaquette terhadap beberapa Parameter Hematologi, Maj Kedok Indones, 2002; 52: 1: 11-9
3. Dacie JV, Lewis SM. Practical Hematology, ed. VI, Edinburg: Churchill Livingstone, 1995.
4. Gedde MM, Yang E, Huestis WH. Shape Response of Human Erythrocyte to Altered Cell pH, Blood 1995; 86:4:1595-9.
5. Lee GR et.al. (Editor), Wintrobe’s Clinical Hematology
10th edition. Canada: Williams-Wilkins, 1999.
6. Lewis SM, Koepke JA. (Editor), Hematology Laboratory Management and Practice. Oxford: Butterworth-Heinemann, 1995.
7. Pinteric L, Manery JF, Chaundry IH, Madapallimattam G. The Effect of EDTA, cations, and various buffers on the
morphology of erythrocyte membranes: an electron microscopic study. Blood 1975; 45:709-24. Browsed:
http://ncbi.nlm.nih.gov, Accessed: June, 18th 2004. 8. Stienne-Martin EA, Lotspeich-Steineger CA, Koepke JA.
Clinical Hematology: Principles, Procedures, Correlation. 2nd ed. Lippincott- Raven publisher, 1998.
9. Sysmex SE-9500 Operator’s Manual – Japan. TOA Medical Electronics, 1997.