Study on the inluence of adiponectin genetic variants and adiponectin
levels among Indonesian women with polycystic ovary syndrome
Bertha Pangaribuan,1 Irawan Yusuf,2 Muchtaruddin Mansyur,3 Andi Wijaya2
1 Post Graduate Program, Medical Sciences, Faculty of Medicine, Hasanuddin University, Makassar, Indonesia 2 Department of Physiology, Faculty of Medicine, Hasanuddin University, Makassar, Indonesia 3 Department of Community Medicine, Faculty of Medicine, Universitas Indonesia, Jakarta, Indonesia
Abstrak
Latar belakang: Resistensi insulin dan obesitas sentral adalah keadaan yang sering ditemukan pada wanita PCOS dan ditandai dengan abnormalitas penanda biologi yang terkait dengan terjadinya gangguan metabolik. Hubungan antara adiponektin dan resistensi insulin telah banyak diteliti, namun penelitian terhadap pasien PCOS baru sedikit yang dilakukan.
Penelitian ini bertujuan untuk menentukan kemungkinan hubungan polimorisme T45G dengan penanda biologi PCOS dan
pengaruhnya terhadap adiponektin serum pada populasi Indonesia.
Metode: Lima puluh dua pasien PCOS dan 52 subjek ovulasi normal tanpa hiperandrogenisme sebagai kontrol disertakan
dalam penelitian ini. Sampel darah dikumpulkan antara hari ke 3 dan 5 siklus menstruasi spontan, jam 7 hingga 9 pagi, setelah menjalani puasa. Dilakukan pengukuran kadar serum FSH, LH, testosteron, SHBG, glukosa, insulin, proil lipid dan
adiponektin. Resistensi insulin ditentukan dengan HOMA-IR, HOMA-β,dan SHBG. DNA genom dari darah perifer pasien
dan subjek kontrol digunakan untuk memeriksa polimorisme T45G menggunakan metode PCR.
Hasil: Terdapat perbedaan yang signiikan antara kelompok PCOS dan kontrol terhadap IMT, LH, testosteron, SHBG,
dan FAI, tetapi tidak signiikan terhadap frekuensi distribusi polimorisme gen T45G. Kadar adiponektin ditemukan lebih
rendah pada kelompok PCOS daripada kontrol, dan terdapat hubungan antara resistensi insulin dengan PCOS. Pada
pasien PCOS frekuensi polimorisme T45G ditemukan lebih tinggi pada wanita dengan adiponektin kadar rendah dari pada
kelompok adiponektin kadar tinggi, meskipun tidak bermakna secara statistik. Tidak ditemukan hubungan antara penanda
biologi PCOS (LH, testosteron, SHBG, dan FAI) dengan polimorisme gen T45G.
Kesimpulan: Polimorisme gen adiponektin (T45G) tidak berhubungan langsung dengan penanda biologi PCOS, namun demikian hubungannya dengan adiponektin perlu penelitian lebih lanjut. (Med J Indones. 2012;21:83-91)
Abstract
Background: Insulin resistance and central adiposity are frequent disorders in PCOS women, which are marked by
biological marker dysregulation related to this metabolic abnormalities. Association between adiponectin and insulin resistance has been investigated in many studies, while only a few studies were done in PCOS patients. This study is to determine the association of T45G polymorphisms in Indonesian population with PCOS biological markers and their inluence to adiponectin serum.
Methods: Fifty-two PCOS patients and 52 normal ovulatory women without hyperandrogenism as control subjects were
included. Blood samples were collected between day 3 and 5 of a spontaneous menstrual cycle at 7 to 9 am, after overnight fasting. Serum levels of FSH, LH, testosterone, SHBG, glucose, insulin, lipid proile and adiponectin were measured. Insulin resistance was estimated by HOMA-IR, HOMA-β, and SHBG. T45G gene polymorphisms were determined by PCR after genomic DNA was obtained from peripheral blood of patients and control subjects.
Results: There were signiicant difference between PCOS and control group in term of BMI, LH, testosterone, SHBG,
and FAI, but not signiicant to T45G gene polymorphisms frequency distribution. Adiponectin levels were lower in PCOS patients than control. There was an association between insulin resistance with PCOS. Among PCOS patients, no association between adiponectin LH, testosterone, SHBG, and FAI with T45G gene polymorphisms. T45G gene polymorphisms were more frequent in PCOS with low adiponectin levels compared to those with high adiponectin levels, although not signiicant statistically.
Conclusion: T45G gene polymorphisms has no direct association with PCOS biological markers, but its association with
adiponectin needs further study. (Med J Indones. 2012;21:83-91)
Keywords: Adiponectin, insulin resistance, polycystic ovary syndrome, T45G adiponectin gene
Correspondence email to: [email protected] Polycystic ovary syndrome (PCOS) is a heterogeneous condition that is associated with the following clinical features: oligo/amenorrhea (caused by chronic oligo/ anovulation), acne or hirsutism (resulting from hyperandrogenemia), infertility, and obesity. It affects < 10% of women of reproductive age,1 with approximately
16 - 80% of the affected women being obese,2 and is
responsible for 50 - 70% of cases with anovulatory infertility.3
androgen hormone biosynthesis. Moreover, insulin resistance and hyperinsulinaemia may increase the risk of long-term metabolic disorders, such as impaired glucose tolerance and type 2 diabetes, as well as cardiovascular disease. Insulin resistance is also triggered by other factors such as obesity, sedentary life style and decreasing physical activities.4 Obesity
is related to adipose tissue that produced many adipocytokines, which have been known to have substantial connection to insulin resistance.5
Adiponectin is an adipocytokine that is secreted solely by adipose tissue, and its concentration is inversely related to the degree of adiposity. Decreased adiponectin levels are associated with obesity, coronary artery disease, type 2 diabetes, and insulin resistance.6 These
indings point to an important role of adiponectin in the pathophysiology of insulin resistance associated metabolic disorders, which may lead to PCOS. Futhermore, it is supposed that genetic variability in the adiponectin gene may be a determinant of the phenotypic expression of PCOS, because the gene of adiponectin is located on the long arm of chromosome 3 (area 3q27), where susceptibility to metabolic syndrome (insulin resistance, obesity, hypertension and coronary disease) and diabetes mellitus type 2 genes were located.7 Sequence polymorphisms of
the adiponectin gene have been identiied in humans and have been examined for possible association with insulin resistance and circulating adiponectin concentrations.8
There were many polymorphisms of adiponectin that had been known, one of them is T45G polymorphism, a silent T-to-G substitution in exon 2 (45T>G). This highly prevalent polymorphism has been reported to be associated with the risk of obesity, insulin resistance, and diabetes mellitus type 2.9,10 Furthermore, in a
recent study the 45T>G polymorphism was also studied in women with PCOS and was related to d-androstenedione concentrations.11 Therefore, the
aim of this study was to examine the association of polymorphisms at position +45 of the adiponectin gene with the biological markers of PCOS and their inluence on serum adiponectin.
Methods
This is a case control study on Indonesian reproductive women. The cases were PCOS patients, and the control group was normal ovulatory women. Informed consent was obtained from all participants, and the study was approved by the Institutional Review Board of Hassanuddin University.
Study participants
Inclusion criteria: Indonesian reproductive women aged between 20 to 40 years old. Exclusion criteria: hyperprolactinemia, had a history of disorders of glucose tolerance, hypertension, use of any medications that might interfere with the normal function of hypothalamic-pituitary-gonadal axis, and unmarried.
Cases
The cases were PCOS patients who met the inclusion criteria and were diagnosed using the Rotterdam consensus.12 The case group patients were outpatients
of Yasmin Clinic, the Obstetrics and Gynecology Clinic of Cipto Mangunkusumo Hospital, Jakarta.
Controls
The control group consisted of women selected among staffs of Yasmin Clinic and Prodia Clinical Laboratory who met the inclusion criteria, had non PCOS menstrual disorder, and were Yasmin Clinic patients. Exclusion criteria for controls: hyperandrogenism that was deined by the clinical presence of hirsutism, acne or alopecia, and/or increased androgen concentrations.
Procedures
All the women underwent a complete screening panel at Prodia Clinical Laboratory, including physical examination, weight and height measurement, and ultrasound examination of the ovaries, and calculation of the body mass index (BMI). All the patients were on an unrestricted diet. An oral glucose tolerance test (75 g) was carried out, with glucose and insulin measured at 0 and 120 minutes. Further, the presence of menstrual dysfunction and obesity were determined. Menstrual dysfunction was deined by the presence of oligomenorrhea or amenorrhea.
Clinical and anthropological examination
menstrual cycle on 7 to 9 o’clock in the morning, after overnight fasting. Women with amenorrhea within the previous year were categorized as anovulatory without further testing, and blood was taken for hormonal analysis immediately at 7 to 9 o’clock in the morning after overnight fasting. Blood samples were drawn for the measurement of serum gonadotropin levels [follicle stimulating hormone (FSH) and luteinizing hormone (LH)], total testosterone, sex hormone-binding globulin (SHBG), glucose, insulin, lipid proile and adiponectin.
Calculation of free androgen index, HOMA-IR and HOMA-β
The free androgen index (FAI) was calculated using the formula: total testosterone (nmol/L) / SHBG (nmol/L) X 100.
The mathematical models to assess insulin resistance were used:14
The homeostasis model assessment of insulin resistance (HOMA-IR) was calculated using the formula: fasting glucose (mmol/L) X fasting insulin (μIU/mL) / 22.5 The homeostasis model assessment of β-cell function (HOMA-β) was calculated using the formula: [20 X fasting insulin (μIU/mL)] / [fasting glucose (mmol/L) – 3.5]%.
Assay methods
All assays of plasma glucose, lipid proile, hormonal levels and DNA polymorphism were performed at Prodia Clinical Laboratory.
Clinical chemistry analysis
Glucose serum levels were performed using a glucose oxidase technique with an auto analyzer. Total cholesterol, HDL, LDL and trygliseride were measured by enzymatic methods.
Hormone analysis
LH and FSH were measured with a competitive chemiluminescent enzyme immunoassay technique, using commercial kits (LH® Siemens Advia Centaur
and FSH® Siemens Advia Centaur). Testosterone
was measured with an electrochemiluminescent immunoassay technique, using a commercial kit (Testosterone II Cobas, Roche). SHBG was measured with electrochemiluminescent immunoassay technique (SHBG Cobas, Roche), and insulin with a competitive chemiluminescent enzyme immunoassay technique (Immulite® 2000 Insulin). Adiponectin levels were
measured with a quantitative sandwich enzyme
immunosorbent assay technique, using commercial kits (Human Adiponectin ELISA kit for Total and Multimers, Daiichi Pure Chemicals®), and resistin with
a sandwich enzyme immunoassay technique (Human Resistin ELISA, BioVendor Laboratory Medicine Inc.).
Genotype analysis
Genomic DNA was extracted and isolated from venous EDTA blood samples (buffy coat) of patients in both groups. The adiponectin T45G polymorphism, was genotyped by ampliication of genomic DNA using the following primers: forward, 5‘-GAAGTAGACTCTGCTGAGATGG-3’; reverse: 5‘-AGATGCAGCAAAGCCAAAGT-3’. PCR products were obtanined using 20 µL reactions (10 µL genomic DNA, 20 µM primer forward, 40 µM primer reverse, 10 µM dNTP mix (Invitogen. Cat. No.10297-018), 5 U/ µL Taq DNA polymerase (Invitrogen. Cat. No.10966-018), 25 µM MgCl2) in a thermal cycler (Perkin-Elmer 2400). The ampliication conditions were as follows: 94oC for 3 minutes, followed by 35 cycles of 30
seconds at 94oC, thirty seconds at 55oC, and 1 minute
at 72oC, and ending with a single 5 minutes extension
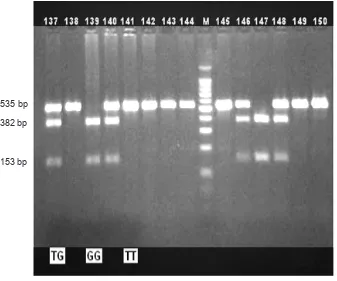
step at 72oC. The resulting fragment was 535 bp in
length. The fragment was digested with enzyme SmaI (AIT). Digestion of the G alele should produce two fragments of 153 and 382 bp. The digestion products were resolved after electrophoresis in 2% agarose gel.
Data collection and statistical analysis
Data collected were anthropometric, biochemical, metabolic, hormone, and genetic data of adiponectin polymorphism.
Statistical analyses were carried out using the Statistical Package for the Social Sciences (SPSS software, version 16.0). All data were tabulated and the mean and SD were calculated, unless otherwise stated. Gaussian distribution of continuous variables was tested by the Kolmogorov-Smirnov test. Logaritmic transformations were applied to BMI, LDL, HDL, triglyseride, fasting glucose and insulin, glucose and insulin 2 hours after meal, HOMA-IR, SHBG, FAI, DHEAS, 17OH-progesterone, and adiponectin levels to ensure gaussian distribution of the variables, and the values were presented back-transformed as means and SDs. When the variables did not achieve a normal distribution, the values are presented as means and range.
coefisient were used to establish associations between SHBG, adiponectin level and polymorism, with features of PCOS. Sub group analysis was done to establish associations between biological markers of PCOS and adiponectin gene polymorism with BMI using t-test.
The distributions of genotypes and allele were compared between study groups by using the χ2- test. The genotype
frequency distributions of T45G polymorphisms were calculated using Hardy–Weinberg equilibrium. For the genotypes present in statistically signiicant different frequencies, the odds ratios (ORs) and 95% conidence intervals (CIs) were also estimated. P < 0.05 was considered statistically signiicant.
Results
There were 159 patients of reproductive women with menstrual disorders who came to the clinic during the recruitment process. From those patients there were 5 patients who were not willing to participate in this study, twelve subjects did not return for laboratory testing, eighteen subjects were excluded (one patient with hyperprolactinemia, fourteen patients were not married, and 3 patients were out of the age range criteria), and inally we obtained 124 study subjects who met the inclusion and exclusion criteria.
Figure 1.Fourteen representative immunoblot illustrating the main adiponectin fragments of TG, GG and TT genotype, the T
allele (535 bp) and G allele (382 and 153 bp)
While selecting process to get PCOS patients, based on Rotterdam consensus, we obtained 72 patients of PCOS and the rest of those were non-PCOS patients (52 subjects). By considering the minimum sample size of 25 subjects and the case-control design of this study, it was decided to involve the whole subjects of non-PCOS patients as the control group. Meanwhile for the case group, matching simple random selection method was proceed, which was based on the age range criteria to get 52 patients of PCOS as the case group.
Digestion of the G alele produced two fragments with lenghts 153 and 382 bp, while T allele was not digested (535 bp). The digestion products that were resolved after electrophoresis in 2% agarose gel is shown in igure 1.
Association of hormones, adiponectin levels and gene polymorphisms with PCOS
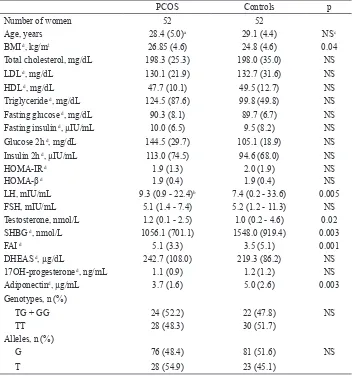
Anthropometric, metabolic and hormones data of women with PCOS and healthy controls are summarized in table 1. BMI values, LH, Testosterone, and FAI levels were signiicantly higher in the PCOS group compared with controls, whereas SHBG were lower (p < 0.05 for BMI, LH and testosterone, p < 0.005 for SHBG, and FAI).
535 bp
382 bp
Tabel 1. Anthropometric, metabolic, hormone, and adiponectin gen polymorphism proiles of women with PCOS and controls
PCOS Controls p
Number of women 52 52
Age, years 28.4 (5.0)a 29.1 (4.4) NSc
BMI d, kg/m2 26.85 (4.6) 24.8 (4.6) 0.04
Total cholesterol, mg/dL 198.3 (25.3) 198.0 (35.0) NS
LDL d, mg/dL 130.1 (21.9) 132.7 (31.6) NS
HDL d, mg/dL 47.7 (10.1) 49.5 (12.7) NS
Triglyceride d, mg/dL 124.5 (87.6) 99.8 (49.8) NS
Fasting glucose d, mg/dL 90.3 (8.1) 89.7 (6.7) NS
Fasting insulin d, µIU/mL 10.0 (6.5) 9.5 (8.2) NS
Glucose 2h d, mg/dL 144.5 (29.7) 105.1 (18.9) NS
Insulin 2h d, µIU/mL 113.0 (74.5) 94.6 (68.0) NS
HOMA-IR d 1.9 (1.3) 2.0 (1.9) NS
HOMA-β d 1.9 (0.4) 1.9 (0.4) NS
LH, mIU/mL 9.3 (0.9 - 22.4)b 7.4 (0.2 - 33.6) 0.005
FSH, mIU/mL 5.1 (1.4 - 7.4) 5.2 (1.2 - 11.3) NS
Testosterone, nmol/L 1.2 (0.1 - 2.5) 1.0 (0.2 - 4.6) 0.02
SHBG d, nmol/L 1056.1 (701.1) 1548.0 (919.4) 0.003
FAI d 5.1 (3.3) 3.5 (5.1) 0.001
DHEAS d, µg/dL 242.7 (108.0) 219.3 (86.2) NS
17OH-progesterone d, ng/mL 1.1 (0.9) 1.2 (1.2) NS
Adiponectind, µg/mL 3.7 (1.6) 5.0 (2.6) 0.003
Genotypes, n (%)
TG + GG 24 (52.2) 22 (47.8) NS
TT 28 (48.3) 30 (51.7)
Alleles, n (%)
G 76 (48.4) 81 (51.6) NS
T 28 (54.9) 23 (45.1)
a Values are the mean (SD), b Values are the median (range), c NS= not signiicant, d Signiicance was
tested on log-transformed values, HOMA-IR= homeostatic model assessment of insulin resistance, HOMA-β= homeostatic model assessment of β cell function, DHEAS= dehydroepiandrosteron
PCOS patients presented with signiicantly lower serum adiponectin levels than healthy controls (3.7 + 1.6 versus 5.0 + 2.6 μg/mL, p = 0.003), which were independent of obesity status (Tabel 1).
The genotype distributions of the T45G polymorphisms in the adiponectin gene were in Hardy-Weinberg equilibrium (χ2 = 0.07, p > 0.05). Overall, there was no
statistically signiicant difference in the distributions of genotypes and alleles for T45G polymorphisms between PCOS women and controls, indicating that the individual polymorphisms at position +45 of adiponectin gene were not associated with increased risk for PCOS (Table 1).
Association of HOMA-IR and HOMA-β with SHBG as predictive marker of insulin resistance
Anthropometric, metabolic and hormones proiles in table 1 shows no signiicantly difference for
HOMA-IR and HOMA-β as calculation models for diagnosing insulin resistance, but SHBG is lower signiicantly in PCOS group than controls (p = 0.003).
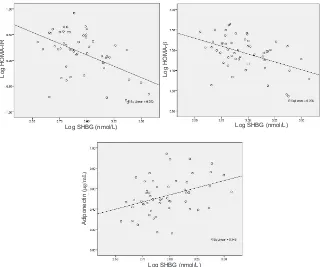
In this study, there was a signiicant association between adiponectin as well as insulin resistance that was represented by HOMA-IR and HOMA-β and SHBG in women with PCOS group, although this was a week association (Figure 2).
Association of hormones, insulin resistance, adiponectin level and gene polymorphism in PCOS women according to BMI
resistance, the lipid proile, and adiponectin levels according to BMI in women with PCOS are given in table 2. This table shows that obese PCOS women had lower levels of LH and lower rates of hyperandrogenemia as indicated by the FAI, than non obese PCOS women (p = 0.04 and p =
0.008 respectively). As expected, obese PCOS women had higher serum adiponectin levels than non obese PCOS women (p < 0.001), and SHBG levels, as predictive marker of insulin resistance, was higher in obese than non obese PCOS women (p = 0.005).
Group A1 Group B2 p
Number of women 20 32
Total cholesterol, mg/dL 202.3 (24.1) 197.8 (25.8) NS
LDL cholesterol, mg/dL 131.6 (19.5) 133.1 (23.8) NS
HDL cholesterol, mg/dL 46.7 (9.7) 46.4 (8.6) NS
Triglyceride, mg/dL 136.3 (105.6) 125.6 (58.4) NS
Fasting glucose, mg/dL 91.7 (8.5) 89.3 (8.8) NS
Fasting insulin 3, µIU/mL 9.1 (5.8) 11.6 (7.2) NS
HOMA-IR 2.1 (1.3) 2.6 (1.9) NS
LH, mIU/mL 8.0 (4.0) 11.4 (6.0) 0.04
FAI 3 4.4 (2.9) 6.6 (3.6) 0.008
SHBG 3 1216.5 (791.9) 866.3 (514.9) 0.005
DHEAS, µg/dL 240.5 (121.3) 247.2 (93.9) NS
17OH-progesterone 3, ng/mL 0.9 (0.7) 1.2 (1.32) NS
Adiponectin 3, µg/mL 4.5 (1.6) 2.3 (0.5) < 0.001
Genotypes, n (%)
TG + GG 8 (38.1) 13 (61.9) NS
TT 12 (38.7) 19 (61.3)
Alleles, n (%)
G 16 (57.1) 12 (42.9) NS
T 48 (63.2) 28 (36.8)
Figure 2.The relationship between sex hormone-binding globulin (SHGB) with HOMA-IR, HOMA-β and adiponectin in PCOS women
Table 2. Metabolic, hormons, and genotypes/ alleles of adiponectin proiles in Group A and Group B in women with PCOS
1 Group A, PCOS women with BMI > 25 kg/m2, 2 Group B, PCOS women with BMI < 25 kg/m2, 3 Signiicance was
tested on log-transformed values, Data is presented as mean (SD), NS= not signiicant
Log SHBG (nmol/L) Log SHBG (nmol/L)
Log SHBG (nmol/L)
Log HOMA-IR Log
HOMA-β
Adiponectin (
The genotype and allele frequency of adiponectin polymorphism at position +45 (T45G) in obese and non obese PCOS women are shown in table 2. The frequency of TG + GG genotype were less frequent among obese PCOS women (8/20, 38.1%) than non obese PCOS women (13/32, 61.9%), but the difference was not statistically signiicant. Allele frequencies for T45G variant in obese PCOS women were 0.75 (T) and 0.25 (G), while 0.70 (T) and 0.30 (G) were in non obese PCOS women. It means that allele G of adiponectin gene (T45G) polymorphism is more frequent in obese than in non obese PCOS women.
In multiple regression analysis between BMI and those parameters to which they were found to correlate signiicantly in women with PCOS (n = 52 showed that adiponectin level is a signiicant independent determinant (p < 0.001).
Effect of adiponectin gene polymorphisms on adiponectin serum and insulin resistance in women with PCOS
Considering that PCOS patients and controls differed signiicantly in BMI values, LH, androgen, SHBG and adiponectin levels, and not significantly different
in genotype and allele of T45G polymorphisms, we further explored these inluences. We analyzed the association of genotypes of the T45G polymorphisms with PCOS biological markers in PCOS patients, and the results were shown on table 3. There were no signiicantly differences of all PCOS biological markers with the genotype of T45G polymorphisms, p > 0.05.
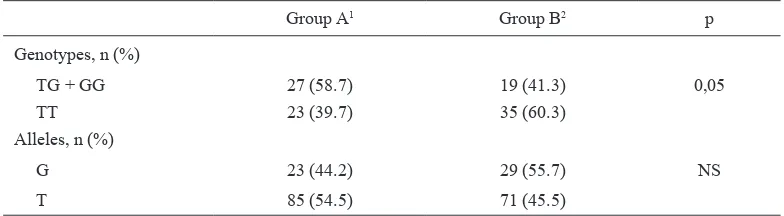
Regarding the T45G polymorphism analysis and the biological markers of PCOS as shown on table 3, the comparison between genotype TT and TG + GG did not yield any significant differences. However, when we performed the analysis in all women of this study participants, which were divided in women with high and low adiponectin levels, genotype frequencies of the T45G polymorphisms between TT and TG + GG showed barely significant difference (p = 0.05), but no significant difference in allele frequency (Table 4).
In addition, the number of TG and GG genotypes were signiicantly more frequent in women with low adiponectin level than in women with normal to high adiponectin level, and the adiponectin levels were higher in TG + GG genotypes than TT genotype both in healthy controls and in PCOS women (Table 4).
Genotypes
p
TT TG + GG
LH, mIU/mL 10.2 (5.9) 8.3 (3.9) 0.20
Testosterone, nmol/L 1.2 (0.6) 1.1 (0.5) 0.63
SHBG*, nmol/L 1202.0 (857.6) 941.5 (477.9) 0.35
FAI* 5.1 (3.5) 5.1 (3.2) 0.49
Adiponectin*, µg/mL 3.6 (1.3) 3.8 (2.0) 0.93
Table 3.Characteristic of various risk factor in women with PCOS according to T45G polymorisms of the adiponectin gene
Table 4. Genotype and allele frequencies of T45G polymorphisms in study participants according to adi-ponectin levels
Group A1 Group B2 p
Genotypes, n (%)
TG + GG 27 (58.7) 19 (41.3) 0,05
TT 23 (39.7) 35 (60.3)
Alleles, n (%)
G 23 (44.2) 29 (55.7) NS
T 85 (54.5) 71 (45.5)
1 Group A= women with adiponectin level < 0.7 µg/mL, 2 Group B= women with adiponectin level > 0.7 µg/
mL, NS= not signiicant
DISCuSSCIOn
The role of adiponectin is far from being completely understood. In particular, in some studies, which associated low levels of adiponectin with obesity, insulin resistance, and PCOS do not permit the causality between the lowering of adiponectin and dysregulated metabolism to be established.15 Recent studies showed
that the serum adiponectin level in PCOS patients was signiicantly lower than in normal individual,16 and
some studies indicated that low adiponectin level in PCOS women was closely correlated with obesity.4,17
This study demonstrated that low levels of adiponectin are associated signiicantly with PCOS, also in PCOS women the adiponectin levels were found to correlate signiicantly with the degree of obesity. Futhermore the multivariat analysis found that adiponectin appeared to have a direct link with PCOS and BMI. These results suggest that adiponectin is involved in the pathogenesis of PCOS and is dependently associated with the degree of obesity.
Jayagopal et al18 and Kajaia et al19 found SHBG
may serve as predictive marker of insulin resistant in hyperandrogenic women. In this study, in PCOS women group there were negative correlations between SHBG with HOMA-IR and HOMA-β, with r values are -0.502 (P < 0.001) and -0.454 (p = 0.001) respectively. These results suggest that SHBG may serve as a marker for hyperinsulinemia in women with PCOS.
PCOS is associated with insulin resistance accompanied by compensatory hyperinsulinemia. Hyperinsulinemia is thought to result in increased androgen biosynthesis20
and decreased levels of SHBG18 as surrogate marker
of insulin resistance, which play a major role in the of pathogenesis of hyperandrogenism. PCOS-associated hyperandrogenemia may modulate plasma adiponectin,21 which could provide a potential
mechanism whereby PCOS-related hyperandrogenemia enchances the susceptibility of PCOS women to the insulin reistance.15
Regarding hypoadiponectinemia in women with PCOS that were found in this study, there must be a contribution of adiponectin genetic variant to the decreased adiponectin levels. In this study, T45G polymorphisms as one of adiponectin genetic variants, were not associated with the anthropometric parameters, hyperandrogenism and adiponectin levels of PCOS women. Futhermore, there were higher frequency of TG + GG genotypes in women with PCOS compared with healthy control, though not signiicantly different. This inding is in concordance with recent studies, where no association was found between T45G polymorphism
with PCOS or obesity, insulin resistance and adiponectin levels in women with PCOS.11,22 However, in this study
the T45G polymorphisms were associated with higher adiponectin levels in both healthy controls and PCOS women.
These indings support the hypothesis that the T45G polymorphism of the adiponectin gene is not directly linked to obesity, metabolic disturbances related to insulin resistance, and biological markers of PCOS. Otherwise the T45G polymorphism of adiponectin gene is directly linked to adiponectin levels, as demonstrated in this population studied.
Diamanti-Kandarakis23 found insulin resistance and
hyperinsulinemia are established pathogenic mechanisms for hyperandrogenism in PCOS, and the facilitation of insulin resistance by androgen excess through the induction of adipokines produced by abdominal adiposity, hypoadiponectinemia may contribute to insulin resistance, hyperinsulinism and hyperandrogenism in PCOS women.24 According to this present results,
there was a signiicantly lower insulin resistance and hypoadiponectinemia in PCOS women, whereas adiponectin levels were associated with the degree of obesity. These indings and the signiicant difference between PCOS and non-PCOS patients suggest that in PCOS women, adiponectin might be weakly associated with insulin resistance.
In conclusion, adiponectin gene polymorphisms (T45G) has no direct association with PCOS biological markers (LH, testosteron, SHBG, FAI), but its association with Laboratory, Prodia Clinical Laboratories, for excellent technical assistances.
REFEREnCES
1. Azziz R, Woods KS, Reyna R, Key TJ, Knochenhauer ES, Yildiz BO. The prevalence and features of the polycystic ovary syndrome in an unselected population. J Clin Endocrinol Metab. 2004;89(6):2745-9.
2. Gambineri A, Pelusi C, Vicennati V, Pagotto U, Pasquali R. Obesity and the polycystic ovary syndrome. Int J Obes. 2002;26(7):883-96.
4. Panidis D, Kourtis A, Farmakiotis D, Mouslech T, Rousso D, Koliakos G. Serum adiponectin levels in women with polycystic ovary syndrome. Hum Reprod. 2003;18:1790-6.
5. Carmina E, Orio F, Palomba S, Cascella T, Longo RA, Colao AM, et al. Evidence for altered adipocyte function in polycystic ovary syndrome. Eur J Endocrinol. 2005;152:389-94. 6. Weyer C, Funahashi T, Tanaka S, Hotta K, Matzuzawa Y,
Pratley RE, et al. Hypoadiponectinemia in obesity and type 2 diabetes: close association with insulin resistance and hyperinsulinemia. J Clin Endocrinol Metab. 2001;86:1930-5. 7. Kraja AT, Hunt SC, Pankow JW, Myers RH, Heiss G, Lewis
CE, et al. Quantitative trait loci for metabolic syndrome in the hypertension genetic epidemiology network study. Obes Res. 2005;13(11):1885-90.
8. Hu FB, Doria A, Li T, Meigs JB, Liu S, Memisoglu A, et al. Genetic variation at the adiponectin locus and risk of type 2 diabetes in women. Diabetes. 2004;53:209-13.
9. Menzaghi C, Ercolino T, Di Paola R, Berg AH, Warram JH, Scherer PE, et al. A haplotype at the adiponectin locus is associated with obesity and other features of the insulin resistance syndrome. Diabetes. 2002;51:2306-12.
10. Stumvoll M, Tschritter O, Fritsche A, Staiger H, Renn W, Weisser M, et al. Association of the T-G polymorphism in adiponectin (exon 2) with obesity and insulin sensitivity: interaction with family history of type 2 diabetes. Diabetes. 2002;51:37-41.
11. Panidis D, Kourtis A, Kukuvitis A, Farmakiotis , Xita N, Georgiou I, et al. Association of the T45G polymorphism in exon 2 of the adiponectin gene with polycystic ovary syndrome: role of Δ4-androstenedione. Hum Reprod.
2004;19:1728-33.
12. The Rotterdam ESHRE/ASRM-Sponsored PCOS
Consensus Workshop Group. Revised 2003 consensus on diagnostic criteria and long-term health risks related to polycystic ovary syndrome (PCOS). Hum Reprod. 2004;19:41-7.
13. International Association for the Study of Obesity and the International Obesity Task Force. The Asia Paciic perspective: redeining obesity and its treatment. WHO Western Paciic Region; WHO: 2002.
14. Wallace TM, Levy JC, Matthews DR. Use and abuse of HOMA modelling. Diabetes Care. 2004;27(6):1487-95. 15. Spranger J, Möhlig M, Wegewitz U, Ristow M, Pfeiffer
AFH, Schill T, et al. Adiponectin is independently associated with insulin sensitivity in women with polycystic ovary syndrome. Clin Endocrinol. 2004;61:738-46.
16. Yilmaz M, Bukan N, Demirci H, Ozturk C, Kan E, Ayvaz G, et al. Serum resistin and adiponectin levels in women with polycystic ovary syndrome. Gynecol Endocrinol. 2009;25:246-52.
17. Orio F, Palomba S, Cascella T, Milan G, Mioni R, Pagano C, et al. Adiponectin levels in women with polycystic ovary syndrome. J Clin Endocrinol Metab. 2003;88:2619-23. 18. Jayagopal V, Kilpatrick ES, Jennings PE, Hepburn DA,
Atkin SL. The biological variation of testosterone and sex hormone-binding globulin (SHBG) in polycystic ovarian syndrome: implications for SHBG as a surrogate marker of insulin resistance. J Clin Endocrinol Metab. 2003;88(4):1528-33.
19. Kajaia N, Binder H, Dittrich R, Oppelt PG, Flor B, Susanne C, et al. Low sex hormone-binding globulin as a predictive marker for insulin resistance in women with hyperandrogenic syndrome. Eur J Endocrinol. 2007;157:499-507.
20. Aroda VR, Ciaraldi TP, Burke P, Mudaliar S, Clopton P, Philips S, et al. Metabolic and hormonal changes induced by pioglitazone in polycystic ovary syndrome: a randomized, placebo-conrolled clinical trial. J Clin Endocrinol Metab. 2009;94(2):469-76.
21. Nishizawa H, Shimomura I, Kishida K, Maeda N, Kuriyama H, Nagaretani H, et al. Androgens decrease plasma adiponectin, an insulin-sensitizing adipocyte-derived protein. Diabetes. 2002;51:2734-41.
22. Escobar-Morreale HF, Villuendas G, Botella-Carretero JI, Álvarez-Blasco F, Sanchón R, Luque-Ramirez M, et al. Adiponectin and resistin in PCOS: a clinical, biochemical and molecular genetic study. Hum Reprod. 2006;21:2257-65. 23. Diamanti-Kandarakis E. Insulin resistance in PCOS.
Endocrine. 2006;30(1):13-7.