www.getview.org
HAERYIP SIHOMBING1, HAFIZ2, M.K., YUHAZRI3, M.Y., KANNAN4, R.
1, 3
Faculty of Manufacturing Engineering Universiti Teknikal Malaysia Melaka
Hang Tuah Jaya, 76100 Durian Tunggal, Melaka, MALAYSIA 1
2, 4
Faculty of Mechanical Engineering Politeknik Merlimau Melaka Pejabat Pos Merlimau, Melaka MALAYSIA
1.0 INTRODUCTION
According to Adam et al., (1986), quality is the degree to which a product or service conforms to a set of predetermined standards, especially to the characteristics that determine its value in the market and its performance of the function to which it was designed. Based on this reason, quality is the result of a comparison between what was required and provided which it can be different things to different people and taken into account of both objective and subjective interpretations against the needs and expectations of customers (Chartered Quality Institute, 2012). When it is related to products, Meirovich et al., (2007) underlined that the quality is, in facts, the degree to which a product or service’s design (specification) fits to customer needs and expectations. While the conformance to quality is related to the degree of how match between the features of a specific product (service) to its specification. This is why the customers’ expectation involves the specification as a quality of product or service. And also the comparison against the competitors in the marketplace as which Prat and Tort (1989) in their study discusses why the pet food manufacturing companies need to implement the quality improvement as crucial task in order to survive in today’s marketplace.
Based on this consideration, if the improvement tasks and programs made are mainly in reducing the variability as well as other failure of products through the inspection in order to maintain economic viability, the facts that by such controlling conducted to the quality of product is, certainly, risked with the cost consumed (Jurans’ appraisal and failure cost). This is due to since a product must be efficient to manufacture and insensitive to variability on the factory floor and in the field, the business or company should therefore focus their concern through the development of extensive carefully planned experimentation at the design stage of products or processes. On this, by employing design of experiments (DOE) of the quality engineering methods proposed by Dr. Taguchi as one of the most important statistical tools of TQM for designing high quality, according to Unal and Dean (1991), will minimizing the process variation and reducing rework, scrap and the need for inspection systems at reduced cost.
In addition, although Design of Experiments (DOE) is the method related to experiment in terms to define the systematic procedure carried out under controlled conditions in order to discover an unknown effect, Genichi Taguchi developed this concept to improve the quality of manufactured goods based on the concept of "Uniformity around a target value." Related to this perspectives, Antony (2002) reported about the successful application of Taguchi method by many US and European manufacturers over the last 15 years in order to improve their product quality and process performance. This is due Taguchi concert off-line quality control based on an understanding of the loss function, system design, parameter design and tolerance design, that
ABSTRACT
The purpose of this study is to optimize the manufacturing process of the SME bread product using Taguchi method. The study is focused on the quality problems occurred as the outcomes of the process (quality of the bun produced) related to controllable factors of products design identified (machine temperature and length duration time) for the improvement required. By implementing the technique of analysis of variance (ANOVA), the composition of the controlled parameters, such as machine temperatures and duration times, is therefore determined and constructed into Orthogonal Array (OA) of L9(33) related to what the setting parameters produces the optimal output. To improve the quality of the manufactured product, the setting of parameter recommended in this study is A2B2C2 or A1B2C2 {(Low or High) ∩ 10minutes ∩ 200OC)}.
Keywords: Taguchi method, Bread Manufacture, Loss Function, S/N Ratio.
enables the product development process is immediately produces a quality product or process at the lowest possible cost and thus the online quality control function during manufacturing and service after the sale effort are therefore reduced.
In facts, in the Small and Medium Enterprise (SME) food manufacturing where the manufacturing process runs in the traditional ways (Dhungana, 2003) and (Zulkifly et al., 2000), the varieties quality of products are
always occurred. There are also found the limited implementation of management system and quality control
towards the product to meet the specification, beside the lack of skill and knowledge operators. In facts, the problems occurred and found in this study are mostly due to setting the parameter of the machine to meet the specification of the end product. Since the company runs their production system solely depend on the visual inspection method to confirm the specification of end product (decision to finish the process of the bread cooking), then this condition effect to inconsistently quality of food products. Some of them are even overcooked or incomplete cook. Based on this reason, this study is carried to identify the parameter factors that affects to the quality of food manufacturing process and to determine the optimal parameter factors of food manufacturing process by using Taguchi Method.
2.0 LITERATURE REVIEW
2.1 DOE Using Taguchi
Sukthomya and Tannock (2005) stated that Taguchi (1986) introduced a simplified and modified DOE approach which has been widely adopted by industry. This is due to Taguchi method is a technique for designing and performing the experiments to investigate the processes (where the output depends on many factors such as variables and inputs), without having to slow and uneconomically run the process caused by all possible of combinations values (Dobrzañski et al., 2007). Taguchi formulated both a philosophy and methodology for the process of quality improvement that depends on statistical concepts, especially statistically designed experiment. On this, the concept design is considered to be the first phase of the design strategy. This phase gathers the technical knowledge and experiences to help the designer to select the most suitable one for the intended product (Bharti and Khan, 2010).
Refer to American Supplier Institute (1992), Taguchi developed an approach to design of experiments that addressed the realities of industrial design, productivity and cost effectiveness based on the relationship between technology, variation, cost and savings. Since the classical experimental design methods are time consuming where the experiments must be performed when the number of control factors is high, Taguchi methods use a special design of orthogonal arrays to study the entire facto space with only a small number of experiments (Bharti and Khan, 2010).
The development of Taguchi’s method is based on orthogonal arrays (OA) related to statistics (Weng et al., 2007). Orthogonal Array (OA) is one part of the experimental group who only use part of the state total, where this section perhaps only half, quarter or an eighth of a full factorial experiment. An optimal experimental design should provide maximum amount of information by means of minimum experimental trials (Boran and Hocalar, 2007). Chong et al., (2009) stated that Orthogonal Array (OA) is a statistical DOE that is mostly applied in the manufacturing quality control and rapid software testing for faults detection.
OA is the matrix of numbers arranged in columns and rows. The Taguchi method employs a generic signal-to-noise (S/N) ratio to quantify the present variation. These S/N ratios are meant to be used as measures of the effect of noise factors on performance characteristics. S/N ratios take into account both amount of variability in the response data and closeness of the average response to target. There are several S/N ratios available depending on type of characteristics: smaller is better, nominal is best (NB) and larger is better. Refer to Cheng (2001), Taguchi has tabulated 18 basic orthogonal arrays that known as the standard orthogonal arrays. Each orthogonal array uses a notation that indicates its number of rows and columns, as well as the number of level in each column.
2.2 Manufacturing System
Today, the earliest forms of bread would have been very different from how we can see in industrialized countries and it would probably be closest in character to the modern flat breads of the Middle East (Cauvain, 1999). The common process of producing breads is mainly based on 3 steps: dough formation, fermentation, and baking.
2.2.1 Dough formation
Cauvain (1999), kneading is the development of gluten structure in the dough through the application of energy during mixing. Mixing the dough provides two functions: homogeneous distribution of components, and development of the gluten matrix. Gluten is the skeleton of wheat-flour dough and responsible for gas retention which provides the production of light loaf of bread. Mixing time varies with the flour, dough temperature, dough consistency, and mixer.
2.2.2 Fermentation
Duration of the fermentation process depends on the amount and the quality of the ingredients. Yeast is the most important ingredient that affects the fermentation process. The relationship between dough development time and yeast level probably comes from the contribution that enzymes present in the yeast cells, viable or dead. They modify the protein structures, which are forming with increasing dough resting time. Flour also contains enzymes, which can contribute to dough development. Since the mechanism for dough development in fermentation depends on yeast activity, the temperature of the dough play a major role in determining the time at which full development is achieved (Cauvain, 1999).
2.2.3 Baking process
During baking several changes take place both in the crumb and crust. The browning reaction that involves both ‘caramelization’ of sugars and ‘proteinaceousmaterials’ imparts a deep color to the crust. Thermal decomposition of starch and formation of ‘dextrins’ contribute to crust brightness. This is accompanied by formation of flavor and taste components. At the same time changes take place inside the loaf of bread. At early stages, the increase in temperature will enhances enzymatic activity and growth of yeast and bacteria. At about 50OC-60OC, the yeast and bacteria are killed.
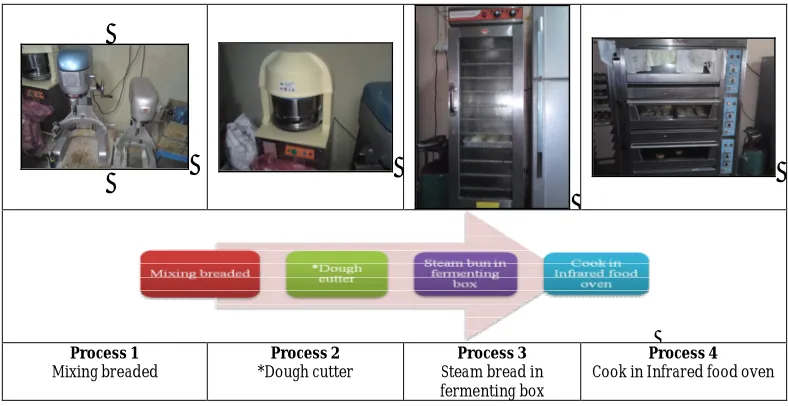
While on beyond temperature starch gelatinizes, proteins coagulate, and enzymes are inactivated. Steam is formed at around 100ºC, at which the final volume and crumb texture of the bread are set. The inside of the loaf does not exceed 100ºC; however, in the crust much higher temperatures are attained. In the temperature range of 100-150ºC, light and brown dextrin are formed which are followed by caramel (Pomeranz, 2004).The bread is allowed to cool at room temperature and ready for packaging. Figure 1 show the sequence production process in manufacturing bread.
Process 1
Mixing breaded
Process 2
*Dough cutter
Process 3
Steam bread in fermenting box
Process 4
Cook in Infrared food oven
Figure 1: Process Machine (Flow)
3.0 RESULTS AND DISCUSSION
3.1 Study on Current Manufacturing System
This study is conducted on the current food manufacturing system against the characteristic behavior of the selected controllable parameters applied in the food manufacturing production line process. The flow process and the steps of manufacturing as described below.
To determine the relationship between the quality of manufactured product and visual control parameter of production line, the data collected is analyzed using Minitab software. By carrying out the experiment related to the process of control parameter design, the quantity, and location of reject items are identified and recorded, where a step plan used is to analyze results and implement solutions (Antony et. al., 2001).
3.2 Experiment Flow Process
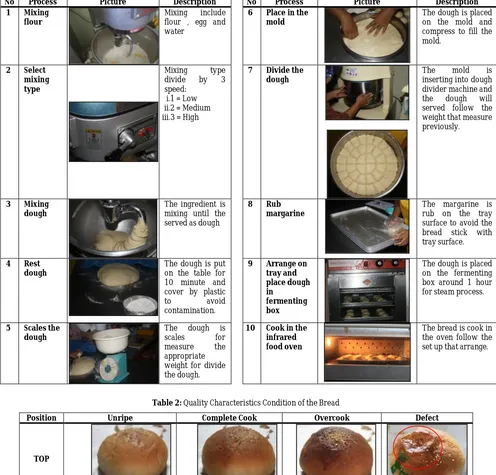
The experiment is carried out with several of the process which beginning of mixing flour until finishes cooking. The process flow of the production of the bread are illustrate in Table 1.
3.3 Bread Inspection
The declaration of the bread inspection is based on the visual inspection on the surface of the bread. The inspection is doing manually for the appearance of the final product to confirmed the bread is acceptable and can be through the next process, packaging. The color of the bread (complete cook) and surface peak of final product are the measurable quality characteristics of this project. There are other characteristics that can be measured, but both of the above quality characteristics are considered for the most important criteria of market products by consumers. The table 2 shows the accepted and rejects condition for quality characteristics of the bread.
Values of quality characteristics (color of bread surface and surface peak of products) are affected by the conditions during production process of bread products. Diversifying values of baking duration and baking temperature of samples and the speed mixing type of ingredients of samples significantly affected quality characteristics. For this experiment considered, the above conditions are the factors of the experimental procedure. Since the purpose of this experiment is the optimization of bread product process, any non-linear relationship was taken into consideration. Here, non-linear effects are to be studied and it is necessary to choose more than two levels for each factors (Antony et al., 2001). The control factors and levels selected are shown in the table 3.
The experimental procedure is carried out in a controlled environment, as the experiment conditions remained stable. This ensures that there is no impact on results from external factors and the only conditions during the experiment varied in their values are three control factors, that is, mixing type, baking duration and baking temperature of process varied in each experiment trial. The quantities of
1.The first step is the mixing of the ingredients to make the dough of the bread.
1.Process 1: Mixing breaded
•This process evenly distributes the ingredients, develop the gluten and to initiate fermentation
•The machine has 3 alternative speeds scale.
•To change the speeds, first turn off the motor, then move the shifter handle to the desired speed.
•Speed number 1 for slow speed is for heavy mixtures. In many mixing operation, it is customary to start on speed number 1 and then change to a higher speed as the work progresses.
•Speed number 3 for fast speed is for light work as whipping cream, beating eggs and mixing thin batters. 2.Then, the prepared dough is divided into several amounts by
using dough cutter machine.
3.The dough are then will arranged on the tray. The composition of the dough is properly arranged to make sure the dough will baked completely later.
2. Process 2: Dough cutter
•This process is continued from the first process which divide the dough to several quantity that needed with set up at the machine button.
•The capacity for one cycle process is 112 pcs. per min. 3.The dough which has been prepared on the tray will then on
hold in the fermenting box to ensure the dough is steamed to maintain the dough.
3. Process 3: Bread fermenting box
•The prepared dough is transferred to the fermenting box. This is required to keep the bun in good condition, fresh
4. Process 4: Infrared food oven
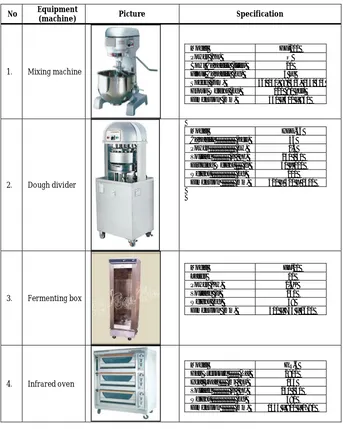
ingredients remained stable for all samples, based on the recipe that used always the industry for production of particular bread product. Figure 2 shows the equipment used to conduct the experiment.
Table 1: Process flow of the production of the bread
No Process Picture Description No Process Picture Description
1 Mixing
Table 2: Quality Characteristics Condition of the Bread
Position Unripe Complete Cook Overcook Defect
TOP
BOTTOM N/A
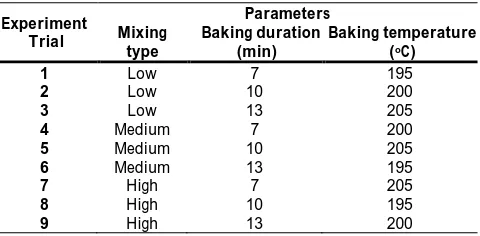
Table 3: Control factors and levels of the experimental design
3.4 The L9 Orthogonal Array Experiments
An Orthogonal Array (OA) is a matrix of numbers arranged in rows and columns. Each row represents the levels of the selected factors of a given experiment and each column represents a specific factors whose effects on the output. An OA help an experiments plans easily constructed by assigning factors to columns of the OA, then matching the different symbols of columns with the different factor levels. OA have the balanced property that every factor setting appear the same number of times for every setting of all other factors in the experiments.
In this research, the L9 (33) OA as shown in Table 4 is selected for the controllable factors since it is
the most efficient orthogonal design to accommodate three factors at three levels. The L9(33) array
specifies nine experimental run to be performed. This means that nine experimental trials with different combinations of the factors should be conducted in order to study the main effects. Three controllable factors is identified which could affect the quality of the bread manufacturing process. There are three parameters with three levels each. The three controllable factors parameters which selected are mixing type, baking duration (min) and baking temperature (OC). It is decided to test each controllable factor at three levels (Table 5).
The sequence in which the experiments were carried out was randomized to avoid any kind of personal or subjective bias which may be conscious or unconscious. The Table 6 shows the combination of process variables for all nine experiments that have been run.
Table 6: Taguchi L9 (33) orthogonal array design
Experiment Trial
Parameters Mixing
type
Baking duration (min)
Baking temperature (oC)
1 Low 7 195
2 Low 10 200
3 Low 13 205
4 Medium 7 200
5 Medium 10 205
6 Medium 13 195
7 High 7 205
8 High 10 195
9 High 13 200
Table 4. Experiment layout using
L9 (33) orthogonal array
Experiment Trial Parameters
A B C
1 1 1 1
2 1 2 2
3 1 3 3
4 2 1 2
5 2 2 3
6 2 3 1
7 3 1 3
8 3 2 1
9 3 3 2
Table 5: Selected process parameters
and their respective levels in experimental design
Process Parameters Symbol 1 (Low) 2 (Medium) 3 (High) Level
Mixing type A Low Medium High
Baking duration (min) B 7 10 13
No Equipment
(machine) Picture Specification
1. Mixing machine
Model GF-201
Power (hp) ½
Bowl Capacity (liter) 20
Flour Capacity (kg) 3 kg
Speed (rpm) 46/ 150, 88/ 316, 154/ 505
Gross Weight (kg) 120 (90 net)
Dimension (mm) 550 x 500 x 840
2. Dough divider
Model HDD-36
Capacity (pcs) 36
Power (kw) 1.5
Voltage (v / hz) 240 / 50
Dividing Weight (g) 30 ~ 100
Weight (kg) 200
Dimension (mm) 520 X 420 X 1400
3. Fermenting box
Model FX-11
Layer 11
Power (Kw) 2.5K
Voltage (v) 240
Weight (kg) 48
Dimension (mm) 500 x 755 x 1620
4. Infrared oven
Model GR-6
Gas Pressure (Pa) 2800
Heat Load (mj / hr) 135
Voltage (v / hz) 240 / 50
Weight (kg) 480
Dimension (mm) 1355 x 800 x 1780
Figure 2: The list of equipment used for experiment
4.0 DATA AND DISCUSSIONS
The result of bread manufacture processes in this experiment is based on mean value of four samples at each set of experimental conditions for each process parameter variable. Table 7 shows the summarized result and it is found that experiment number 4 is the best combination control factor since the quantity of manufactured bread is greater in total accepted product.
4.1 Signal-to-Noise Ratio
The Taguchi’s method provides the orthogonal array as a mathematical tool that allows the analysis of the relationship between a large numbers of design parameters by using only a limited number of experiments run. The target based on the conditions identified which resulting the optimal process or product performance. Here, the S/N ratio is the Taguchi advocates for measuring the quality through orthogonal array based experiments. The S/N ratio is used to convert the trial result data into a value for the evaluation characteristics as the optimum setting analysis.
Table 7: Summarized results of manufactured bread quality (See Appendix)
Experiment Trial
Total accepted
Reject
Total Unripe Defect Overcook
1 12 3 0 0 3
2 13 0 2 0 2
3 0 0 0 15 15
4 14 1 0 0 1
5 15 0 0 0 0
6 7 0 3 5 8
7 11 0 4 0 4
8 11 0 3 1 4
9 12 0 0 3 3
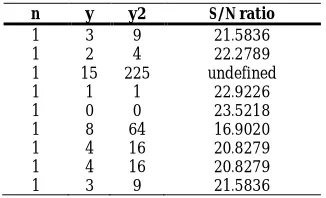
The S/N ratio selected for this study is larger-the-better quality characteristics. The calculation and equation for S/N ratio is as following:
4.1.1 Larger- the- better:
S/N = -10 log (∑ (1/yi2) / n)
Where,
yi= each observation value
n = number of observation (values at each trial condition)
The result is as Table 8.
Table 8: Calculation for S/N ratio (Larger-the-better)
n y y2 S/N ratio
1 3 9 21.5836
1 2 4 22.2789
1 15 225 undefined
1 1 1 22.9226
1 0 0 23.5218
1 8 64 16.9020
1 4 16 20.8279
1 4 16 20.8279
1 3 9 21.5836
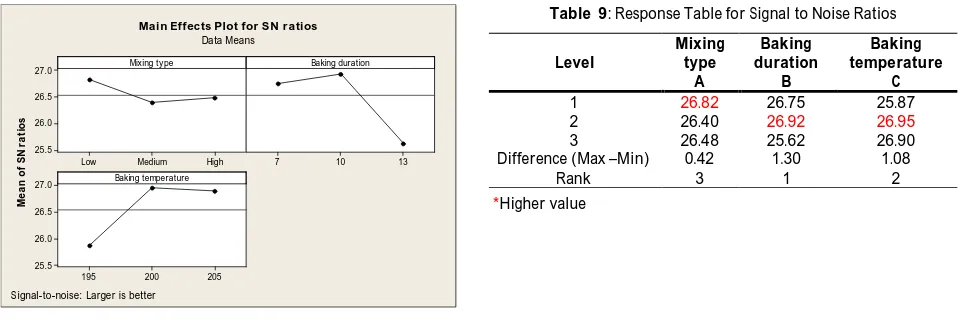
4.1.2 Main effect of signal-to-noise ratio (S/N) response
The main effect plot is a plot of the mean response values at each level of design parameter or process variables. The sign of the main effect indicates the direction of the effect, whether the average response value is increases or decreases. The magnitude indicates the strength of the effect. If the effect of a design or process parameter is positive, it implies that the average response is higher at high level then at low level of the parameter setting. In contrast, if the effect is negative, it is means that the average response at the low level setting of the parameter more than at the high level.
4.1.3 Main effect plot for signal-to-noise ratio
Figure 3 shows S/N graphs for the bread manufactured experiment respectively. Basically, the larger the S/N ratio shows the better the quality. Based on this graph, it reveals that the trend of the mixing type is less significant than other factors. The S/N ratio is slightly decreased from low setting to medium setting, but the S/N ratio is slightly increased and approach to the mean line for high type of mixing setting. For baking duration, the graph trend begins with slightly increased between 7 minute and 10 minute of baking process. The S/N ratio value between 10 minutes and 13 minutes is squally decreased and approach to the minimum of the S/N ratio value. For baking temperature, the S/N ratio is smoothly increased between 195 oC and 200 oC and approach to the
maximum of S/N ratio which then followed by slightly decreased of baking temperature of 200 oC
to 205 oC. Based on the Figure 3 and Table 9, it can be describe that the baking duration is the main
factor influenced to the quality of the output of the bread manufacturing process. It shows that the baking duration is the control factor that has the most significant factor. The effect of the other factors (A and C) is of less significance.
Clearly, the S/N ratio of mixing type at level 1 appears to be the best choice since it corresponds to the highest average S/N ratio. The mean S/N ratio of baking duration is 26.75, 26.92 and 25.62 at level 1, level 2 and level 3 in respectively. The S/N ratio for baking duration suggests that parameter at level 2 is better than at level 1 and level 3. Level 2 shows as the highest average of S/N ratio and is considered as the best choice. For S/N ratio of baking temperature, same as previous, level with highest S/N ratio will be chosen so; the best choice is at level 2 with 26.95. From the analysis above, the optimum parameters selected to optimize the quality of bread manufactured are A1B2C2.
The maximum-minimum value is equal to the range of S/N ratio variance due to the change in the level setting. The larger the range, the more powerful impact the control factor has on quality. The ranking in Table 10 show that S/N ratio of baking duration, which has ranking 1, has relatively strong impacts and influence on the quality of bread. S/N ratio of mixing type and baking temperature which has ranking 2 and 3 respectively have relatively weak impacts. So, S/N ratio of baking duration should be strictly controlled for high quality of bread during the manufacturing process.
Instead, Table 9 shows that the most significant factor for the output of the product is the control factor toward B (Baking duration). The effect of the other factors (A and C) is of less significant. Since the objective of this study is to optimize the bread product process, the S/N ratio should be maximal in order to minimize variability. Thus, factor B should be to set at level 2 in order to get the maximum result.
4.1.4 Main effect plot for means
Figure 4 shows the mean graphs for the bread manufactured experiment. Basically, the larger of the S/N ratio is as the better of quality. Figure 4 shows the best levels for each control factors to obtain the optimal accepted of the bread product. Based on the graph, it shows that the trend of the mixing type is less significant compared to other factors. The mean is slightly decreased from low setting to medium setting, but then slightly increased by approaching the mean line for high type of mixing setting. For baking duration, the graph trend begins with slightly increased between 7 minute and 10 minute of baking process. The mean value between 10 minute and 13 minute is squally decreased by approaching the minimum of the S/N ratio value. For baking temperature, the mean is smoothly increased between 195oC and 200oC by approaching the maximum of mean and
follow by slightly decrease for baking temperature of 200oC to 205oC. From the Figure 4 and Table
10, it can be described that the baking duration is the main factor that influence the quality of the output of the bread manufacturing process. It shows that the baking duration is the control factor that has the most significant factor. The effect of the other factors (A and C) is of less significance.
Table 10 shows the average mean values for the experiment respectively at three levels setting of each factor and the effect of each main effect on the mean. The mean of mean values for the mixing type at level 1, level 2 and level 3 is 21.93, 21.12 and 21.08 in respectively. Clearly, the mean of mixing type at level 1 appears to be the best choice since it corresponds to the highest average mean. The mean of baking duration is 21.78, 22.21 and 19.24 at level 1, level 2 and level 3 in respectively. This is means that for the baking duration, the parameter at level 2 is better than at level 1 and level 3. Same as previously, the level with highest mean will be chosen as the best choice, which is 22.26.
Based the analysis above, the optimum parameters selected to optimize the quality of bread manufactured is A1B2C2. Since the maximum-minimum value is equal to the range of mean variance
High
Figure 3: Main effects plot for S/N ratio of experiment
Table 9: Response Table for Signal to Noise Ratios
due to the change in the level setting, the larger the range, the more powerful impact the control factor has on quality. The ranking in Table 11 shows that the baking duration has ranking 1 and relatively strong impacts and influence on the quality of bread. Thus, the mixing type and baking temperature are the ranking 2 and 3 where they are relatively give the weak impacts..
Table 10 shows that the most significant factor for the output of the product is control factor B (Baking duration). The effect of the other factors (A and C) is of less significant. Since the objective of this project is to optimize the bread product process, what is required is to the maximum values in order to minimize variability. Thus, factor B should be to set to Level 2 in order to get the maximum result.
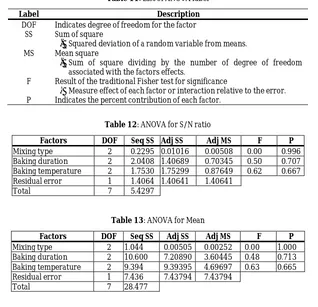
4.2 Analysis of Variance (ANOVA)
The purpose of the ANOVA is to investigate and recognize which process have the significantly affects to the quality of the manufactured bread. From the analysis, it is used to identify which factors are the most important in terms of quality characteristic. Consequently, the important factors identified have to be properly monitored during the process for a consistently gather high quality of bread product.
The ANOVA analysis is performed by noting the sources of variation in the left hand column, which are the factors under the experiment. The description of the label in ANOVA analysis is as follow:
Table 11: List of ANOVA label
Label Description
DOF Indicates degree of freedom for the factor SS Sum of square
- Squared deviation of a random variable from means. MS Mean square
- Sum of square dividing by the number of degree of freedom associated with the factors effects.
F Result of the traditional Fisher test for significance
- Measure effect of each factor or interaction relative to the error. P Indicates the percent contribution of each factor.
Table 12: ANOVA for S/N ratio
Figure 4: Main effects plot for Data Means of experiment
Table 10: Response Table for Means
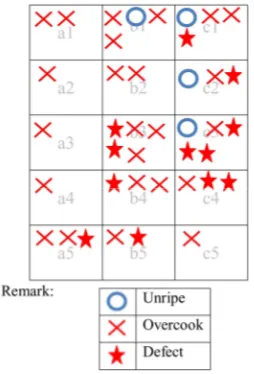
At the end of the experiment, the result shows that the combination of parameters factors produce the different output of the bread manufacturing process. The influences of the combination carried out are illustrated in Figure 5 for all of 9 experimental trial, where the defects detected at the each of the matrix array location on the tray. It shows that the most high defect area is at the b3 and c3 area which consist of 5 defects. The area of b1 and c1 as the second highest defects area with 4 defects occurred during the experiment. From the experiment of factor arrangement in orthogonal array (OA), the location of the defects related to the combination of setting parameter factor, such as mixing type, baking duration and baking temperature identified. It is found that the highest of defects area occurred at the 2, 3, 6,7,8,9 arrangement number of experiment trial.
Figure 5: Bread location for overall experiment trials
Based on the combination parameter factors, it is found that the setting parameter of L-H-H , M-H-L and H-L-L are having greater influences to the rejected output at the critical location (b3 and c3). Since the specific location found as the repeatable defects location, the further study required is by analyzing the influence of the heat transfer in the oven that may affect the quality of the bread.
5.0CONCLUSION
In this project, the mixing type, baking duration and baking temperature is identified as the parameter factors that affects to the quality of food (bread) manufacturing process. The analysis using Taguchi‘s method shows that the optimal result achieved when the parameter setting of the process is A1B2C2. This is means that the
mixing type should set to low, baking duration at 10 minutes and baking temperature at 200 0C. This optimum
process of controlled parameters setting indicated that the baking duration is as the most significant factor. Since the measurement of the bread quality characteristic in this study is determined by visual inspection, the development method to inspect the taste, weight, surface peak, shape, texture or structure of bread products are also required for further study. In addition, the further study required is against the heat transfer distribution of the oven that is influenced by location of heat generator (microwave) towards the objects.
ACKNOWLEDMENTS
The authors would like to thank CRIM-UTeM. This project is supported by CRIM through PJP/2011/FKP (11D) S00878.
REFERENCES
[1] Adam, E.E., Jr., Hershauer, J.C. and Ruch, W.A. (1986): Productivity and Quality: Measurement as a Basis for Improvement. Columbia, MO: University of Missouri, College of Business and Public Administration, Research Center.
[2] American Supplier Institute Inc. (AS) (1989): Taguchi Methods: Implementation Manual. ASI, Deadborn, MI. [3] Antony, J., Knowles, G. and Taner, T. (2001): 10 Steps to Optimal Production. Quality, Vol.40, No.9,
[4] Antony, J. (2002): Taguchi Methods of Experimental Design for Continuous Improvement of Process Effectiveness and Product Quality. “, in Antony, J. and and Preece D. (Ed) Understanding, Managing and Implementing Quality: Framework, Techniques, and Cases. Routledge, London, pp.81-102.
[5] Antony, J. (2006): Taguchi or Classical Design of Experiments: a Perspective from a Practitioner. Sensor Review, Vol.26, No.3, pp.227-230.
[6] Bharti, P.K. and Khan, M.I. (2010): Recent Methods for Optimization of Plastic Injection Molding Process –A Retrospective and Literature Review.” International Journal of Engineering Science and Technology, Vol.2, No.9, pp.4540-4554.
[7] Boran, S. and Hocalar, E. (2007): Defining The Effectiveness of Factors in Process of Drying Industrial Bakers Yeast by Using Taguchi Method and Regression Analysis and Comparing the Results. International Quality Conference, Quality Festival 2007, Kragujevac (8-11 May 2007).
[8] Cauvain, S.P. (1999): Breadmaking Processes. In Cauvain, S.P. and Young L.S. (Eds), Technology of Breadmaking. Blackie Academic and Professional, New York, pp.16-42.
[9] Chartered Quality Institute, World Quality Day 2012: Celebrate with Events, 5-9 November 2012. Available at http://www.thecqi.org/Documents/community/WQD/Introduction%20to%20quality.pdf
[10]Chong, M.N., Jin, B., Chowc, C.W.K., and Saintc,C.P. (2009): A New Approach to Optimise an Annular Slurry Photoreactor System of Degradation of Congo Red: Statistical Analysis and Modelling. Chemical Engineering Journal, Vol.152, pp.158-166..
[11]Dhungana, B. (2003): Strengthening the Competitiveness of Small and Medium Enterprises in Globalisation Process: Prospects and Challenges. Investment Promotion and Enterprise Development Bulletin for Asia and the Pasific, Vol.1, pp.1-32.
[12]Dobrzañski, L.A., Domagala, J. and Silva, J.F. (2007): Applications of Taguchi Method in the Optimization of Filament Winding of Thermoplastic Composites. Archives of Materials Science and Engineering, Vol. 28, No. 3, pp.133-140.
[13]Meirovich, G., Brender-Ilan, Y., and Meirovich, A. (2007): Quality of Hospital Service: The Impact of Formalization and Decentralization. International Journal of Health Care Quality Assurance, Vol. 20 No.3, pp.240-252.
[14]Pomeranz, Y. (1987): Modern Cereal Science and Technology. VCH Publishers, USA. ,pp.248-249
[15]Prat, A. and Tort, X. (1989): Case Study: Experimental Design in A Pet Food Manufacturing Company. Report No. 37 Center for Quality and Productivity Improvement, University of Wisconsin- Madison (October 1989).
[16]Simpson, T.W., Wysk, R. A., Niebel, B.W. and Cohen, P.H. (2000): Manufacturing Processes: Integrated Product and Process Design. New York: The McGraw-Hill Companies, Inc.
[17]Sukthomya, W. and Tannock, J.D.T. (2005): Taguchi Experimental Design for Manufacturing Process Optimisation using Historical Data and a Neural Network Process Model. International Journal of Quality & Reliability Management, Vol. 22 No. 5, pp.485 – 502.
[18]Taguchi, G. (1986): Introduction to Quality Engineering; Designing Quality into Products and Processes, Asian Productivity Organization, Japan.
[19]Unal, R. and Dean,E.B. (1991): Taguchi Approach to Design Optimization for Quality and Cost: An Overview. 13th Annual Conference of the International Society of Parametric Analysis, (21-24 May, 1991).
[20]Weng, W.C., Yang, F. and Elsherbeni,A. (2007): Electromagnetics and Antenna Optimization Using Taguchi’s Method. Synthesis Lectures on Computational Electromagnetics, Vol. 2, No. 1 , pp. 1-94.
APPENDIX
) Quality Characteristics (Surface Inspection)