UNIVERSITI TEKNIKAL MALAYSIA MELAKA
QUALITY IMPROVEMENT OF AUTOMATIC CUTTING AND
SEWING MACHINE IN POLYPROPELENE MANUFACTURING
INDUSTRY
This report submitted in accordance with requirement of the Universiti Teknikal Malaysia Melaka (UTeM)for the Bachel Degree of Manufacturing Engineering
(Manufacturing Management) with Honours
by
ROSNAH BINTI SAHAK
APROVAL
This project submitted to the senate of UTeM and ha s been accepted as fulfillment of the requirement for Degree of Bachelor of Manufacturing Engineering (Honors) (Management). The members of supervisory committee
are as follows:
________________________________ Main supervisor
DECLARATION
I hereby, declare this report entitled “Quality Improvement of Automatic Cutting and Sewing machine” is the result of my own project except as cited in
the references.
Signature : __________________ Author‘s Name :
ABSTRACT
ABSTRAK
DEDICATION
ACKNOWLEDGEMENTS
First at all I would like to extent my gratitude and thankful to Allah S.W.T because of Allah S.W.T Power and Blessing help me to finish my project. Then, I would like to my supervisor, Mr Hasoloan Haery Ian Pieter for this excellent supervision, invaluable guidance, trust, advice and constant help, support, encouragement, and assistance towards me through this project.
I would like to express my deepest appreciation to Assess Product (M) Snd.Bhd. for providing me the place, time and always show their sincere kindness in helping and gave me useful information especially in contributing and sharing ideas towards this project.
TABLE OF CONTENT
Abstract i
Abstark ii
Dedication iii
Acknowledgements iv
Tables of Contents v
2.1 Introduction of Quality 5
2.5 Productivity 16
2.6 Work study 17
2.7 Design of Experiment (DOE) 19
2.8 Quality cost 20
2.9 Customer satisfaction 22
2.10 Introduction on Polypropylene 22
2.11 Introduction to the Automatic Cutting and Sewing machine 23
3.0 Chapter 3 28
3.1 Planning of study 28
3.2 Process flow of Automatic Cutting and Sewing machine 32
3.3 Data collection 33
3.3.1 Primary resources 33
3.3.1.1 Industrial visit 33
3.3.1.2 Interview 33
3.3.2 Secondary resources 34
3.3.2.1 Books 34
3.3.2.2 Internet 34
3.4 Analysis techniques and methods 34
3.5 Gantt Chart 35
4.6 Sewing Rejects Factors 50
5.0 Chapter 5 53
5.1 Pareto Diagram 53
5.2 Cause and Effect Diagram 55
5.3 Definition Factors 56
5.3.1 Broken needle 56
5.3.2 Dimension specification 56
5.3.3 Jumping Sewing 57
5.3.4 String Problem 57
5.4 Data Collection 58
6.0 Chapter 6 60
6.1 Recommendation on the corrective action for rejects sewing 60 6.2 Recommendation to check the up the Folding guider 61
6.3 Conclusion 61
REFERENCES 62
APENDICES A: Machine sewing
A1 Machine sewing figure and component
APENDICES B: Description
LIST OF TABLES
2.1 The Seven Tools of Quality 10
2.2 The summarizedarchival collection related to the project 24
4.1 Automatic Cutting and Sewing machine characteristic 37
4.2 Reject Classification 41
4.3 Total rejects for Morning shift Machine 1 43
4.4 Total rejects for Evening Shift Machine 1 43
4.5 Total rejects for Morning Shift Machine 2 44
4.6 Total rejects for Evening Shift Machine 2 44
4.7 Cumulative total reject and percentage of reject Machine 1 45
4.8 Cumulative total reject and percentage of reject Machine 2 45
4.9 Cumulative total reject from August to December for Machine 1 46
4.10 Cumulative total reject from August to December for Machine 2 47
4.11 Cumulative total reject sewing from August to December 48
4 .12 Reject because factors for sewing reject due to Machine 51
4.13 Cumulative total reject sewing from August to February 52
5.1 Cumulative percentage sewing rejects August to December 54
5.2 Quantity sewing rejects August to February and the output 58
LIST OF FIGURES
2.1 PDSA cycle 7
2.2 "Statistical Process Control" Gold Practice 9
2.3 Cause and effect diagrams 9
2.4 Histogram diagram 10
2.5 Quality trilogy diagram 12
2.6 Quality control procedure and stage of evolution 13 2.7 Productivity Conceptual, 'productivity tree' 16
2.8 Flow chart of work study 18
2.9 DOE application phase 20
2.10 PAF model 21
2.11 Polypropylene structure 22
2.12 Automatic Cutting and Sewing machine 23
3.1 Flow chart Methodology 31
4.6 Pareto diagram show total reject type Machine 1 46 4.7 Pareto diagram show total reject Machine 2 47 4.8 Histogram show differentiate between Sewing reject and
4.9 Sewing machine model is DN-2HS 50 4.10 Histogram show differentiate between Sewing reject and
Mean sewing reject August to February 52
5.1 Show the sewing process 53
5.2 Pareto diagram show reject sewing September to December 54 5.3 Cause-and-effect diagram for sewing reject 55
5.4 Needle 56
5.5 Dimension specification 4mm 56
5.6 Sample of Jumping sewing 57
5.7 Left figure show blunt Looper and
right figure show standard Looper 57
5.8 Histogram show after improvement 58
LIST OF ABBREVIATIONS
ACAS - Automatic Cutting and Sewing machine DOE - Design of Experiments
HDPE - high-density plastic films
ISO - International Standard Organization
OA - Orthogonal arrays
PCS - Pieces
PDSA - Plan, Do, Study and Act
PP - Polypropylene
PVC - Polyvinylchloride
QC - Quality Control
QFD - Quality Function Deployment SPC - Statistical Process Control
UTeM - Universiti Teknikal Malaysia Melaka
% - Percentage
CHAPTER 1
INTRODUCTION
This chapter provides the introduction of the project that includes problem statement, objectives, scope and the importance of the project.
1.1 Introduction
Today quality has become the most importance competitive strategic tools to develop products and services in maintaining success. Quality also should be designed and applied to give a clearly view on how it’s work, the procedure, its method, advantages and disadvantages. The understanding of quality and involvement employee on quality totally can improve target. Quality has positive relationship with productivity, costs, cycle time and value.
As an organization, quality refers to the ability of a product or service to consistently exceed customer requirement. Directly, the improvement in quality result is an increase in productivity and also in term of cost such as the increasing in the quality conformance and decreasing in rework, scrap, customer complaints.
Nowadays, many manufacture industries build up even the economic not stable due to the increase of labor cost, employee satisfaction, political issues and unstable petrol price. Through this external factors each manufacture hard to think the best method to increase the quality of their product with limited cost spends. As what happened to the Polypropylene industry that still the minor industry even the profit given are more than 16 billion to Malaysia.
Since Malaysia now as a steady supply of feedstock of material for plastic industry like Polypropylene (PP), Polyvinylchloride (PVC), high-density (HDPE) plastic films and others. This factor help led the plastic products industry to become on of the most strategic industries in Malaysia manufacturing sector. Therefore, overall performance of the plastics industry need to be improve, especially in quality of product due to help Malaysia economic.
1.2 Problem Statement
1.3 Objective of this Project
The objectives of this project of Quality Improvement of Automatic Cutting and Sewing machine in Polypropylene Manufacturing Industry are:
a. To analyze the problem in Cutting department.
b. To improve the productivity of Automatic Cutting and Sewing machine.
1.4 Scope of this Project
In this project, the highest number of waste in the Cutting department of Assess Products Sdn Bhd will be analyzing. A projects more on the Automatic Cutting and Sewing machine due to increase the productivity. This project focuses the output on 2008/2009 to find remark factors with highest reject of Automatic Cutting and Sewing machine.
1.5 Project Outline
Based on the project for Projek Sarjana Muda (PSM I and PSM II), the project has been constructed for the process flow of completion in order to fulfill course of Degree in UTeM. Below shows the format of the project:
Chapter 1, formally present the chapter of the introduction of the project, objective of the project, problem statement, scope of project and the project outline for the project.
Chapter 3 actually, this chapter represents the flow chart related to the whole process of the methodology.
Chapter 4 for the results, the collected data from Case Study Company was analyzed especially at Automatic Cutting and Sewing machine performance of output. Present the data collected will be analysis using the quality tools, based on the Design of Experiments (DOE) planned.
Chapter 5, this chapter discusses the data analysis based on the data that analyzed in chapter 4. The Pareto diagram and cause-and-effect diagram is used to determine the major causes for the defected.
Chapter 6, present the conclusions of the whole project and give suggestions for the future work.
CHAPTER 2
LITERATURES REVIEW
This chapter is briefly explained about what is Quality Improvement of Automatic Cutting and Sewing machine in Polypropylene manufacturing industry.
2.1 Introduction of Quality
One of the most important issues that Manufacturing has focused on in the last 20-30 is quality. As markets become more competitive so quality has become widely regarded as a key ingredient for success in business. “Quality refers to the ability of a product or service to consistency meet or exceeds customer requirement or expectations. Besides, different customer will have the different requirement, so a working definition of quality is customer-dependent” (Stevenson, 2007, p.397). In other words, Quality can be interpreted as "Customer's expressed and implied requirements are met fully". Furthermore, Crosby claims that “perfect quality is both technically possible and economically desirable has rekindled many of the old arguments about how much quality is enough” (A. Garvin, 1988, p 18).
For customer’s definition, quality means how well the products or service can perform well to meet their expectations. In other situation the quality can be defined as five points of view:
b. Process Based – Quality depends on the conformance to process methods and it relies on stabile. Measurable using Statistical Process Control (SPC) help to improve the quality on Process based and most of Process based on outcome oriented.
c. User Based – Quality definition in User based is “Fitness for Use/ suitable to the customer”. Quality is in the eyes of the beholder with highly subjective and should be satisfaction for the user in high Quality.
d. Value Based - “Affordable Excellence” and it also defined in terms of cost and benefit.
e. Transcendent- “Know It When You See It” and other definition of quality with transcendent is synonymous with Innate Excellence. Timeless also give the definition of quality.
2.2 History of Quality Gurus
A guru, by definition, is a good person, a wise person and a teacher. A quality guru should have a concept and approach to quality within business that has made a major and lasting impact.
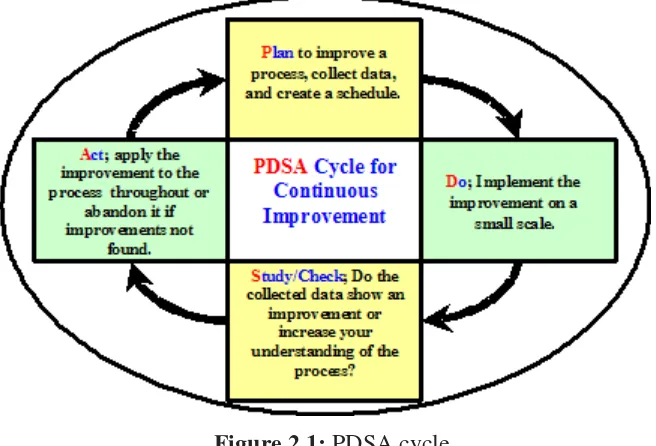
2.2.1 Walter A. Shewhart
to as the PDSA cycle). Furthermore, Dr.Shewhart developed control chart theory with limit, assignable and chance causes of variation, and rational subgroups.
Figure 2.1: PDSA cycle
2.2.2 Dr. W. Edwards Deming
Dr. W. Edwards Deming is known as the father of the Japanese post-war industrial revival and was regarded by many as the leading quality guru in the United States. Dr. W. Edwards Deming placed great importance and responsibility on management, at the individual and company level, believing management to be responsible for 94% of quality problems. His fourteen point plan is a complete philosophy of management that can be applied to small or large organizations in the public, private or service sectors:
a. Create constancy of purpose towards improvement of product and service b. Adopt the new philosophy. We can no longer live with commonly accepted
levels of delay, mistakes and defective workmanship
c. Cease dependence on mass inspection. Instead, require statistical evidence that quality is built in.
e. Find problems. It is management’s job to work continually on the system f. Institute modern methods of training on the job
g. Institute modern methods of supervision of production workers, The responsibility of foremen must be changed from numbers to quality h. Drive out fear, so that everyone may work effectively for the company i. Break down barriers between departments
j. Eliminate numerical goals, posters and slogans for the workforce asking for new levels of productivity without providing methods
k. Eliminate work standards that prescribe numerical quotas
l. Remove barriers that stand between the hourly worker and their right to pride of workmanship
m. Institute a vigorous programmed of education and retraining
n. Create a structure in top management that will push on the above points every day.
Furthermore, the key elements of Deming’s 14 points are constancy of purpose, continual improvement and profound knowledge. Profound knowledge involves an appreciation of a system, a theory of a variation, a theory of knowledge and psychology. Deming’s concept of profound knowledge incorporates the beliefs and value about learning that guided Japan’s rise to a world economic power. Besides, Dr. W. Edwards Deming believed that management’s greatest challenge in achieving quality was in motivating workers to contribute their efforts to achieve the goals.
2.2.3 Kaoru Ishikawa
ever increasing goals and cultural requirements. Kaoru Ishikawa is emphasis on communication through simplicity of analysis, method and commonality of language.
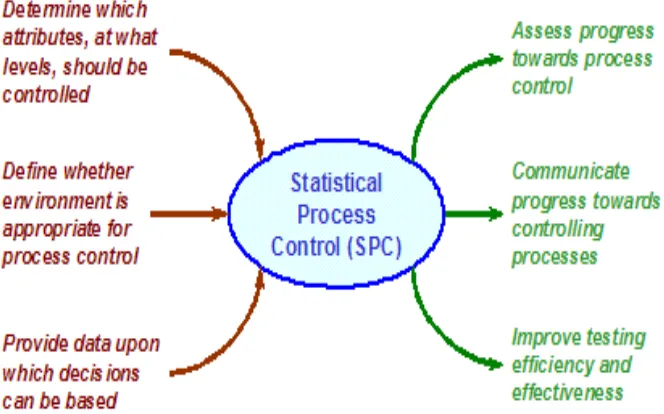
Kaoru Ishikawa introduce the Seven tools of quality control its taken together they are a set of pictures of quality, representing in diagrammatic, or chart form, the quality status of the operation or process being reviewed.
Figure2.2: "Statistical Process Control" Gold Practice
Graph show total waste from January untill July
Figure 2.4: Histogram diagram
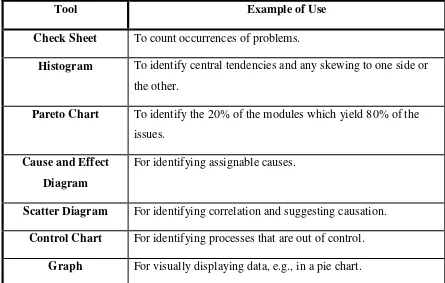
Table 2.1: The Seven Tools of Quality
Tool Example of Use
Check Sheet To count occurrences of problems.
Histogram To identify central tendencies and any skewing to one side or the other.
Pareto Chart To identify the 20% of the modules which yield 80% of the issues.
Cause and Effect Diagram
For identifying assignable causes.
Scatter Diagram For identifying correlation and suggesting causation.
Control Chart For identifying processes that are out of control.