Hari Penyelidikan Fakulti Kejuruteraan Mekanikal, Universiti Teknikal Malaysia Melaka, 22 Julai 2011
40
On a Simple Technique to Measure the Airborne Noise
in a Motor Vehicle using Source Substitution
C. D. Juis1, A. Putra2
Abstract–From various methods of measuring noise of a motor vehicle, there is a lack application on how to obtain the ‘pure’ airborne noise in a vehicle cabin as an important measure to improve the noise control treatment. This project proposes a technique in separating airborne and structure-borne noise in a motor vehicle using sound source substitution method. A cone loudspeaker was used as the substitution source and the overall transmission loss was measured to achieve this purpose. It is found that the structure-borne noise is dominant at low frequencies and airborne noise dominates at high frequency. The intersection frequency between the two is roughly 400 Hz.
Keywords: Airborne Noise, Structure-borne Noise, Transmission Loss, Source Substitution
I. Introduction
The noise in the passenger compartment of a car has been an issue lately in the automotive engineering. A good quality car is the one that produce low noise and vibration. Noise, vibration and harshness (NVH) of a car becomes an important parameter judged by the customer [1]. Therefore for a car manufacturer, accurate measurement of noise and vibration is necessary.
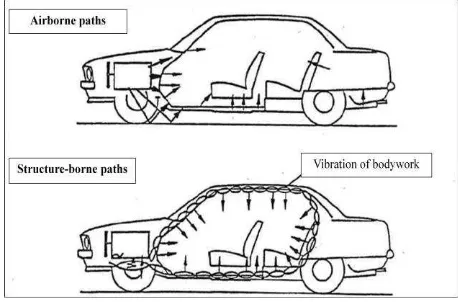
According to its transmission path, noise can be classified into two categories, i.e. structure
borne and airborne noise. The word “borne”
means to bear or to carry. Therefore structure-borne is the vibration carried by the structure, where it is then transferred as sound energy which is produced inside a car. Meanwhile, the airborne noise is propagation of noise directly through the air [2].
For noise in the vehicle cabin especially, engineers need to separate between airborne and structure-borne noise as a measure of how well the noise control treatment applied. Airborne noise is transmitted directly into the cabin through gaps and leakage in the car. Meanwhile, for the structure-borne noise, the noise is usually generated by the vibrating car engine, exhaust and other parts. In other words, the noise is generated by vibration at the mounting point. The vibration waves propagate
through the vehicle structure of the cabin and then radiate the noise. See Fig. 1.
The noise via the structure-borne route is the coupling between the structural resonance and cabin acoustic modes and hence is typically modal dominating at low frequencies below 500 Hz. As the frequency increases, the interior noise is well dominated via the airborne route particularly due to tyre and wind noise [3]. Therefore, airborne noise corresponds to the sealing for any leakages and the structure-borne corresponds to the applied damping or isolator of the car structures.
Fig. 1: Transmission paths of airborne and structure-borne noise.
Hari Penyelidikan Fakulti Kejuruteraan Mekanikal, Universiti Teknikal Malaysia Melaka, 22 Jun 2011
41 is required to well separate these two types of
propagating noise.
Techniques to assess the motor vehicle interior noise are progressively developing. In
1980‟s, Fahy introduces the sound intensity technique where the sound intensity at any particular radiating surface can be obtained [4]. This requires a scanning process for several surfaces to yield the sound intensity distribution inside the vehicle interior. The signal processing method can also be applied to ranking the sources of noise in the cabin. Several accelerometer and microphones are required to obtain the raw data [5, 6]. The suspected noise sources are ranked by their signal coherencies. The most recent techniques are the implementation of array of microphones using Beam-forming method and Near-field acoustical holography [7, 8, 9]. These provide
the measure of „source strength‟ distribution
from the sources. As for sound intensity, this does not need the scanning process, but requires more than 20 acoustic microphones (and also amplifier and data acquisition system with multiple channels) to obtain a good data. The method becomes more attractive as this can be coupled with video image processing to give a live measurement for the noise source emitting unsteady-state radiation. A powerful algorithm for the signal processing is therefore needed.
This paper presents a simple technique to measure the pure airborne noise level in a car cabin. A cone loudspeaker is used as the source substitution to obtain the overall transmission loss. The methodology is briefly explained in the next section.
II. Methodology
II.1. Exterior noise
The experiments are basically divided into two parts, where first is to measure the exterior noise and second is to measure the interior noise. Each of it using either the engine of the car under test as the noise source or using the source substitution, which is a small 80 Watt cone loudspeaker.
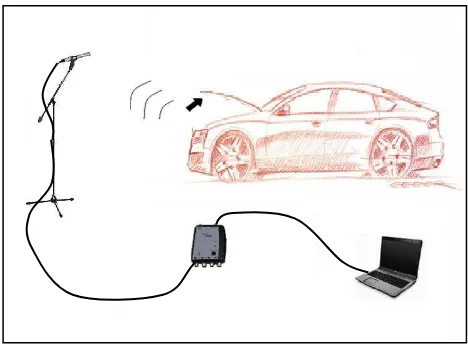
Fig. 2: Experimental setup for exterior noise
Fig. 2 shows the experiment setup to obtain the sound pressure level (SPL) of the exterior noise. The aim is to measure the „source
strength‟ from the car engine. For this purpose, the bonnet was opened. The microphone was located about 1 m from the engine. The engine was then turned on with idle condition. The
acoustic pressure was measured by the ½”
GRASS microphone. The signal was captured by the Pro-Photon+ analyzer and transferred into the computer for post processing. The same procedure was then repeated for engine with 2000 rpm, 3000 rpm and 4000 rpm.
When using the source substitution, the loudspeaker was located near the engine facing upwards as seen in Fig. 3 and the engine was turned off. The same procedure was used until the data was saved in the computer.
Hari Penyelidikan Fakulti Kejuruteraan Mekanikal, Universiti Teknikal Malaysia Melaka,
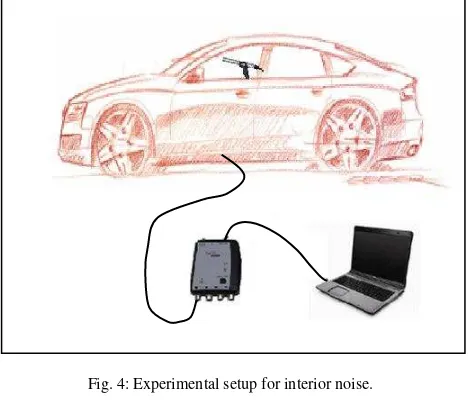
Fig. 4: Experimental setup for interior noise.
Fig. 5: Position of the microphone to measure interior SPL.
III. Data processing
The formula to obtain the sound pressure level during the experiment is given by
pressure, i.e. 2x10⁻⁵ Pa.For a propagating plane wave, the sound pressure W is given by transmission loss is the difference between sound power level (10log10W) of the incident sound and the transmitted sound, therefore according to Eqs. (1) and (2), the transmission
SPL is the sound pressure level
at the car interior. Both are those measured using the source substitution.
This transmission loss shows the „transfer function‟ of the barrier (wall structure of the car) between the engine as the noise source and the car cabin as the room receiver. As the transfer function is independent of the strength of the noise source, therefore by using the measured source strength, i.e. the exterior SPL when engine is on, the sound pressure level
inside the cabin due to „only‟ the airborne noise can be obtained. This is expressed as
Hari Penyelidikan Fakulti Kejuruteraan Mekanikal, Universiti Teknikal Malaysia Melaka, 22 Jun 2011
43 effectiveness of the car body starting at 500 Hz
to block the noise through the airborne. The control measure such as the trimming of the car wall or a double-panel installation of the bulkhead are affecting significantly for the attenuation above this frequency. However, below 500 Hz, the interior SPL is higher than that of the exterior due to contribution of the structure-borne noise. In these low frequencies, the interior noise dominates by the acoustic cavity modes indicated by the distinct sharp peaks. The results for idle mode, 3000 rpm and 4000 rpm show the same phenomenon.
Fig. 6: Measured SPL when the engine is running at 2000 rpm
Fig. 7 shows the SPL measured when the
loudspeaker is used as sound source
substitution. The SPL inside the cabin is lower compared with that from the exterior for the
whole frequency range. The difference
increases as the frequency increases.
Fig. 7: Measured SPL using the source substitution.
The phenomenon below 500 Hz as in Fig. 6 vanishes as only airborne noise was generated.
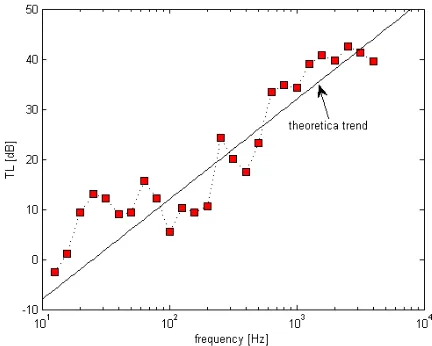
Fig. 8 shows the transmission loss calculated from SPL in Fig. 7 (Eq.(3)). It shows that the measured data follows the slope of the „mass
-law‟, i.e. 20 dB per decade.
Fig. 8: Measured sound transmission loss.
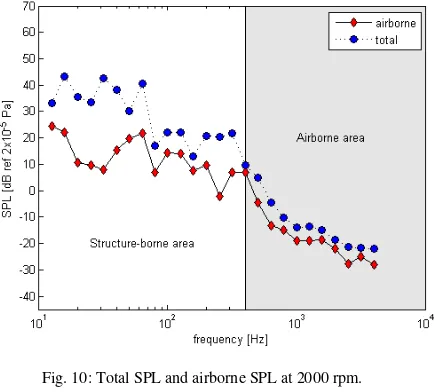
The results for the airborne noise in comparison with the total interior noise are shown in Fig. 9 -12.
From all the figures, the airborne noise and structure-borne noise start to converge roughly above 400 Hz. In Figure 9 for the idle condition however, the difference between the total and the airborne SPL is around 15 dB. This is because the airborne penetrates the cabin with less amount of energy compared with other
engine‟s rpm.
Hari Penyelidikan Fakulti Kejuruteraan Mekanikal, Universiti Teknikal Malaysia Melaka, 22 Jun 2011
44
Fig. 10: Total SPL and airborne SPL at 2000 rpm.
Fig. 11: Total SPL and airborne SPL at 3000 rpm.
Fig. 12: Total SPL and airborne SPL at 4000 rpm.
From this phenomenon, it can be concluded that the total SPL above 400 Hz dominates by predominantly by the airborne noise, while the structure-borne noise can be seen to dominate
below 400 Hz where the total SPL is higher than that of the airborne noise of about 10 – 20 dB.
A sharp peak in the structure-borne frequency range shows the second order of the engine harmonic, 2E where E is the frequency of the running speed of the engine. For example a peak seen at 100 Hz when the engine is running at 3000 RPM (Figure 12) is due to the engine harmonic, 2(3000/60) = 100 Hz. The same peaks can be seen at 30 Hz, 65 Hz and 130 Hz in Fig. 9, 11 and 12, respectively for
other engine‟s rpm.
It is also interesting to note, that the SPL for
different engine‟s rpm are roughly the same at
the structure-borne area. The SPL increases as with the increasing of rpm only at the airborne area. This shows that the engine speed contributes significantly for the broadband of airborne noise inside the cabin. At low frequencies, the contribution is only due to the engine orders at distinct frequencies.
V. Conclusion
A method to measure the airborne noise in a motor vehicle has been proposed using source substitution method. The pure airborne sound pressure level inside the cabin can be obtained when the engine is running on several speeds. It is found that the intersection frequency between the structure-borne noise and the airborne noise is around 400 Hz. This transition frequency is also found to be independent of the speed of the engine.
In the experiment, a small cone loudspeaker having power of 80 Watts was used as the source substitution. However, for more accurate results to measure the airborne noise, it is better to use sound source producing larger sound energy particularly at high frequencies to penetrate the vehicle cabin optimally.
Acknowledgements
Hari Penyelidikan Fakulti Kejuruteraan Mekanikal, Universiti Teknikal Malaysia Melaka, 22 Jun 2011
45
References
[1] K. Genuit. The sound quality of vehicle interior noise: a challenge for NVH-engineers. Int. J. Vehicle Noise and Vibration, Vol. 1, 2004.
[2] M. Harrison. Vehicle Refinement: Controlling Noise & Vibration in Road Vehicle. 1st Ed. Burlington, MA.: Elsevier Butterworth-Heinemann, 2004.
[3] D. J. Thompson and J. Dixon. Vehicle noise. Chapter 6 in Advanced in Acoustics, Noise and Vibration (Ed by F. Fahy and J. Walker), Spon Press, 2004.
[4] F. J. Fahy. Sound Intensity. 2nd Ed, E & FN Spon, 1995.
[5] W. G. Halvorsen and J.S. Bendat, Noise Source Identification using Coherent Output Power Spectra, Journal of Sound and Vibration, pp. 15–24, 1975.
[6] H. Fouladi, J. M. Nor and A. K. Arifin. Spectral analysis methods for vehicle interior vibro-acoustics identification, Mechanical Systems and Signal Processing, Vol. 23, pp. 489– 500, 2009. [7] M.G. Smith, K.B. F Kim and D.J. Thompson. Noise source
identification using microphone array, Proceeding of the Institute of Acoustic, Vol 29.Pt.5, 2007.
[8] P. A. Nelson. and S.H. Yoon. Estimation of acoustic source strength by inverse methods: Part I: Conditioning of the inverse problem. Journal of Soundand Vibration, 233, 643–668, 2000. [9] F. Jacobsen and V. Jaud. Statistically optimized near field acoustic
holography using an array of pressure-velocity probes. Journal of theAcoustical Society of America, 131(3), 1550-1558, 2007.
Azma Putra is a senior lecturer in Faculty of Mechanical Engineering, UTeM. He received his Ph.D in 2008 from Institute of Sound and Vibration Research (ISVR), University of Southampton, United Kingdom. His current interests are engineering acoustics and noise control, vibro-acoutics, vibration and structural dynamics.