Abstract—A mathematical model of the surface roughness has been developed by using response surface methodology (RSM) in grinding of AISI D2 cold work tool steels. Analysis of variance (ANOVA) was used to check the validity of the model. Low and high value for work speed and feed rate are decided from design of experiment. The influences of all machining parameters on surface roughness have been analyzed based on the developed mathematical model. The developed prediction equation shows that both the feed rate and work speed are the most important factor that influences the surface roughness. The surface roughness was found to be the lowers with the used of low feed rate and low work speed. Accuracy of the best model was proved with the testing data.
Keywords—Mathematical Modeling, Response surface methodology, Surface roughness, Cylindrical Grinding.
I. INTRODUCTION
RINDING process is widely used machining process in
industry for surface smoothing and finishing. Grinding process involves a material removal by the contact between a grinding wheel with a randomly structured topography with the workpiece. The quality of a machined surface is becoming more and more important in order to satisfy the increasing demands of sophisticated component performance, longevity, and reliability so that they can achieve their functions according to geometric, dimensional and surface considerations. An understanding of surface finish provides much advantage in avoiding failures; enhance component integrity and costs saving. Surface roughness is generally regarded as an important factor in terms of fatigue life performance. Grinding is most commonly used as a finishing process to achieve material removal and desired surface finish with acceptable surface integrity, dimensional tolerance and form tolerance [1]. Grinding practice is a large and diverse area of manufacturing and tool making. It can produce very fine surfaces and very accurate dimensions and also available for either hard or brittle materials. Previous study had stated that grinding conditions like depths of cut, work speed, wheel speed etc influence the surface roughness and hardening [2],[3].
M. A. Kamely, is with the Department of Manufacturing Process, Faculty of Manufacturing, Universiti Teknikal Malaysia Melaka, Hang Tuah Jaya, 76100 Durian Tunggal, Melaka, Malaysia (phone: 3316488; fax: +606-3316411; e-mail: kamely@ utem.edu.my).
S. M. Kamil, is with the Department of Manufacturing Process, Faculty of Manufacturing, Universiti Teknikal Malaysia Melaka, Hang Tuah Jaya, 76100 Durian Tunggal, Melaka (e-mail: [email protected]).
C.W. Chong. is with the Department of Manufacturing Process, Faculty of Manufacturing, Universiti Teknikal Malaysia Melaka, Hang Tuah jaya, 76100 Durian Tunggal, Melaka, Malaysia (e-mail: [email protected]).
The relationship between process parameters and surface characteristics are not completely known. Changing of grinding parameters result in different kind of surfaces. Surface is important in industrial for weapon building, production of precision dies and moulds, and silicon wafer manufacturing [4]. Industrial dislike rough surface finish product, life span for rough surface is much shorter than smooth surface. Furthermore, today industry requires precision machining. Hence, it is important for industries that the surface roughness can be determined according to the grinding parameters prior to the operation. The objectives of this study are to develop a model the effect of grinding parameters especially work speed and feed rate on the surface roughness. Therefore, surface roughness could be controlled to certain accuracy by adjusting the grinding parameters.
II.LITERATURE REVIEW
A.Grinding
Nowadays, grinding is a major manufacturing process which accounts for about 20-25% of the total expenditure on machining operations in industrialized countries [5]. In the grinding process, material is removed from the workpiece by a rotating abrasive wheel. The grinding process can be classified into three parts; which are surface, cylinder and centerless grinding. These processes are choose regarding with workpiece shape. Surface grinding is the common operation for grinding flat surface and is likely to produce high tolerances, low surface roughness and planar surfaces. In surface grinding, shallow depth of cut is achieved with fast feed rates and the depth of cut can range from 0.01 to 0.05mm while feed rate is approximately 3m/s [6]. Cylindrical grinding removes only metallic or non metallic cylindrical workpiece.
B.Surface Roughness
Surface roughness is a variable often used to describe the quality of ground surfaces as well as to evaluate the competitiveness of the overall grinding system. The quality of the grinding surface is important as it determines the workpiece characteristics such as the minimum tolerances, the lubrication effectiveness and the component life [7]. In addition, surface finish is an important factor in evaluating the quality of products. The arithmetic average height parameter (Ra), also known as the center line average (CLA), is mostly used as an index to determine the surface finish in the machining process. A good quality surface for most industrial application is with arithmetic mean roughness, Ra below 0.8µm. Despite the different surface finish parameters, the roughness average, Ra is the most used international parameter of surface roughness. It is defined as:
M.A. Kamely, S.M. Kamil, and C.W. Chong
Mathematical Modeling of Surface Roughness
in Surface Grinding Operation
G
International Journal of Engineering and Natural Sciences 5:3 2011
(1)
Surface roughness is the measure of the finer surface irregularities in the surface texture. It is quantified by the vertical deviations of a real surface from its ideal form. If these deviations are large, the surface is rough; if they are small, therefore, the surface is smooth [8]. In order to predict component behavior during use or to control the grinding process, it is necessary to quantify surface roughness, which is one of the most critical quality constraints for the selection of grinding factors in process planning. Prediction and identification of surface roughness has been the subject of many researches in the manufacturing field. From the literature, the modeling and prediction problems of surface roughness of a work-piece by mathematical modeling have received increasing attention.
C.Response Surface Methodology
The machining process is very complex, thus, experimental and analytical models that are developed by using conventional approaches such as the statistical regression technique which is combined with the response surface methodology (RSM) have remained as an alternative in the modeling of the machining process. RSM is practical, economical and relatively easy for use. The experimental data was utilized to build mathematical model for first- and second-order model by regression method [9]. Bradley [10] stated that if the response can be defined by a linear function of independent variables, then the approximating function is a first order model. A first order model with two independent variables can be expressed as:
(2) If there is a curvature in the response surface, then a higher degree polynomial should be used. The approximating function with two variables is called a second-order model and the equation is as:
(3)
III. EXPERIMENTALPROCEDURE
The test specimens were made from commercially available AISI D2 cold work tool steels with diameter 30 mm were grinded by using Sharp 820H cylindrical grinding machine with different parameter setting that is created by Design Expert® software. In the grinding conditions, the work piece revolution speeds were 130 rpm to 350 rpm. The feed rates were 1.0 to 3.0 in/min. The wheel speed (1800 rpm) was maintained and a coolant was applied directly to the cutting area. For this experiment, two passes grinding are done on each work piece with constant depth of cut 50 µm for every pass. Dressing is started each time before grinding to restore the sharpness of grinding wheel. Surface roughness measurements were made with a portable surface roughness
tester, SJ-301. The cut-off, value set is 0.8 mm. The results were entered into Design Expert® and the best model for construct graph and also mathematical model were determined.
A.Response Surface Methodology and Prediction of Surface
Roughness
Response surface methodology is popular where it can be usefully applied in many manufacturing situations. In response surface methodology, the factors that are considered as most important are used to build a polynomial model in which the independent variable is the experiment’s response. In this study, Response surface methodology was used as an alternative way to estimate the surface quality in grinding.
IV. EXPERIMENTALRESULT
Mathematical model for surface roughness has been developed to correlate the important grinding parameters in grinding of AISI D2 cold work tool steel. In order to quantitatively evaluate the effect of cutting parameters on surface roughness, the factorial design of the experiment integrated with the regression technique was used in establishing the surface roughness models in relation to the primary machining decision variables which are work speed and feed rate. In general, the response function can be represented as follows:
In order to gain a better understanding of the results, the predicted models are presented in Fig. 1 as the 3-D response surface plots. This equation can be used to plot contour plot and three dimensional plots of response surface of the machining parameters A and B and its effect to the surface roughness values are shown in Fig. 2 and Fig. 3.
Fig. 1 Three dimensional plot of response surface for factor A and B
d value
International Journal of Engineering and Natural Sciences 5:3 2011
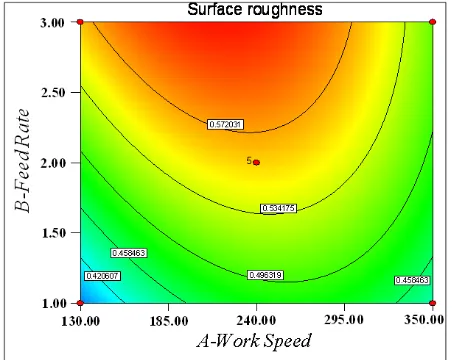
The contour plot is a two-dimensional representation of the response for selected factors. Significant increment of surface roughness (0.34 μm-0.43 μm) was obtained at the sector where the low feed rate (1-2 in/min) interacts with low work speed. Insignificant increment of surface roughness (0.50 μm – 0.56 μm) showed at the sector where the high feed rate (2in/min - 3in/min) interacts with assisting work speed. A minimum surface roughness 0.379 μm is obtained when feed rate and work speed are at lower level that is 1 in/min and 130 rpm respectively. In the other hand, a maximum surface roughness approximate to 0.570 μm is achieved when feed rate increase to 3 in/min but work speed is maintained at lower level 130 rpm. This shows that at constant work speed, increased of feed rate will increase the surface roughness. At high level of work speed, the surface roughness also shows an increment with the increase in feed rate. It can be concluded that the lower the feed rate the finer the surface will be. The surface roughness is depends on the feed rate no matter how the work speed is change.
Fig. 2 Contour plot for the machining parameters A and B and its effect to the surface roughness (μm) values
The perturbation plot as in Fig. 3 helps to compare the effect of all the factors at a particular point in the design space. The plot shows the surface roughness is sensitive to work speed (A) and feed rate (B) as there has no sign for flat line. This means that work speed and feed rate are influential factor to surface roughness. In order to achieve the optimum result of Ra, the feed rate and work speed range should be decreased to a lower of value. Good surface finish is obtained for a feed rate of 1 in/min and work speed of 130 rpm. On the other hand, at higher feed rate 3 in/min and work speed (> 240 rpm) it shows improvement in the surface roughness. This was also observed by Kiyak et al [11] who studied on the surface roughness in external cylindrical grinding stated that for wet grinding, low feed rate and work speed will improve surface roughness. This can be used as indicator to improve the value of Ra when selecting feed rate and work speed value for achieving optimum surface roughness.
The variation of surface roughness with respect to the work speed and feed rate can be observed graphically in Fig. 3. At constant low work speed, surface roughness increase as the
feed rate increase. At higher feed rate value 3 in/mm surface roughness increases to a maximum value of 0.55 when work speed increase from 130 rpm to 240 rpm. It also can be seen at constant feed rate surface roughness increase with the increase of work speed until it reach a maximum value of 240 rpm and start to improve as the work speed further increase to 350 rpm. The results show that the both feed rate and work speed has a significant effect on surface roughness.
Fig. 3 Perturbation plot for surface roughness
A.Model Validation
The analysis of variance (ANOVA) was used to check the adequacy of the first-order model. As per this technique, the F-ratio of the predictive model is calculated and compared with the standard tabulated value of the F-ratio for a specific level of confidence. If the calculated value of the F-ratio does not exceed the tabulated value. Then with the corresponding confidence probability, the model may be considered adequate. It was found that all of the first-order models are adequate with 95% confidence interval. As the model is adequate these 3D surface plots can be used for estimating the surface roughness values for any suitable combination of the input parameters namely the feed rate and work speed.
V. CONCLUSION
The effect of work speed and feed rate on the surface roughness have been studied and analyzed by using response surface methodology technique with Design Expert® software. The parameters such as feed rate and work speed were measured by means of experimental design. From the analysis, it was found that feed rate affect the most on the surface roughness. The surface roughness changes drastically with the increasing of feed rate regardless with the change of work speed. Feed rate and work speed are very crucial factors that need to be controlled and chosen carefully. An actual modeling approach using Response Surface Methodology for prediction of surface roughness in grinding has been developed. The developed models were evaluated for their prediction capability with measured values. The predicted values were found to be close to the measured values. The proposed models can be used effectively to predict the surface roughness in grinding process.
International Journal of Engineering and Natural Sciences 5:3 2011
ACKNOWLEDGEMENT
The financial support from The Ministry of Science, Technology and Innovation, Malaysia and Universiti Teknikal Malaysia Melaka through the PJP funding grant no: PJP/2009/FKP (10A) S578 is acknowledge with gratitude.
REFERENCES
[1] Z.W. Zhong, V.C. Venkatesh, Recent Developments in Grinding of Advanced Materials, International Journal of Advanced
Manufacturing and Technology, 41(2009) 468-480.
[2] K. Ramesh, H. Huang, L. Yin, Analytical and experimental investigation of coolant velocity in high speed grinding, International
Journal of Machine Tools and Manufacture,44 (2004) 1069–1076.
[3] Anne Venu Gopal, P. Venkateswara Rao, Selection of optimum conditions for maximum material removal rate with surface finish and damage as constraints in SiC grinding, International Journal of
Machine Tools & Manufacture, 43 (2003) 1327–1336.
[4] H.Y. Lai, C.K. Chen, Surface Fine Grinding via a Regenerative Grinding, Journal of Physics: Conference Series, 48 (2006) 1210-1221.
[5] S. Malkin, C. Guo, Theory and applications of machining with abrasives, 2nd ed. Published by Industrial Press, Inc. New York, 2008.
[6] A. Cameron, R. Bauer, A. Warkentin, An Investigation of the Effects of Wheel-Cleaning Parameters in Creep-Feed Grinding, International
Journal of Machine Tools and Manufacture,50 (2010) 126-130.
[7] R.L. Hecker, S.Y. Liang, Predictive Modeling of Surface Roughness in Grinding, International Journal of Machine Tools & Manufacture, 43 (2003) 755-761.
[8] Z.W. Zhong, V.C. Venkatesh, Recent Developments in Grinding of Advanced Materials, Journal of Springer Link, 8 (2008) 1496-1503. [9] Y. Sahin, A.R. Motorcu, Surface Roughness Model for Machining
Mild Steel with Coated Carbide Tool, Materials and Design, 26 (2005) 321-326.
[10] N. Bradley, The Response Surface Methodology, Master Thesis
Dissertation, Indiana University of South Bend, (2007).
[11] M. Kiyak, O. Cakir, E. Alton, A Study on Surface Roughness in External Cylindrical Grinding, 12th International Scientific Conference
Achievements in Mechanical & Materials Engineering, (2003).
International Journal of Engineering and Natural Sciences 5:3 2011