ii
ANALYSIS OF QUALITY COST RATIO AND QUALITY LOST RATIO
AT PT. NESTLÉ INDONESIA-PANJANG FACTORY
Muhammad Mustain1, M Aman Wirakartakusumah1, Nana Sudiana2 1Department of Food Science and Technology, Faculty of Agricultural Engineering and Technology, Bogor Agricultural University, IPB Dramaga Campus, PO BOX 220,Bogor 16002
2PT. Nestlé Indonesia, Jl. Let.Jen. TB Simatupang Kav. 88 Jakarta 12520, Indonesia, PO BOX 5555, Jakarta 12000
ABSTRACT
Analysis of cost related to quality is one way that companies are often used to generate an optimal production, right quantity, and right quality with efficient cost. In PT. Nestlé Indonesia, there are two types of cost related to quality i.e. quality cost and quality lost. Quality cost is the cost that is spent to ensure that products comply with standard. While quality lost is the cost that has been spent due to the products or processes that do not comply with standard. The method that is used to analyze the situation of cost related to quality in PT. Nestlé Indonesia is a ratio analysis. The advantage is not affected by external factors such as increases in price and cost analysis. The analysis of cost related to quality by PT. Nestlé Indonesia aims to determine the priority action that should be done to reduce the cost related to quality. Priority actions will be more effective if it focused only on costs that have a big impact to the cost related to quality. Cost components that have big impact to the quality cost are the number of microbial monitoring analysis for finished product, raw material, environment, and investigation. For the quality lost category, cost components that have big impact are the number of delayed released finished product, raw material, and packaging material. The priority action that will be done should be based on field conditions and type of causes that affect these cost components.
iii Muhammad Mustain. F24080120. Analysis of Quality Cost Ratio and Quality Lost Ratio at PT. Nestlé Indonesia-Panjang Factory.
Supervised by: Moehammad Aman Wirakartakusumah and Nana Sudiana. 2012
SUMMARY
Nestlé as one of the largest food companies in the world has implemented various systems to ensure the quality of the product. Zero waste is one of Nestlé’s commitments to give the best for their workers, environments, and consumers. There are several steps that must be done in order to achieve zero waste condition. The earliest stage is by analyzing the situation of cost related to quality at each factory. This will allow management to determine which sectors should get more attention in order to make the priority action more effective.
This study is divided into four stages. The first stage is the data collection about cost component used for ratio calculation of cost related to quality. The collected data are converted into ratio. The purpose of making ratio is these that data are in the same unit so it will be easier to be compared. After that, these ratios are analyzed with Pareto diagram to determine components which become priority concern. Then the cost components considered as priority concern will be analyzed later to find the priority action that should be done to reduce the cost related to quality.
Based on analysis performed, there are a lot of cost components that contribute to the cost related to quality. These are divided into two categories, namely quality cost and quality lost. After the data is converted into the ratio and analyzed with Pareto diagram, the cost components that have make the biggest contribution to the quality cost are monitoring analysis for finished product, raw material, environment, and investigation. For the quality lost category, cost components that have the biggest contribution are delayed released finished product, raw material, and packaging material.
Efficiency in quality cost does not always mean that all component of cost that related to quality must be reduced. Sometimes the amount of certain component should be maintained or even added to reduce or prevent the other component. Based on the existing conditions and its data, priority actions will be more effective if focused on the delayed release of finished product.
1
I.
INTRODUCTION
A.
BACKGROUND
The development of food industry is very fast and produces variety kind of food product. The increase of population, economic growth, and a change in the public life, encourage producer to be more innovative and creative in giving the best product quality. For that, food industry develops into a complex industry with a lot of activity which aims to ensure the quality of the product that is produced.
There are numerous activities related to quality, all of which utilize resources that determine the level of quality related cost incurred by a firm. Inspecting or testing parts, for example, is an appraisal activity that has the objective of detecting bad products. Detecting bad products and correcting them before they are sent to customers is usually less expensive than letting them be acquired by customers (Guan 2006).
The more complex the industry, the greater the chance of having errors. Order re-entry, data retyping, reprocess, and consumer complaint are just a few examples of the wastage or failure costs often spent by company. Every organization must be aware of the costs as the consequences for conducting wrong product and management needs to obtain some idea of how much failure is costing each year (Oakland 1993).
Nestlé is the world's leading food manufacturer that supplies more than 10 million of food products to the market each year. "Good Food, Good Life" is a slogan that describes Nestlé's commitment as a food industry that cares about the health of human beings to produce healthy food, safe, quality, nutritious, and fun to be consumed in order to realize a better life.
In 1979, PT. Nestlé Beverages Indonesia (formerly PT Indofood Jaya Raya) which has a factory in Panjang, Lampung, began producing instant coffee "NESCAFÉ". Besides pure coffee, PT Nestlé Beverages Indonesia also produces coffee mixes in a variety of scents. In 1997 NESCAFÉ began to enter the Russian market with packaging jar and two years later the production of instant coffee in cans stopped. In the year 2001 some of the filling and repacking processes for 3in1 products submitted to the co-manufacturer.
Nestlé as a company that implement quality improvement programs need to know how much cost has been spent for quality and how they are changing over time. Reporting and measuring quality performance is absolutely essential to the success of ongoing quality improvement program. A fundamental prerequisite for this reporting is measuring the cost of quality. But to measure those costs, an operational definition of quality is needed.
B.
OBJECTIVE
2
II. CORPORATE OVERVIEW
A.
HISTORY OF NESTLÉ INDONESIA
Nestlé is the world’s leading food company which supply more than 10 million of food products on the market every year. Nestlé with the motto “Good Food, Good Life”, describes Nestlé’s commitments as food producer which care about the health of consumers by generating a healthy food, good quality, safe, nutritious, scrumptious to be consumed to realize a better life.
Nestlé was established in 1866, when the first European condensed milk factory was opened in Cham, Switzerland, by the Anglo-Swiss Condensed Milk Company (Anonim5 2012). In 1867, in Vevey, Switzerland, Henry Nestlé launched Farine lactée, a combination of cow’s milk, wheat flour and sugar, saving the life of a neighbour’s child. Nutrition has been the cornerstone of our company ever since. Henry Nestlé was a nutritionist from Germany. The things influence him was the babies who died before getting one year old. This was because their mothers could not breast-feed their baby by their selves. Moreover, when Henry Nestlé’s friend met him to save a premature baby, then Henry Nestlé took the baby to his home and gave the food which contains a blend of bread, milk and sugar. The baby’s condition became better day by day. This discovery gave good news and spread widely.
“Farine lactée”, was the first Nestlé product, became weaning food and also food nutrition enhancer which successfully decreased infant mortality. Since that time, Nestlé became a food producer which won the trust from the community. Henry Nestlé used his family name ‘Nestlé’, which in the language of Germany Switzerland means little nest, became his company’s logo. The logo became a symbol of a sense of security, affection, solidarity and caring.
Through the symbol of two birds in the nest with their parents who gave feed to their chicks, the image of Nestlé was directly know as a company that produced food with full of nutrients. This symbol was converted in 1868 and directly applied in various advertising materials and publications. Until now, the logo is still used in modern shades according to the growing decade.
“TJAP NONA”, entered into the market in 1910 through existing distributor of Indonesia in Singapore (Anonim6 2012). In 1965, after Indonesia became an independent country, the government opened up opportunities for investment for foreign investors. On March 29th 1971, Nestlé S.A. centered in Vevey, Switzerland, together with their local partners, established PT. Food Specialties Indonesia. The first factory was established in Waru, East Java. This factory was established in 1972 and operated in 1973 which produced “TJAP NONA”.
PT. Food Specialties set up a new factory at Kejayan in 1984. This was because in early 1980, the production of fresh milk has increased dramatically, and this condition was the one of the success of PT. Food Specialties Indonesia in developing dairy farmers. This factory began operating commercially in 1988 and was inaugurated by the President of the RI, Soeharto, in June 1988.
3 In 1988, the centre of Nestlé acquired Rowntree Macintosh from United Kingdom that opened up opportunities to expand its business on confectionary. PT. Food Specialties Indonesia factory, which was a subsidiary of Nestlé, acquired PT. Multi Rasa Agung, which had a factory in Cikupa, Tangerang, and produced candies with a trademark “FOXS”. In 1990, a new factory in Cikupa, Tangerang was established. In 1992, in order to expand its business, PT. Multi Rasa Agung expanded its factory and produced candies with a trademark “POLO”. In 1996, PT. Multi Rasa Agung changed its name to PT. Nestlé Confectionery Indonesia and produced “Nestea Powder” in 1997.
In addition to had factories in Waru, Kejayan, Cikupa, and Panjang, PT. Nestlé Indonesia also had a factory in Telaga which produced instant noodles. Since 1999, the management of PT. Nestlé Indonesia and its factories were continually merged. In December 1999, PT. Nestlé Indonesia and PT. Nestlé Asean Indonesia were changed into PT. Nestlé Indonesia. Second, at the end of the year 2000, PT Nestlé Confectionery Indonesia joined PT. Supmi Sakti, then changed into PT. Nestlé Indonesia and Telaga factory was closed. Third, at the end of 2001, PT. Nestlé Beverages Indonesia and PT. Nestlé Distribution Indonesia joined with PT. Nestlé Indonesia. In June 2002, Waru factory was liquidated and merged with Kejayan factory.
4 Table 1. A brief history of PT. Nestlé Indonesia
Development
19th Century MILKMAID, a product of Nestlé, was known as “TJAP NONA” March 29th 1971 PT. Food Specialties Indonesia was established
1972 Waru factory, East Java, was established
1973 Waru factory was operated and produced milk products
April 12th 1978 PT. Indofood Jaya Raya was established, and then changed its name into PT. Nestlé Beverages Indonesia
1979 Panjang factory, Lampung was established which produced instant
coffee products
1981 The sterile fresh milk was produced with the brand “BEAR BRAND”
1988 Kejayan factory, East Java, was established which produced milk
powder
1990 Cikupa factory, Tangerang, was established which produced
confectionery products
1993 PT. Food Specialties changed its name into PT. Nestlé Indonesia
1995 The acquirement of PT. Supmi Sakti which produced instant noodles
with Telaga factory
1998 PT. Sumber Pangan Segar and PT. Rola Perdana were appointed as
main distributor of PT. Nestlé Indonesia. Then, both of the company were merged and changed their name into PT. Nestlé Distribution Indonesia
2000 The joints of PT. Nestlé Indonesia, PT. Nestlé Confectionery Indonesia, and PT. Supmi Sakti became PT. Nestlé Indonesia
2001 The joints of PT. Nestlé Indonesia, PT. Nestlé Beverages Indonesia and PT. Nestlé Distribution Indonesia became PT. Nestlé Indonesia
2002 Waru factory was integrated with Kejayan factory
2005 The joint venture establishment with PT. Indofood Sukses Makmur,
TBK, which was named as PT. Nestlé Indofood Citarasa Indonesia
2.2 Location of PT. Nestlé Indonesia
PT. Nestlé Indonesia was centered at Wisma Nestlé, Arkadia Office Park, Tower B, 5th floor, Jl. TB Simatupang Kav.88, Jakarta 12520, Indonesia (Anonim7 2012).
Now, PT. Nestlé Indonesia has three factories for production: 1. Kejayan Factory, was established on 2nd June 1988
Location : Raya Pasuruan – Malang Street KM. 9.5
5 “MILO” ready to drink beverage, “NESCAFE Coffee Cream” ready to drink beverage, and “CERELAC” infant cereals
2. Panjang Factory, was established in 1979
Location : Serampok Village, Panjang District, Bandar Lampung
Product : NESCAFE Originale 3 in 1, NESCAFE Crème 3in1, NESCAFE Ice, NESCAFE Classic, NESCAFE Mochaccino, NESCAFE Coffeemix pas!, NESCAFE Kopi Susu Tubruk, NESCAFE Kopi Susu Mocha
3. Cikupa Factory, was established on October 1990
Location : Bitung Jaya Village, Cikupa-Tangerang, West Java
Product : “POLO” candy, “FOX’s” candy, “NESTEA” instant tea powdered drink, “MILO Choco Blast” snack
B.
PRODUCTION
1.
Raw Materials
PT. Nestlé Indonesia-Panjang Factory use materials such as coffee, sugar, cream and premix to produce instant coffee either pure coffee and coffee mixes.
a. Coffee
The main raw material to produce instant coffee is green coffee. The green coffee used is Robusta coffee bean. Robusta coffee beans usually have high levels of caffeine and acidic. The green coffee is obtained from suppliers and farmers that were trained first by PT. Nestlé Indonesia-Panjang Factory. In order to obtain the best quality of coffee product, the quality of green coffee was checked first by Quality Assurance Department.
The Agriservice role is to ensure the green coffee was obtained from farmer that fulfilled the standards for the production process. For that, Nestlé provide trainings to farmers about good processing methods. This training is aim to increase the ability of farmers so that they can produce green coffee with high quality.
There are levels or grades of green coffee (GC) based on the level of disability or defect:
1. GC WA (Washed) Class 1.0 2. GC WA Class 1.1
3. GC WA Class 1.2 4. GC WA Class 1.3
5. GC UWA (Unwashed) Class 4.1 6. GC UWA Class 4.2
7. GC UWA Class 4.3
8. GC ROB (Robusta) Class 7.1 9. GC ROB Class 7.2
10. GC ROB Class 7.3 b. Sugar
6 c. Creamer
Creamer is a slight fraction from milk that was separated by a milk separator. Creamer is obtained from the company that produce creamer. Like sugar, creamer also must have a certificate of quality.
d. Premix
Premix is a mixture of flavor, milk, and other additives such as salt, sugar, and flavor enhancer. Premix can be added with different formulas according to the coffee mixes that will be produced.
2. Production Process
Panjang Factory produces two kinds of instant coffee that are pure coffee and coffee mixes. Basically, the processing of coffee from raw materials into an instant coffee includes 5 steps, namely roasting, milling, extraction, evaporation, and spray drying. a. Roasting
The concept of roasting is flow the air with high temperatures on the outer surface of rotary drum. The green coffee that will be roasted is inside the rotary drum. When the desired color is achieved, roasted coffee is rapidly cooled using water to stop the roasting process.
The functions of roasting are: 1. The flavor formation.
2. The color and texture formation. 3. Extractability
b. Grinding
Grinding is the process of reducing the particle size to a smaller size. There are four ways of grinding materials i,e, cutting, impact, compression, and attrition. c. Extraction
The definition of the extraction is a process of transferring dissolved solids in the form of liquid solution. This stage aims to take a soluble solid and flavor component.
d. Evaporation
Coffee solution is heated with a heating medium to remove most of the water content. Evaporation process aims to evaporate the solvent of coffee extract to obtain more viscous coffee extract and reduced water content.
e. Spray Drying
7 Coffee mixes is a coffee with additional sugar, cream, and other ingredients (salt, cocoa, flowing agent, etc). Production of coffee mixes through the following stages: a. Tipping
Tipping is a process of shedding the raw material to the silo that has been provided as a place to continue to the next stage.
b. Filtration
When sugar and creamer fall into a different shifter, these will be blocked by the filter to separate from foreign materials.
c. Grinding Sugar
Sugar from silo is milled by grinder to reduce the size. d. Weighing hopper
Raw materials will be weighed automatically according to formula that has been determined using a weighing hopper.
e. Mixing
8
III. LITERATURE REVIEW
A. COST
1.
Definition of Cost
Information about the systematic and comparative costs required to manage the company well. This information helps management to establish corporate earnings goals, evaluate the effectiveness of the plan, and reveal success or failure of the entire organization. In order to achieve this goal, systems must be designed to provide information on time. Furthermore, this information must be communicated effectively. For that, the needs for cost control become dominant.
Without cost information, management does not have information whether its business making a profit or not. This is very important because the profits necessary to develop or maintain the sustainability of the company. Without cost information, management also has no basis to allocate economic resources.
Based on this view Sunarto (2004: 2) reveal generally that: "Cost is the cost of goods or parts used or consumed to earn income". This definition has characteristics such as usage items, linkage with an output destination and assessment. The use of the more refined characteristics is needed to generate a more detailed terms of the cost.
According to Mulyadi (1993: 8), the cost is a sacrifice of economic resources measured in units of money that has occurred or may have occurred for a particular purpose. There are four main elements in the definition of costs, namely:
1. The cost is a sacrifice of economic resources. 2. Measured in units of money
3. Which has occurred or potentially will occur. 4. Sacrifice is for a particular purpose.
Witjaksono (2006: 6) states that: "Cost is a sacrifice of resources to achieve a particular goal."
Mursyidi (2008: 14) states that: "The cost is defined as a sacrifice to reduce the cash or other assets to accomplish goals, which can be charged at this time and in the future."
9
2.
Classification of Costs
According to Mulyadi (1993: 14) costs can be classified according to: a. Object of expenditure
In this classification, the name of expenditure object is the basis of cost classification, such as the object name is the fuel expenses, all expenses that associated with fuel called "fuel costs".
b. Principal functions of the company
In the manufacturing, costs can be categorized into three groups: 1. Cost of production
Production costs are costs incurred to process raw materials into finished products that ready for sale. According to the object of expenditure, cost of production is divided into the cost of raw materials, direct labor costs and factory overhead costs. Cost of raw materials and direct labor costs is called the main cost (primary cost). While the factory overhead costs called conversion cost , which is the cost to convert raw materials into finished products.
2. Marketing costs
Marketing costs are costs incurred in carrying out marketing activities for the product. An example is the cost of the promotion, the cost of transportation from corporate warehouse to customer warehouse, salaries of employees who carry out marketing activities, and the cost of sample.
3. General and administrative costs
General and administrative costs are cost to coordinate the activities of production and marketing of production. An example is the cost of employee salaries of finance, accounting, personnel and public relations (Mulyadi, 1993: 14).
c. Relationship of costs with something that be financed
In relationship with something that is financed, the cost can be grouped into two categories:
1. Direct costs (direct cost)
Direct costs are costs that occur, which cause the only thing is because of something that is financed. Direct production costs consist of costs of raw materials and direct labor cost. An example is the cost of labor work in the Maintenance Department and depreciation costs used in the engine department (Mulyadi, 1993: 15).
2. Indirect costs (indirect costs)
Indirect costs are costs incurred that not only is caused by something that is financed. Indirect costs in relation to the products referred to as indirect costs or factory overhead costs (Mulyadi, 1993: 15). Indirect cost is related to the particular cost object but cannot be trace to it in economically feasible (cost-effective) way. For example, the salaries of supervisors who oversee production of the many different soft drink products (Horngren 2005: 27)
d. Cost behavior in relation to changes in volume activity.
In relation to the change in volume of activity, the costs can be classified into: 1. Variable costs
10 2. Semi-variable costs
Semi-variable costs are costs that change is not proportional to the change in volume of activity.
3. Semi-fixed costs
Semi-fixed costs are fixed costs for certain activities and the level of volume change with a constant amount at a certain production volume.
4. Fixed costs
Fixed costs are costs that the total volume remains in the range of specific activities. For example is salary for production director (Mulyadi, 1993: 16).
e. Benefit period
On the basis of the benefit period, the cost can be divided into two general categories:
1. Capital expenditure
Capital expenditure is the cost of benefits that have more than one accounting period (usually the accounting period is one calendar year). These capital expenditures deducted as the cost of the asset and expensed in the years when enjoy the benefits by depreciation, amortized or depletion.
2. Revenue expenditure
Revenue expenditure is a cost that only has benefits in the accounting period of the expenditure. At the time of occurrence, revenue expenditure is charged as an expense and met with income earned from such expenditures (Mulyadi, 1993:17).
B. QUALITY
1.
Definition of Quality
In general, some experts define quality as follows: a. Philip B. Crosby
Crosby argues that quality means conformance to requirements (Suardi, 2003: 2).
b. W. Edwards Deming
Deming believes that quality means problem solving to achieve continuous improvement (Suardi, 2003: 3).
c. Joseph M. Juran
Juran believes that quality means conformance to usage (Suardi, 2003: 3) d. K. Ishikawa
Ishikawa believes that quality means customer satisfaction (Suardi, 2003: 3). e. Quality according to ISO 9000:2000
11
2.
Dimensions of Quality
According to Hansen and Mowen (2005: 5-6), a quality product or service is meeting or exceeding customer expectations in the following eight dimensions:
a. Performance: A good level of consistency and product functions. b. Aesthetics: Associated with the appearance of products and services.
c. Serviceability: Associated with the ease of caring for and improving the product. d. Features: Characteristics of the product which is functionally different from similar
products.
e. Reliability: The probability of the product or service to perform the intended function within a certain period
f. Durability: A useful life of the product function.
g. Quality of conformance: A measure of whether a product or service has met the specifications.
h. Fitness for use: compatibility of a product to perform these functions as advertised.
3.
Basic factors affecting the quality
According to Feigenbaum (1992: 54-55) basic factors affecting the quality consist of nine basic areas called 9M, as follows:
a. Market
In the present market have a wider scope and even more functionally specialized in the goods and services offered. With the growing number of companies, markets become international and even global. As a result, each company must compete with each other to improve the quality of products.
b. Money
To improve quality of the products, companies need a cost. Costs used to improve the quality of business referred to the cost of quality.
c. Management
Quality management is management that able to allocate the responsibility of every manager in their respective fields appropriately. It aims to correct deviations from specified quality standards.
d. Men
With the men who have expertise in their respective fields, the company will plan, create and operate the various systems that will ensure a desired result.
e. Motivation
Giving a good motivation for workers will make the workers work correctly in accordance with the desired company. It gives a good impact for the company to improve product quality.
f. Material
A quality product requires quality materials, therefore the supply of materials needed to be more stringent testing.
g. Machines and mechanization
12 h. Modern information methods
Information at the present time is very important. For example is information about customer response for the products. That information must be obtained by the company for a consideration of decision making. This requires modern information methods to obtain information quickly and accurately.
i. Mounting product requirements
The rapid advances in the complexity of engineering design have made things that previously were overlooked become potentially important. The increasing complexity and requirements of a product make the product becomes more secure and more qualified.
C. QUALITY RELATED COSTS
1.
Definition of quality related costs
According to Blocher et al. (2000: 220) quality related costs are costs associated with the prevention, identification, repair and rectification of poor quality products and the opportunity cost of lost production time and sales as a result of poor quality.
There are several definitions of quality costs were:
a. Quality costs are defined as costs that occur because of poor quality.
b. Quality costs are the costs incurred by the company because doing the work incorrectly.
c. Quality costs are the costs incurred because of the activities that are not directly required to support departmental objectives.
d. Quality costs are costs necessary to achieve a quality (Adnan, 2000: 119).
2.
Classification of quality related costs
Basically the quality related costs can be categorized into four types, namely: a. Prevention costs
Prevention costs are expenses incurred to prevent quality defects. The costs of prevention are comprised of:
1. Cost of quality training
Cost of quality training are the expenses for the internal and external training programs which include wages and salaries paid in the training, the cost of instruction, clerical staff costs and miscellaneous expenses.
2. Costs of quality planning
Costs of quality planning are wages and overhead for quality planning, quality circles, the design of new procedures, new equipment design to improve the quality, reliability, and supplier evaluation.
3. Costs of equipment maintenance
13 4. Costs of supplier warranty
Costs of supplier warranty are the cost incurred to develop requirements and measurement data, auditing, and reporting quality.
b. Costs assessment (Appraisal).
Costs assessment (detection) were spend in order to measure and analyze the data to determine whether the product or service accordance with specifications or not. These costs occur after production but before sale. The costs of this assessment consist of:
1. Costs of testing and inspection
Testing and inspection costs are costs incurred to test and inspect the material that comes, products in process and finished product or service.
2. Costs for testing equipment
Testing equipment is the expenditure incurred to acquire, operate or maintain the facilities, software, machinery, and testing equipment quality assessment of products, services or processes.
3. Costs for quality audit
Quality audit is the salaries and wages of all people involved in the assessment of the quality of products or services and other expenses incurred during quality assessment.
4. Costs for tests in laboratory
Tests in laboratory are the materials and equipment for testing, sample products tested, and salaries of employees involved in testing.
5. Costs of information
Cost of information is the cost to prepare and prove the report of quality. This cost is the cost for making a document of testing result and salary for workers who make the document.
c. Internal failure costs
Internal failure costs are costs incurred due to the low quality which discovered since preliminary assessment at the factory until delivery to the customer. Internal failure costs consist of:
1. Costs of corrective action
Costs of corrective action are the costs for the time that has been spent to find the cause of failure and to correct the problem.
2. Costs of rework
Costs of rework are materials, direct labor and overhead for the rest of the production, rework and re-inspection.
3. Costs of re-process
Costs of re-process are the costs to redesign product or process, unplanned machine stops, and the failure of any interruption of production due to process improvement and rework.
4. Costs of re-expedition
Costs of re-expedition are costs incurred to speed up the processing operation because of the time spent to repair or rework.
5. Costs of re-inspection and re-testing
14 d. External failure costs
External failure costs are costs incurred in order to rectify the defective quality of the product after delivery to the customer. In addition, included in external failure cost is the profit that failed to obtain because the product or service cannot be accepted by customers. The following examples are included in the external failure costs:
1. Costs for handling complaints and returns from customer
Costs for handling complaints and returns from customer are the salary and administrative overhead for the customer service department to improve the products which are returned, the reserves or deductions for low quality, and cost of transport.
2. Costs of the recall and product liability
Costs of the recall and product liability are administrative costs to handle product returns.
3. Lost sales because the product is unsatisfactory
Lost sales due to products that do not satisfy is the contribution margin that lost because of delayed orders, lost sales and declining market share (Blocher et al 2000: 220).
Quality related costs can also be classified as a cost that can be observed or hidden. The quality related cost can be observed (observable quality costs) are costs that are obtained from the company's accounting records, for example, the cost of quality planning, inspection costs of distribution and rework costs. Hidden costs are the opportunity cost that occurs due to poor product quality and usually opportunity cost are not presented in the accounting records, for example the cost of lost sales, customer dissatisfaction costs and the costs of losing market share (Hansen and Mowen, 2005: 9).
3.
Analysis of Quality Costs
After the quality related costs are identified and prepared in accordance with the classification categories, then the cost of quality can be analyzed to be used as the basis for determine priority actions. This analysis process consists of checking each elements and total cost. The process can also compare the operation of one period with the previous period. Benchmarking would be more meaningful if the cost of quality is compared with other activities within the company.
To determine precisely the areas that should receive the highest priority of quality effort is required a details about the overall of quality related cost (Feigenbaum, 1992: 112). Companies can also use the Pareto diagram to determine areas that should be priority concern to reduce quality related cost. Pareto diagram can help companies to determine the major problems with the least amount but has a big impact.
Meanwhile, according to Gaspersz (2005: 168) companies measure and analyze quality related costs as an indicator of the success of quality improvement program which can be related to other cost measures, namely:
a. Quality related cost compared to the value of sales. The lower of this value indicates the success of quality improvement programs.
15 c. Quality related cost compared to the cost of goods sold. This value measured by the percentage of the total quality costs to the value of sales, where the low value indicates the success of the quality improvement program.
4.
Optimal Distribution of Quality Costs
a. Traditional View
The traditional view assumes that there is a trade off between prevention cost and failure product cost. When the cost of control increases, the cost of product failure must decrease. During the failed product cost reduction is greater than the increase in prevention costs, companies must continue their efforts to prevent or detect defective products. In the end, will be reached a point where the increase in prevention cost greater than the decrease in failure product cost. This point illustrates the minimum level of total quality related cost and an optimal balance between prevention cost and failure product cost. This point is also called the acceptable quality level (AQL) (Hansen and Mowen, 2005: 14).
f. Contemporary views
In contemporary view used zero defect models. This model states that by reducing defects to zero, company will get a cost advantage. Companies that produce fewer defective products will be more competitive than companies that use the model of AQL. This model then was revised again with robust quality model. According to this model, the loss occurs because it manufactures 28 products which deviate from the target value and the farther deviation the greater loss. Besides, the loss is still possible even though the deviation was within the specification tolerance. In other words, the variation of ideal specifications is prejudice and tolerances do not offer any benefit. Model of a zero defect can reduce quality related costs thereby offering saving in both cost and quality of work overload (Mowen and Hansen, 2005: 14).
D. PARETO DIAGRAM
Pareto diagram is a graphical tool to gain insight into the most important causes of a problem. It is a bar chart in which the data are arranged in descending order of their importance; the diagram displays the relative contribution of each item to the total effect in decreasing order (Hubert 2001). Based on this, the most important problems can be distinguished from the less important ones and the greatest improvement can be realized with the least effort.
The Pareto principle, applied to quality work, suggests that the majority of quality losses are maldistributed in such a way that a “vital few” quality defects or problems always constitute a high percentage of the total quality losses (Kolarik 1999). The most important causes of a problem and priorities can be identified. It aids the decision-making process because it puts the most critical issue into understood frame work (Hubert 2001).
In detail, the function of Pareto diagram is as follows: 1. Shows the major problem
2. Declare the comparison of each issue to the overall
16 According to Muhandri 2005, the steps in making Pareto diagram are:
1. Stratification of the problem and state the number
2. Determine the period of data collection. To ease in comparison, make that same period between the collection of data before and after repair the problem.
3. Set each cause (from stratification) sequentially in accordance with the value and draw the graph columns. The biggest cause is on the far left. If there is a cause "others", it is placed on the far right.
4. Draw a line graph that shows the percentage in the top of the column chart, beginning with the largest. At the bottom of each column write the name or description of the column.
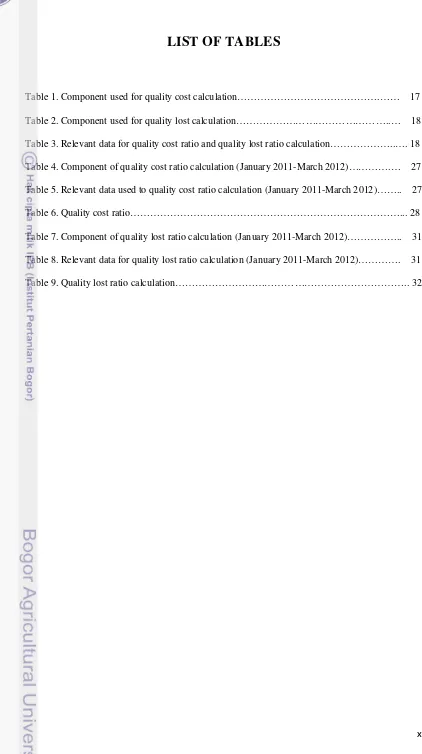
17
IV. METHODOLOGY
A.
TIME AND PLACE
This research carried out for four months, divided into two stages as follows:
a. April 4, ’12 – June 1, ’12 : The data collection and observation of manufacturing process in PT Nestlé Indonesia-Panjang Factory located at Km 13 Jalan Raya Bakauhuni, Panjang, Bandar Lampung, Lampung, 35 241
b. June 4, ’12 – August 3, ‘12 : The data processing in PT Nestlé Indonesia-Head Office located at Wisma Nestlé, 5th Floor Perkantoran Hijau Arkadia Jl. Let. Jen. TB Simatupang Kav.88 Jakarta 12520
B.
METHOD
1.
Observation of Manufacturing Process
Observation is conducted in the production area which includes manufacturing and filling packing.
2.
Data Collection
The data that will be used is secondary data about cost component related to quality in January 2011 to March 2012. Definition of the cost related to quality is different for every company. At Nestlé, there are two types of cost related to quality that are quality cost and quality lost. The following are the data about cost component that should be collected:
Table 1. Component used for quality cost calculation
Data Types Related department
Number of hours for quality training
Human Resource
Number of QA employee Human Resource
Number of AG employee Human Resource
Number of hours for quality audit Quality Assurance
Number of trial product Application Group
Number of monitoring analysis :
- Finished good Quality Assurance
- Semi finished good Quality Assurance
- Line sample Quality Assurance
- Environmental Quality Assurance
- Investigation Quality Assurance
18 Table 2. Component used for quality lost calculation
In order to make a quality cost ratio and quality lost ratio, the following data are also collected during the study.
Table 3. Relevant data for quality cost ratio and quality lost ratio calculation
As the costs component that are related to quality are given the above tables, the following are the explanation of component used for quality related cost ratio calculation obtained from the site (in Nestlé Indonesia-Panjang Factory):
a. Number of training hours is the total of hours used to train workers in order to increase the knowledge and skills of workers. For example hygiene training, extraction training and sensory panelist testing.
Data Types Related Department
Number of complaint Quality Assurance
Number of delayed released:
- Finished good Quality Assurance
- Packaging material Quality Assurance
- Raw material Quality Assurance
Number of overfill Quality Assurance
Number of downgraded product Production & Filling Packing Number of destroyed product Finance & Controlling Number of investigation hours Human resources Number of sample for analysis Quality Assurance Number of expired:
- Finished product Finance & Controlling
- Raw material Finance & Controlling
Number of residues from dust collector Production
Types Related Department
Cost of production Finance & Controlling
Production hours Industrial Performance
Total production (2011) Quality Assurance Total production (2012) Quality Assurance
Total raw material Quality Assurance
Total output :
- Finished product Quality Assurance
- Raw materials Quality Assurance
19 b. Number of hours for quality audit is the total of hours used to audit suppliers of raw materials and packaging materials. This includes the number of hours needed to make a report.
c. Number of trial product is the amount of cost used to conduct trial of new products. This fee includes the cost of raw materials and overhead.
d. Number of monitoring analysis is the number of analyzes performed for the purpose of compliance to existing standards.
e. Number of complaintis the total complaintsreceived fromconsumers andcustomers because of the quality of the product that does not comply with the wishes ofthe customer.
f. Number of delayedreleasedis the total ofdaydifferencebetweena release products with a target of releasetime.
g. Number of overfill is the difference betweenthe actualweight of the product with the declare weight.
h. Number of downgradedproductis the totalproduct thatis defectivebut stillworthy tobe reprocessedinto a final product.
i. Number of product destroyed is the total product that is defective and was not feasibletobe reprocessed.
j. Number of investigation hour is the total time required by the QA employee to investigate issues that occur.
k. Number of sample for analysis is the amount of finished product used for routine analysisandmonitoringanalysis.
l. Number of expiredproductis the total productsthat out of expire date before could be marketed.
m. Number of expired raw material is the totalrawmaterials that out of expire date
andhas notbeen usedforproduction.
n. Number of residues from dust collector is the amount of semi-finished product
whichis trappedby thedust collectorwhenfilling and packingprocess. o. Cost of production is all cost which are incurred for produce a finished product.
p. Productionhouris the number ofhours usedforproductionactivities.
q. Total production is the number of finished product that was produced during a certain period.
r. Total raw material is the amount of raw materials in the warehouse at a certain period.
s. Total output of finished product is the number of finished product out of the warehouseto bemarketed.
t. Total output raw material is the number of raw materials that are out from
warehouse tobe usedfor production.
u. Totaloutput packagingmaterialsis the amount of packagingmaterials that are out from warehouse tobe usedfor production.
3.
Ratio Calculation
20 To make the ratio, the cost component and its denominator must have the same units and give a view of how big the contribution of cost component to the total cost. For example, downgraded product divided by total output and investigation hours divided by production hours.
4.
Priority Concern
After the quality cost and quality lost are converted into ratio, then these are sorted from largest to smallest value. After that, the data is converted into percent of the total ratio. After that these data is converted into Pareto diagram using Microsoft Office Excel 2007. Pareto diagram can be used to determine the components that have big contribution to the cost related to quality.
5.
Priority Action
21
V. RESULT AND DISCUSSION
A.
OBSERVATION OF MANUFACTURING PROCESS
1.
Processing of Instant Coffee
From observation made during the internship in the Panjang factory, basically the processing of coffee from raw materials into an instant coffee powder includes 5 steps, namely roasting, grinding, extraction, evaporation, and spray drying.
a.
Roasting
Before roasting, green coffee should through the tipping process. Tipping process aims to move the coffee beans from the bag into the silo. It also aims to clean the coffee beans from impurities that present in the sack. Coffee that is received from suppliers is placed into the holes tipping. The bottom of the holes tipping is connected with a screw conveyor which functions to transfer the coffee beans to the bottom of bucket elevators. Bucket elevators will lift the coffee beans to the destoner. Outlet section of the bucket elevator is connected to the inlet of destoner.
In the destoner there is a separation between green coffee with other materials such as dust, metal, and wood. After out of destoner, beans are blown to the silo using a blower.
In this stage, the green coffee is roasted in order to remove H2O and CO2, optimizing aroma, and increase size and color. The concept of roasting is flow the air with high temperatures on the outer surface of rotary drum. The green coffee that will be roasted is inside the rotary drum. When the desired color is achieved, roasted coffee is rapidly cooled using water to stop the roasting process.
Figure 1. Roasting coffee in rotary drum The functions of roasting are:
1. The flavor formation.
22 2. The color and texture formation.
During roasting, CO2 and water vapor were resulted in the coffee beans. The pressure in the coffee beans will increase and make it became bigger. Water vapor and CO2 will out from coffee beans gradually but there are some vapor will stay in the roasted coffee. Besides, the color of coffee beans will change became dark.
3. Extractability
Under and over roasting will reduce extractability, because coffee beans that being undercooked or burnt cannot be extracted well.
b.
Grinding
Before entering the extraction process, roasted coffee should be broken down into smaller size as needed. The tool used to break up the roasted coffee is grinder. Grinder used is a kind of multistage. Grinding process also aims to remove the epidermis of the seed. The particles from grinding process are usually referred to roast and ground coffee.
The size of roast and ground coffee can be divided into three kinds, namely coarse, medium, and fine. Coffee that is too large cause the longer extraction process, therefore there is the standard size used an extraction process that is effective and efficient.
Figure 2. Grinding coffee processing
c.
Extraction
After roasted and grinding, extraction is a part in the instant coffee production on a large scale. This stage aims to take a soluble solid and flavor component. The definition of the extraction itself is a process of transferring dissolved solids in the liquid solution form.
23 water, the hot water from the coffee will drive solid through the pores of roast and ground coffee. Then we will get the coffee extract.
Aqueous solutions produced at the extraction process called liquor. After the extraction phase is completed, then it will go to the liquor evaporation.
Figure 3. Extraction process of roast and ground coffee
d.
Evaporation
Evaporation process aims to evaporate the solvent of coffee extract to obtain a more viscous and reduced water content. Tool that was used to evaporate liquor is evaporator.
In the evaporator, the liquor will be evaporated inside the tube. The heating medium used is a steam. The heat from the steam will be transferred trough the tube into the coffee extract. Steam temperature will decrease and then be condensed. Steam condensate will be separated and collected then sent back to the boiler. In the boiler, condensate will be processed back into steam.
Figure 4. Evaporation process of coffee extract
24
e.
Spray Drying
This is the final process in the coffee powder production that is changing the shape of the coffee liquid into a powder with high temperature. Generally there are two methods to change from a liquid to a powder by spray drying and freeze drying. Spray drying aims to change coffee extract from liquid into powder. Besides producing coffee powder, Panjang factory also produce aglomerated coffee. Aglomerated coffee is coffee powder treated with a low pressure wet steam.
Figure 5. Spray Drying
2.
Processing of Coffee Mixes
Besides instant coffee, PT Nestlé Indonesia-Panjang Factory also produces coffee mixes. Coffee mixes is a coffee with additional sugar, cream, and other ingredients (salt, cocoa, flowing agent, etc). The examples of coffee mixes are NESCAFE 3 IN 1 ORIGINAL, NESCAFE CAPPUCINO, and NESCAFE ICE.
The production of coffee mixes in Panjang Factory use machines with high technology. The machines used were controlled by operator in a control room. Production of coffee mixes through the following stages:
a.
Tipping
25 the shifter to remove outer packaging. After the shifter finished, the raw material is delivered into the silo to conduct the tipping process.
.
b.
Filtration
After sugar and creamer has been transferred into different silo, then sugar and creamer get into screw to flow sugar and creamer to the shifter. When sugar and creamer fall into a shifter, these will be blocked by the filter to separate from foreign materials. After filtered, sugar and creamer will be entered into a different shifter for refined. After that, sugar and creamer get into different pipes and blown to the hopper by the blower.
c.
Grinding Sugar
Specifically for the sugar there are two different silos in the silo room. The first silo is used to collect sugar that has not been milled yet. Sugar from the first silo is milled and then collected in the second silo. After blown by the blower, creamer directly entered into storage silos.
For instant coffee, raw material is obtained from the manufacturing that was moved by totebin. Then Instant coffee was transferred from totebin into a silo room. Before entering the silo, coffee must pass hexagon pipe that serves to reduce the particle size of instant coffee.
d.
Weighing hopper
The next process is the determination of the amount of coffee, sugar and creamer that is required. These ingredients will be weighed automatically according to formula that has been determined using a weighing hopper.
e.
Mixing
Furthermore, these three materials were mixed in the mixer machine in order to obtain a homogeneous powder. In addition, the premix was also added in this machine. The addition of premix can be seen from a computer system in the control room. When the premix exhausted it will automatically appear on the PC alarm. Controlling all this process is done from the control room.
After mixing was complete, the PC in the control room will give information that the mixer has full and powder can be taken. Automatically, the lamp in the totebin room will light up to indicate powder was ready to tipping.
26 Figure 6. Mixing Process
B.
QUALITY COST RATIO
1.
Data Collection
There are many components that were used for quality cost ratio calculation. The data used in this study is the data that was collected during in Panjang factory. However, there were some data that could not be collected due to some technical constraints. For example is the data about number of chemical analysis for finished goods and raw materials both for routine and monitoring analysis.
Number of hour for quality related training was obtained from training books in Human Resources department. There is some training that was not recorded in the training books because it was not reported to Human Resources department. The example of training that several times was not reported is sensory training. The data used in this research only the training that was recorded in the training book.
27 Table 4. Component of quality cost ratio calculation (January 2011-March 2012)
There were some relevant data collected which were used to quality cost ratio calculation. These data were used as a denominator in quality cost ratio calculation. These data were also considered to represent the total cost.
Table 5. Relevant data used to quality cost ratio calculation (January 2011-March 2012)
Relevant data Value UoM
Cost of production 599.823.591.687 IDR
Production hours 49.151 Hour
Total output :
Finished product 1.314 Lot
Raw materials 748 Lot
2.
Calculation of Ratio
To determine the component that mainly contributed to the quality cost, each component should have the same unit in order to be compared. Whereas, the components that were obtained have a different unit. Therefore, the components were converted into ratio by dividing them with the relevant data which is considered as the representation of total cost. The relevant components are Cost of Production, Production Hours, and Total Output. Moreover, the conversion aims to get a view of how much each component of quality cost affects the total cost.
Cost component Quantity UoM
Number of hour for quality
related training 319 Hour
Number of QA employee 11 Person
Number of AG employee 4 Person
Number of hours for quality
related audit 486 Hour
Cost for trial product 443.170.780 IDR
Number of microbial monitoring analysis
- Finished good 191 Lot
- Semi finished good 33 Lot
- Line sample 175 Lot
- Environmental 2.535 Lot
- Investigation 577 Lot
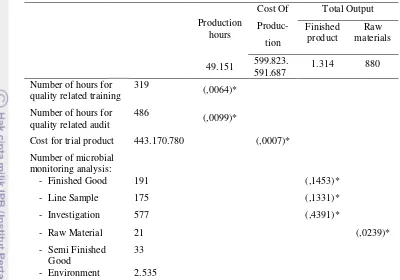
28 Table 6. Quality cost ratio calculation
( )* = Quality cost ratio
Number of hours for quality related training and number of hours for quality related audit was divided by production hours because was considered to represent the quality cost. The same way also happened to cost for product trial and the number of microbial monitoring analysis. Number of microbial monitoring analysis for semi finished product cannot be converted into ratio because the data about total output semi finished product was not available. While number of environment monitoring analysis also could not be converted into ratio because there was no relevant data that could represent quality cost for environment analysis.
The greater value of ratio the greater contribution of cost component to the quality cost. From the table 6 can be seen that the most contributed component to the quality cost is the number of microbial monitoring analysis for investigation. While cost for trial product has the smallest contribution to the quality cost.
3.
Determination of priority concern
After the costs had been converted into ratio, Pareto diagram was created from the existing data. The function of Pareto diagram is to see the figure of the component that mainly contributed to the quality cost. It is important because a company cannot focus to reduce all cost components. Corrective action will be more effective if it focused only to the component that has a big impact to the quality cost.
From the Pareto diagram of quality cost ratio, the component with the biggest contribution to the quality cost is the monitoring for microbiology analysis that consist of investigation, finished product, line sample, and raw material. Component that has a big
Production hours
Cost Of
Produc-tion
Total Output Finished
product materials Raw
49.151 599.823.591.687 1.314 880 Number of hours for
quality related training 319 (,0064)* Number of hours for
quality related audit
486 (,0099)*
Cost for trial product 443.170.780 (,0007)*
Number of microbial monitoring analysis:
- Finished Good 191 (,1453)*
- Line Sample 175 (,1331)*
- Investigation 577 (,4391)*
- Raw Material 21 (,0239)*
- Semi Finished
Good 33
29 contribution to quality cost may not necessarily be a priority concern. This is because some components may have big contribution to the quality cost but the cost component should be spent to meet the product requirement.
Figure 7. Pareto diagram of quality cost ratio
In Nestlé, there are two types of analysis which are routine analysis and monitoring analysis. Routine analysis is done every time product will be released. This analysis should always be done because it is used as a product release requirements. Meanwhile, the monitoring analysis is conducted for the purpose of compliance with existing standards such as SNI and ISO.
Based on existing data, the number of monitoring analysis performed in Panjang factory is almost the same as schedule. In schedule, the number of monitoring analysis of raw material performed 25 times while in reality the number of monitoring analysis of raw material has been conducted 21 times. For finished product the number of monitoring analysis in schedule should be done 220 times and in reality the number of monitoring analysis has been done 191 times.
Parameter analyses carried out in a certain monitoring differ with other monitoring (Figure 2). This determines the amount of costs that should be spent to monitor a particular category. Monitoring finished product has the highest number, both in terms of parameters amount and its frequency. Finished product is the most important aspect to be controlled because it relates directly to the consumers; consequently, there are many parameters must be analyzed. When compared with the monitoring finished product, the number of parameters and frequency of monitoring analysis performed on the raw material is much smaller. Raw material is obtained from a reliable supplier of quality raw material so that the control is mostly done at the supplier.
Ac c um ula t ion (% ) -10,00 20,00 30,00 40,00 50,00 60,00 70,00 80,00 90,00 100,00 0 0,1 0,2 0,3 0,4 0,5 0,6 0,7 Ra ti o
30 Figure 8. Parameter analysis of monitoring analysis
Based on the explanation above, the number of monitoring analysis for finished product and raw material are agreed for the purpose of compliance to existing standards. The investigation of analysis is only performed if there is a problem issue while the line sample is only done as needed. So we can conclude that there is no cost incurred that is not useful.
Efficiency in quality related cost doesn’t always mean that all costs must be reduced. Sometimes the amount of certain cost must be maintained or even added to reduce or prevent the other costs. In this case the number of monitoring analysis performed was effective. If the cost for this action is reduced, it will decrease the quality of the products that result in increase quality lost.
C.
QUALITY LOST RATIO
1.
Data Collection
The number of investigation hours was obtained from document Corrective Action Report (CAR). There is no data that shows times to finish the investigation. So this study use time estimation of 16 hours for doing an investigation and complete the report.
The same case also happened to number of residues product from dust collector. There is no data that record the number of product that was wasted every day. Based on the information from workers, the number of finished product that was collected in dust collector everyday around 12 kg.
0 500 1000 1500 2000 2500 3000 3500 4000 4500
Lo
t
LAB
Microflora
Salmonella
EB
Yeast & Mold
Staphylococcus
E Coli Qualitative
E Coli Quantitative
31 Table 7. Component of quality lost ratio calculation (January 2011-March 2012)
Besides component of quality lost, there are some relevant data collected which used to quality lost ratio calculation. These data are used as a denominator in quality lost ratio calculation. These data are also considered to represent the total cost.
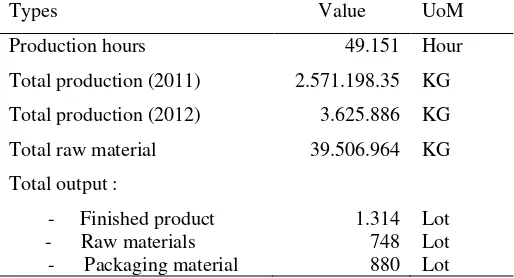
Table 8. Relevant data for quality lost ratio calculation (January 2011-March 2012)
Types Value UoM
Production hours 49.151 Hour
Total production (2011) 2.571.198.35 KG
Total production (2012) 3.625.886 KG
Total raw material 39.506.964 KG
Total output :
- Finished product 1.314 Lot
- Raw materials 748 Lot
- Packaging material 880 Lot
Types Number UoM
Number of complaint 9 Complaint
Number of delayed released
- Finished good 158 Lot
- Packaging material 121 Lot
- Raw material 482 Lot
Number of overfill 23.293.97 KG
Number of downgraded product 103784 KG
Number of destroyed product 15.819 KG
Number of investigation hours 352 KG
Number of sample for analysis 732.249 KG Number of expired
- Finished good 9.200 KG
- Raw material 2.287 KG
Number of residues product from
[image:33.595.206.463.474.613.2]32
2.
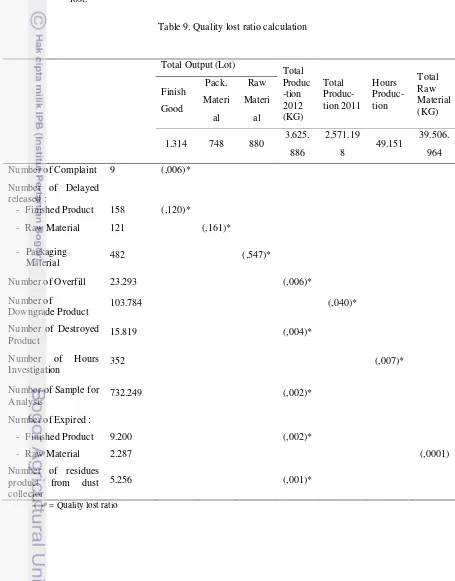
Calculation of ratio
[image:34.595.79.534.192.773.2]The quality lost ratio calculation is done by dividing the components of quality lost with the relevant data that can represent quality lost. For example, the number of complaint divided by total output finished good. This is because the total output is considered to represent the total cost for the number of complaint so that the ratio can represent quality lost. The same way also happened to the other component of quality lost.
Table 9. Quality lost ratio calculation
Total Output (Lot) Total
Produc -tion 2012 (KG) Total Produc-tion 2011 Hours Produc-tion Total Raw Material (KG) Finish Good Pack. Materi al Raw Materi al
1.314 748 880 3.625.
886
2.571.19
8 49.151
39.506. 964
Number of Complaint 9 (,006)*
Number of Delayed released :
- Finished Product 158 (,120)*
- Raw Material 121 (,161)*
- Packaging
Material 482 (,547)*
Number of Overfill 23.293 (,006)*
Number of
Downgrade Product 103.784 (,040)*
Number of Destroyed
Product 15.819 (,004)*
Number of Hours
Investigation 352 (,007)*
Number of Sample for
Analysis 732.249 (,002)*
Number of Expired :
- Finished Product 9.200 (,002)*
- Raw Material 2.287 (,0001)
Number of residues product from dust collector
5.256 (,001)*
33
3.
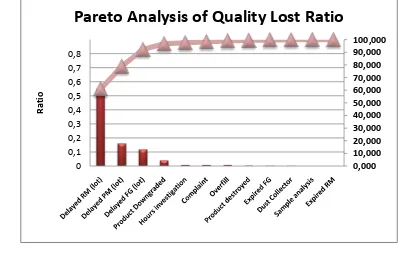
Determination of priority concern
Based on Pareto diagram of quality lost, component with the biggest contribution to the quality lost is the delayed release packaging materials, raw materials, and finished product. Delayed release occurs when the products are late to be released from the warehouse to the market or raw materials are late to be used for production from the given time. Delayed release is a serious problem that must be addressed immediately because it can cause a lot of disadvantages such as energy, money, consumers, and the opportunity to get profit from the sale. Moreover, delayed release has bigger contribution to the quality lost than any other component.
[image:35.595.130.528.316.576.2]Delayed release raw material and packaging material has the biggest value ratio. But if observed further; it doesn’t have significant influence to the operation since released time still under the Stock Cover Policy (SCP). SCP is a Nestlé’s system that regulate tolerance limit of delayed release. This indicated that the corrective action is better focused on the delayed release of finished product.
Figure 9. Pareto analysis of quality lost ratio
4.
Priority Action.
Delayed release of finished product make the stock of the product in market became low; it will impact to the loss sales possibility. In addition, if the product has delayed release means that there are additional costs for maintaining the product in the warehouse.
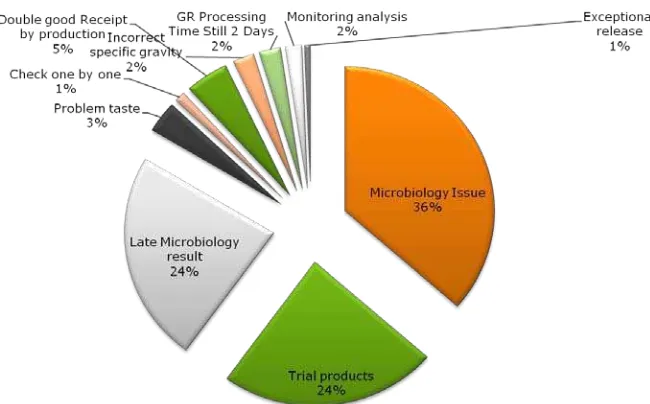
Based on existing data (Figure 10), three main reasons for the delayed release of finished product are the microbiology issue, late microbiology result, and trial product. Microbiology issue is a problem that occurs because of microorganisms’ contamination in products such as high TPC (Total Plate Count) and Coliform positive
0,000 10,000 20,000 30,000 40,000 50,000 60,000 70,000 80,000 90,000 100,000
0 0,1 0,2 0,3 0,4 0,5 0,6 0,7 0,8
Ra
ti
o
34 Figure 10. Reason of delayed released finished product
Microorganisms are biological entities, and they can be a benefit or a potential hazard to human and to the food manufacturing industry. Bacteria represent the largest group of microorganisms. Most bacteria are harmless; in fact some benefit humans by providing protection on the skin and in the nasal passages, and aid in the digestion process. However, they can pose a threat to humans and to the industry when they result in food-borne illness and food spoilage. Microbiological contamination of food may result in product spoilage, reduction in shelf life, or food-borne illness. Bacteria that result potential hazard to human and to the food manufacturing industry are called pathogen bacteria. The common pathogen bacteria in food industry are Escherichia coli O157:H7, Salmonella, Staphylococcus aureus, Bacillus cereus, Listeria monocytogenes, and Campylobacter (Michael 2006).
Bacteria have varying growth requirements as do more complex living organisms. They all have basic needs of food, water activity, and time for growth. Bacteria need certain nutrient for their metabolism. Based on the nutrients they metabolize, bacteria can be categorized as proteolytic (protein), lipolytic (fat), Amylitic (starch), Saccharolytic (pectins), and cellulytic (Michael 2006). Food products contain varying amounts of water, and the water activity of the product indicates the potential for microbiological growth. A level of 0,95 or higher means water is available for growth (Ray 1996).
Knowing the characteristics of each bacterium is very important for the food industry. By knowing the characteristics will be known bacteria that potentially contaminate the products of an industry. So that prevention efforts can be done more accurately.
35 The most common bacteria that cause delayed released finished product in PT. Nestlé Indonesia-Panjang Factory are coliform bacteria. Although they may not result in food-borne illness, large numbers of coliforms are not desirable in foods and may indicate that production environment was not sanitary (Michael 2006). Moreover, coliform bacteria also became indicator of pathogenic bacteria because its presence was positively correlated with the bacterial pathogen. Coliform bacteria such as E coli can grows at 10-42 0C, and Aw < 0,92 (Buege and Ingham 2000).
A coliform bacterium such as E coli is most often found in the human digestive tract. So its presence indicated that the most possible source of contamination is from human or employee.
All person working in direct contact with food, food-contact surfaces, and food packaging materials shall conform to hygienic practices while on duty to the extent necessary to protect against contamination of food. For that the training about implementation of hygiene concept is needed. The importance of educating and training plant employees cannot be overlooked in regard to microbiological control. All plant personnel must understand their role in preventing microbiological contamination of product (Michael 2006).
Based on existing data, number of hours for training related quality in Panjang factory has a small ratio if compared with other component of quality cost. For that, the management could consider adding hours training related to quality especially for the implementation of hygiene concept. Knowing the hygiene concept is not guarantee that a worker would be willing to implement it. So, besides knowledge of hygiene, management could consider to give training that can increase employee awareness and practicing the hygiene concept in their life.
One example of good training is from Ricoh, a company from Japan. Ricoh has implemented a structured training system by dividing training into six levels based on the competences of the workers. The following are levels of training provided by Ricoh:
1. Training for workers who do not know anything
2. Training for workers who only understand the concept when explained. 3. Training for workers who imitate the activities of others but can not initiate
action for themselves.
4. Training for workers who are capable of providing useful comments. 5. Training for workers who are able to plan and implement activities for
themselves.
6. Training for workers who implement activities automatically and has become their daily life.
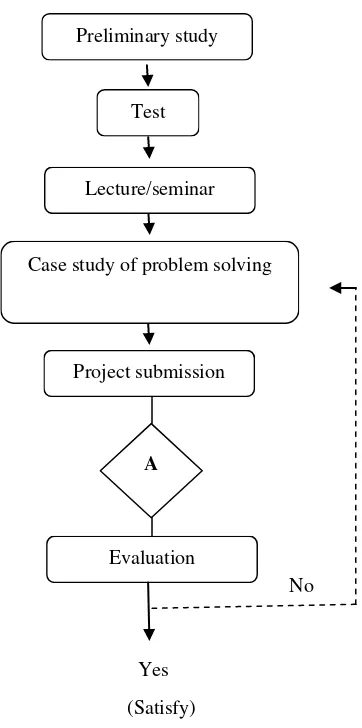
36 studies. Furthermore, participants must propose a new case study. Meanwhile, workers who pass the training will get scores that will be used for consideration to promoted.
[image:38.595.249.430.166.530.2]In this training system there is a direct relation between training and career development. This is important because it can encourage workers to participate in quality improvement, so the training will be more effective.
Figure 11. Training stage of Ricoh company
Another reason which cause to delayed release of finished product is a late result of microbiology analysis. Microbiology analysis for pathogenic bacteria such as Salmonella cannot be done at the Panjang Factory Laboratory so the analysis should be performed at the Kejayan and Cikupa Laboratory. This is spending a lot of time from delivery until the result is received. Samples are sent by a particular person who brought the task given by plane. This causes a lot of external factors such as travel conditions made for submission of the analysis results becomes uncertain.
This sample delivery system has a lot of weaknesses that can lead to delays in the result of analysis. This often leads to miscommunication between workers about samples code. The code written on the label was not the same with the form which was sent via email. So that the laboratory should con