INTEGRATED USE OF ARCGIS AND USLE FOR PREDICTING SOIL DEGRADATION IN
HU TZU SHAN SLOPE TAIWAN
P
ENGGUNAANT
ERPADUARGIS
D
ANUSLE
U
NTUKM
EMPREDIKSID
EGRADASIT
ANAHD
IL
ERENGH
UT
ZUS
HANT
AIWANMaizuar
Civil Engineering Department, Faculty of Engineering, University of Malikussaleh Jl. Tengku Chik Ditiro No. 26 , Lhok Seumawe, NAD, 24351, Indonesia.
E-mail : [email protected]
ABSTRACT
Soil erosion has become one of the major causes of land degradation in many countries. The process is initiated when soil particles are detached from its original configuration by erosive forces such as rainfall. This paper presents the prediction of soil loss carried out which combines the Universal Soil Loss Equation (USLE) with the computer capabilities of a GIS, specifically the software package ArcGIS 9 student edition. The USLE estimate the soil loss based on the relationships of the following factors, rainfall (R); soil erodibility (K); topography (LS); vegetation (C); and erosion control and practice (P). The input data of the factors for each field was derived from available land information and field surveys. The study was conducted in Hu Tzu Shan, Taiwan, Republic of China. A digital elevation model (DEM) of Hu Tzu Shan area was created by digitizing contour and grid themes for K and C factors. The topographic factor that incorporates the length factor L and the slope factor S of each field, required to compute the LS factor, were derived from field boundary information and a DEM constructed using ArcGIS tools. A distribution map of the rate indicated the soil loss estimation of each field was presented. The result shows that the average maximum soil loss obtained was 91.30095 ton/acre per year. Serious rate soil loss (greater than 20 ton/acre/year) was obtained approximately 18.2% of the total soil loss estimation at Hu Tzu Shan area. It is therefore suggested some structural measures such as retaining wall should be installed at the serious rate fields. It also found that combining the USLE with ArcGIS tools was likely to be useful for estimating soil loss on a local scale for slope maintaining.
Keywords: Soil loss, USLE, DEM, ArcGIS
ABSTRAK
Erosi telah menjadi salah satu penyebab utama dari degradasi tanah di beberapa negara. Prosesnya didauhului ketika partikel-partikel tanah terlepas dari struktur tanah aslinya akibat gaya erosi seperti hujan. Tulisan ini membahas prakiraaan jumlah tanah lepas yaang mengkombinasikan Universal Soil Loss Equation (USLE) dengan perhitungan komputer GIS, khususnya perangkat lunak ArcGIS 9 student edition. USLE memperkirakan tanah lepas berdasarkan pada hubungan beberapa faktor berikut, curah hujan (R); erodibiltas tanah (K); topographi (LS); tumbuh-tumbuhan (C); dan pengedali erosi dan erosi nyata (P). Data masukan setiap faktor-faktor tersebut diturunkan dari kemampuan dan infromasi dan studi lapangan. Studi ini dilakuka di HU Tzu Shan, Taiwan, Republik China. Sebuah model elevasi digital dari wilayah Hu Tzu Shan dibuat dengan kontur dan gridnya digital untuk faktor K dan C. Faktor topography terkait dengan faktor panjang L dan faktor kemiringan lahan S, diperlukan untukmenghitung faktor LS, diturunkan dari infromatsi dareah batas dan DEM dibangun menggunakan ArcGIS. Sebuah peta tingkat distribusi menunjukkan prakiraan tanah lepas yang terjadi disetiap daerah studi tersajikan. Hasilnya menunjukkan bahwa rata-rata maksimum dari tanah lepas didapatkan sebesar 91,30095 ton/acre per tahun. Laju tanah lepas (lebih dari 20 ton/acre/tahuun) didapatkan mendekati 18,2% dari total prakiraan tanah lepas di wilayah Hu Tzu Shan. Oleh karena itu disarankan membangun bangunan penanggulangan seperti dinding penahan pada daerah-daerah yang kritis. Hal tersebut juga disarankan menggubungkan dengan ArcGIS setiap saat untuk memprakirakan tanah lepas pada skala lokasi untuk mempertahankan kemiringan tanah.
Kata-kata kunci: Soil loss, USLE, DEM, ArcGIS
INTRODUCTION
Taiwan is a country heavily affected by natural disasters, many of which are linked to land degradation. Soil erosion is one form of soil degradation along with soil compaction, low organic matter, loss of soil structure, and poor internal drainage prob-lems. These forms of soil degradation, serious in themselves, usually contribute to accelerated soil erosion. Erosion hazard is a major land degradation problem in mountainous environment (Peng et al, 2008). Soil erosion may be affect and disrupt trans-portation routes, water supply storage and urban construction. The total amount of soil degradation from the land is very large. The human activities, man-made slopes, cuts and embankment are also a main cause of the soil degradation (Ha, 2009). Soil e-rosion is defined as the physical degradation of the landscape o-ver time. The process is initiated when soil particles are detached
from its original configuration by erosive forces such as rainfall (Khosrowpanah, 2007
).
It has been very difficult to predict the soil loss because of the complexity of the factors involved and the relationship to each other which is wide ranging. The influence factors which are usually related to soil loss are geology, soil type, land surface temperature, land cover, underground water level, slope aspect, slope inclination, elevation, etc. Normally the causes of soil loss are determined by carrying out some sampling of the soil, rock, slope inclination, land cover, underground water level, geology, etc. at the site.
and steepness factor, cover and management factor and support practice factor. USLE was developed mainly for soil erosion mation in croplands or gently sloping topography. USLE esti-mates soil loss from a hill slope caused by raindrop impact and overland flow (commonly termed "interrill" erosion), plus rill erosion. It does not estimate gully or stream channel erosion. Al-though USLE has many shortcomings and limitations, it is wide-ly used, especialwide-ly at regional and national level, because of its relative simplicity and robustness and because it represents a standardized approach. USLE has not been designed to operate at field scale, however, it was noted that there is room for improv-ing the accuracy of results by usimprov-ing more detailed digital eleva-tion models, satellite data, with enhanced geometric characteris-tics, and more detailed soil information (Gitas, 2009).
It is time consuming to do this for a large scale area from time to time. There is considerable potential for the use of GIS technique as an aid to soil erosion hazard assessment. GIS tech-nique has been recognized as a powerful and effective tool for predicting soil erosion process. Spatially distributed models have been developed to incorporate the spatial patterns of GIS. A digi-tal elevation model (DEM) is a type of spatial data set, which describes the elevation of the land surface. The height and form of terrain have a fundamental influence on most environmental phenomena. Consequently, DEMs are widely used in applications of GIS (Bawahidi, 2005).
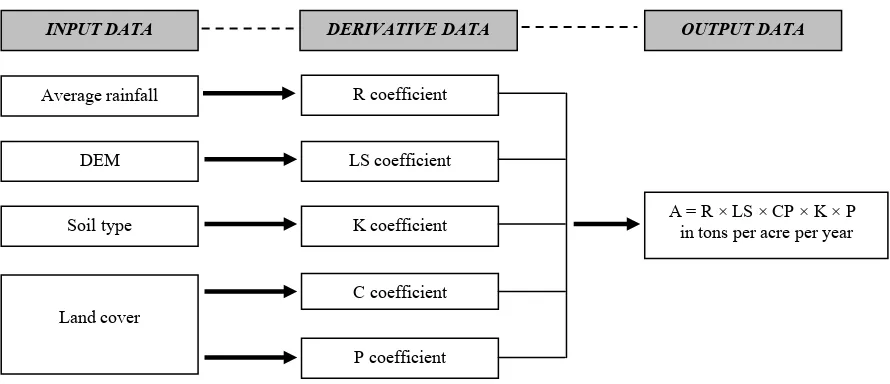
ArcGIS is one of commercial software product that builds an integrated collection of GIS and supports a variety of applica-tions (Anon, 2005). These programs support friendly user inter-faces and 3D system mapping. Development and collection of in-ventory data are the most expensive aspects of performing soil loss estimation. They are often a limiting factor in the develop-ment of a comprehensive study. Thus, combining the USLE with ArcGIS tools all the information can be combined, manipulated and analyzed for estimating soil loss on slopes. Several studies have indicated that remote sensing data and GIS can be used as a first stage input to identify and map the degradation lands (Jab-bar, 2003). This study was establish to predict the average of soil loss (tons/acre) per year by combining the USLE method and geographic information system tools ArcGIS
.
METHODS
Study Site
The study site is located in Hu Tzu Shan, Taiwan, Republic of China. The total area covers approximately 46.77 km2. Hu Tzu Shan lies between 120.96º to 120.98º E longitudes and 23.98º to 24.48º N latitudes. The location is in southern part of Taiwan, approximately 45 km from Taipei city and 3 km from Keelung city. The topography is varied and complicated, with towering hi-lls area, with an elevation of 933 m, different sizes, and low river valley, with an elevation of 451 m. This region belongs to sub-tropics weather. About 90 percent of annual rainfall concentrated between June and October.
USLE Method
The Universal Soil Loss Equation was developed by Wischmeier and Smith in 1978 to estimate the average annual soil loss occurring over an area. The USLE is an empirical equa-tion computes soil erosion as the product of six factors representing rainfall erosivity, soil erodibility, slope length, slope steepness, cover management practices, and support conservation pra-ctices. It is based on statistical analysis of erosion measured in the field on scores of test plots under natural and simulated rainfall. The annual soil loss from a site was predicted according to the following relationships:
P : Erosion Control and Practice Factor
The climate factor R and erodibility factor K only vary wi-thin one order of magnitude. These factor are essentially fixed for a given site and are not subject to change or modification. The cover factor C and the topographic factor LS can be modified substantially to suit a particular erosion control objective. The to-pographic factor LS can be modified most easily by reducing slo-pe length, that is by converting along, steep sloslo-pe into a series of short, steep slopes.
Factor Cis the crop or land cover management factor and measures the combined effect of all the interrelated vegetative cover and management variables. It is defined as the ratio of soil loss from land maintained under specified conditions to the cor-responding loss from continuous tilled bare fallow (Simms et al, 2003). Factor C values tend to change with time following certain types of surface treatment such as mulching, seeding and trans-planting. For example, factor C values for grass may decrease from 1.0 (for fallow, bare ground) to about 0.01 between time of initial seeding and full establishment. In this case, an average or weighted factor C value can be computed for a construction pe-riod using time as the weighting parameter and estimating C fac-tor values for successive time intervals.
The
erosion control practice factor P has been interpreted in several ways. These practices can be viewed as structural-mechanical, hydraulic, or grading practices that reduce the ve-locity of runoff and/or the tendency of water to flow directly down slope. Structural measures include grade stabilization struc-tures (chutes, flumes, check dams, water ladders), level spread-ers, di-versions, and interceptor berms. Even sediment basins can be classified and evaluated as a form of control practice. Basins do not stop erosion; instead, they keep eroded material from leav-ing a site and causleav-ing off-side damage. Methods for determinleav-ing and assigning factor P values for structural measures and basins are given elsewhere. Currently there are no support practices in place within the study site. The common practice is to assign a value of 1 for the P factor. After calculating the estimated soil loss by USLE, the P factor values can be adjusted to forecast various erosion prevention measures. The USLE is recalculated for each proposed measure to determine how much the soil loss is reduced from its initial calculation (Khosrowpanah, 2007). The degree of surface roughness and orientation of indentations does have a sig-nificant influence on the lodgment of seed and estab-lishment of vegetation on a slope.Input Database
In this study, several types of input data were used to ex-tract relevant information and apply to the model. These input da-ta include region map and elevation, rainfall record, landuse dada-ta, soil properties and slope aspect.
Region Map and Elevation
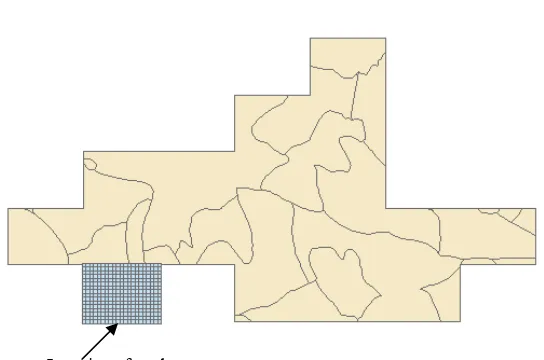
available from published reports. The location of study area are presented in Figure 1.
Rainfall Record
The rainfall factor is calculated as the product of the kinetic energy of the storm event and the 30 minute intensity. The data-set of rainfall record for each field were derived from available land information and a digital elevation model (DEM) con-structed using GIS tools.
Land Use Data
Land use is the human modification of natural environment or wilderness into built environment such as fields, pastures, and settlements. The C factor can be obtained from tables or using the information about land use and management given by program. The C values assigned was presented in Table 3.
Soil Properties
A digital elevation model (DEM) of Hu Tzu Shan, which was created by digitizing contour and spot heights from the topo-graphic map and grid themes for the K and C factors. The K fac-tor is the soil loss rate per erosion index unit for a specified soil as measured on a standard plot, which is defined as a 72.6 ft
(22.13 m) length of uniform slope (9%) in continuous clean-tilled fallow. The assigned K factor can be obtained by adding the K
factor as an attribute to a soil theme's table. The K values as-signed was 0.037 and 0.043
Slope Aspect
Slope aspect is a topographic factor that incorporates the length factor L and the slope factor S. The effect of each factor on the rate of soil erosion has been evaluated separately in research. In the field of application, however, it is more convenient to con-sider the two as a single topographic factor LS. In USLE, the slo-pe length factor (L) is defined as the ratio of soil loss from the field slope length to soil loss from a 72.6 ft (22.13 m) length un-der identical conditions. The L factor shall be determined as fol-low :
L : Slope length factor
λ : Slope length in horizontal plane (4 m)
m : Index related to slope gradient
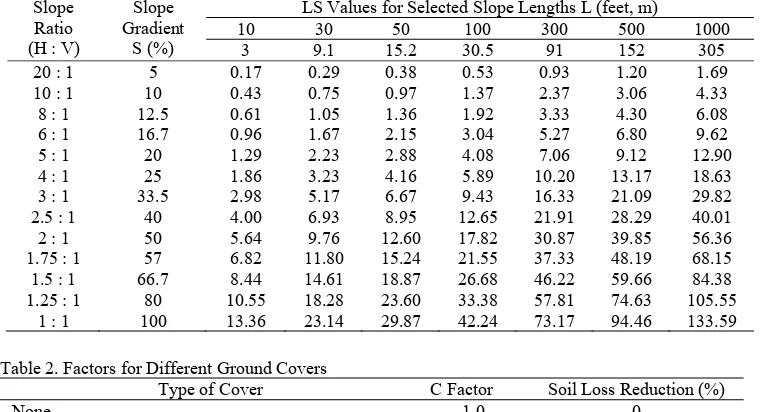
Table 1. Topographic Factors LS for Slopes Slope
LS Values for Selected Slope Lengths L (feet, m)
10 30 50 100 300 500 1000
Table 2. Factors for Different Ground Covers
Type of Cover C Factor Soil Loss Reduction (%)
None 1.0 0
Native vegetation (dense, undisturbed) 0.01 99
Temporary seeding :
- 90% cover, annual grasses, no mulch 0.1 90
- Wood fiber mulch, 0.75 ton/acre, with seed 0.5 50 Excelsior mat, jute netting (slopes up to 2:1) 0.3 70 Straw mulch :
- 1.5 tons/acre (3.4 t/ha), tacked down 0.2 80
- 4.0 tons/acre (9.0 t/ha), tacked down 0.05 95
The m values can be obtained from Table 4. The calculated
L factor obtained using equation 2 was 0.425. The S factor is the ratio of soil loss from the field slope gradient to soil loss from a 9% slope under otherwise identical conditions and determined using the following equations :
5.14
Table 3. Input C Values
ID Type of Cover C Value
1 Broadleaf forest 0.01
2 Grass land 0.05
3 Man-made bamboo tree 0.01
4 Bamboo tree 0.01
5 Tea tree 0.15
6 Orchard 0.20
7 Betel palm farm 0.10
8 Vegetable 0.39
9 Other agricultural land 0.20
10 Barren land 1.00
11 Landslide 1.00
12 Building 0.01
13 Cemetery 0.01
14 Road 0.00
15 Water 0.00
Table 4. Slope Gradient Vs m Value
Slope Gradient (%) m Value
< 0.1 0.2
1.0 - 3.0 0.3
3.0 - 5.0 0.4
> 5.0 0.5
Table 5. Soil Texture Vs K Value Soil Texture
K Value
Codes Symbols Soil Types
1 S Sand 0.012
2 LS Loamy Sand 0.015
3 C Clay 0.018
4 SiC Silty Clay 0.021
5 SL Sandy Loam 0.024
6 CL Clay Loam 0.027
7 SCL Clay Loam with Sand 0.03
8 SC Sandy Clay 0.034
9 L Loam 0.037
10 SiCL Clay Loam with Silt 0.04
11 SiL Silty Loam 0.043
12 Si Silt 0.046
Location of study area
Table 6. Percentage of soil erosion potential within Hu Tzu Shan area The classified grades of the soil erosion
potential data
The classified boundary (ton/acre/year)
Occupied percentage of the all areas in Hu Tzu Shan Taiwan (%)
Low soil erosion region 0 - 10 28.4
Medium soil erosion region 10 - 20 53.4
Serious soil erosion region > 20 18.2
RESULTS AND DISCUSSION
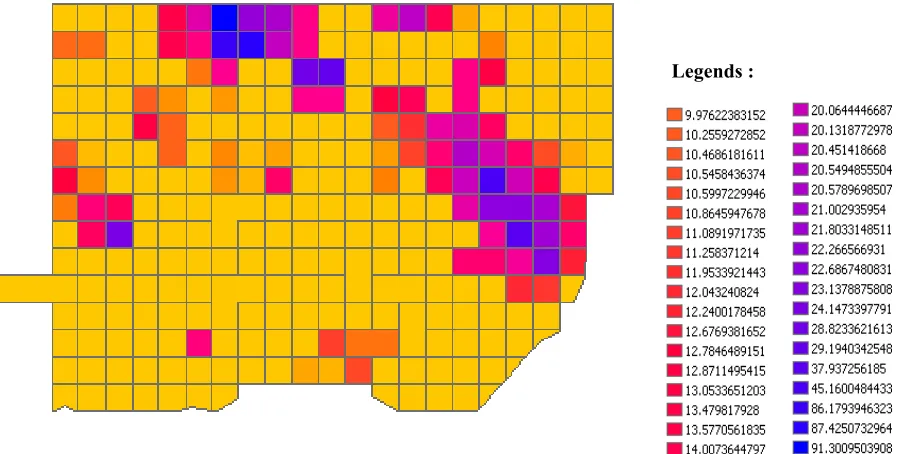
The procedures used for prediction the soil loss estimation have been presented. The ArcGIS computer software was em-ployed to process and analyze the necessary input data. A distri-bution map of the rate indicated the soil erosion classes for each cell within Hu Tzu Shan area was presented in Figure 3. The map obtained using ArcGIS simulation produces impressive graphical results. The rate of soil loss of the field is characterized by using different color of layers. The average total soil loss at Hu Tzu Shan area are presented in Table 6. The average maximum soil loss obtained is 91.30095 ton/acre per year. At the mean time, the average rainfalls per year is 29534 mm. It indicates that the max-imum soil loss not always occur when the total amount of preci-pitation is high. It clearly describes that the prediction of soil loss depends on the complexity of the factors involved and the re-lationship to each other which is wide ranging.
Results of the simulation for each field predicted that the mean annual net soil loss was about 14 ton/acre per year. Apro-ximately 28.4% was predicted to have soil loss between 0 ton/ acre/year to 10 ton/acre/year. The soil loss ranges between 10 ton/acre/year to 20 ton/acre/year was estimated 53.4%. Serious rate soil loss (greater than 20 ton/acre/year) was obtained apro-ximately 18.2% of the total soil loss prediction at Hu Tzu Shan area.
The estimated erosion rate is much higher than the permiss-ible value of 5 -11 ton/acre/year adopted by the USA. Although an appropriate soil loss tolerance limit has not yet been deter-mined for the tropics and Taiwan, it is clear that the soil conser-vation programmes need to be intensified in Taiwan in order to preserve the precious soil resource which has a direct influence on the stability of slope.
For the slope stabilization and maintaining, it is necessary to reduce slope degradation by protecting them at the field where the maximum soil loss occurred. It has been known that landslide
potentially occurs where the total amount of soil degradation from the land is very large. Therefore, some structural measures such as retaining wall should be installed in the field where slope degradation potentially occur during heavy rainfall seasons.
CONCLUSIONS
Based on the results obtained, areas of high erosion may be easily identified within the site. Subsequent land development should avoid such areas because they need to be adequately protected with appropriate protection strategies. Soil loss estimation can identify the field where slope degradation potentially occurs. Ho-wever, It is very difficult to predict the soil loss because of the complexity of the factors involved and the relationship to each other is wide ranging. The influence factors which are usually re-lated to soil loss are geology, soil type, land surface temperature, land cover, underground water level, slope aspect, slope inclina-tion, elevainclina-tion, etc. This study was establish to predict the aver-age of soil loss (tons/acre) per year by combining the USLE me-thod and geographic information system tools Arc GIS. The stu-dy was conducted at Hu Tzu Shan, Taiwan, Republic of China. The result shows that the average maximum soil loss obtained is 91.30095 ton/acre per year. Serious rate soil loss (greater than 20 ton/acre/year) was obtained approximately 18.2% of the total soil loss estimation at Hu Tzu Shan area. It is therefore suggested so-me structural so-measures such as retaining wall should be installed at the serious rate fields. In term of global aspect, the combintion of USLE with ArcGIS tools was likely to be useful for estimating soil loss on a local scale for slope maintaining at the field where the maximum soil loss occurred.
Average rainfall
DEM
Soil type
Land cover
R coefficient
LS coefficient
K coefficient
C coefficient
P coefficient
A = R × LS × CP × K × P in tons per acre per year
INPUT DATA DERIVATIVE DATA OUTPUT DATA
REFERENCES
Anon. (2005). ArcGIS Solutions for Civil Engineering, GIS – The Intelligent Platform for Civil IT. http://www.esri.com/ inter-national.
Bawahidi, K. S. Y. (2005). “Integrated Land Use Change Analy-sis for Soil Erosion Study in Ulu Kinta Catchment.” PhD Dissertation, University Sains Malyasia, Malaysia.
Du, Y. J. and Hsu, C. L. (2006). Exercise in USLE. National Taiwan University of Science and Technology, Taiwan, ROC.
Gitas, I. Z., Douros, K., Minakou, C., Silleos, G. N., and Kary-das, C. G. (2009). “Multi-Temporal Soil Erosion Risk As-sessment in N. Chalkidiki Using a Modified USLE Raster Model.” Proceedings of the EARSel eProceedings 8, p. 40. Ha, N. M. (2009). “Spatial Modeling for Soil Erosion in Chay
Basin in Vietnam.” Proceedings of the 7th FIG Regional
Con-ference Spatial Data Serving People : Land Governance and the Environment – Building the Capacity, Hanoi, Vietnam.
Jabbar, M, T. (2003). “Application of GIS to Estimate Soil Ero-sion Using RUSLE.” Journal of Geo-Spatial Information Science Vol. 6 No. 1 (2003) 34.
Khosrowpanah, S., Heitz, L. F., Wen, Y., and Park, M. (2007). “Developing a GIS-Based Soil Erosion Potential Model of The Ugum Watershed.” Technical ReportNo. 117, Water and Environmental Research Institute of the Western Pacific, U-niversity of Guam, Guam, p. 33.
Peng, W., Zhou, J., He, Z., and Yang, C. J. (2008). “Integrated Use of Remote Sensing and GIS for Predicting Soil Erosion Process." The International Archives of the Photogrammetry, Re-mote Sensing and Spatial Information Sciences, Vol. 37, Part B4, Beijing, p. 1647.
Simms, A. D., Woodroffe, C. D., and Jones, B. G. (2003). “Ap-plication of RUSLE for Erosion Management in a Coastal Catchment Southern NSW.” Faculty of Science Paper, Uni-versity of Wollongong, Australia, p. 680.
Legends :