DISSERTATION
COMPARISON OF EMISSION AND ENERGY FOR
BIODIESEL PRODUCTION FROM OIL PALM (Elaeis
guineensis) AND JATROPHA CURCAS (Jatropha curcas L.)
BASED ON LIFE CYCLE ASSESSMENT (LCA) IN
INDONESIA
KIMAN SIREGAR
THE GRADUATE SCHOOL
BOGOR AGRICULTURAL UNIVERSITY (IPB) BOGOR
2013
(PERBANDINGAN EMISI DAN ENERGI PRODUKSI BIODIESEL DARI
KELAPA SAWIT (Elaeis guineensis) DAN JARAK PAGAR (Jatropha curcas L.)
STATEMENT OF RESEARCH ORIGINALITY
Hereby, I state that the dissertation entitled “Comparison of Emission and Energy for Biodiesel Production from Oil Palm (Elaeis guineensis) and Jatropha Curcas (Jatropha curcas L.) Based on Life Cycle Assessment (LCA) in Indonesia” is my own work, which has never previously been published in any university. All of incorporated originated from other published as well as unpublished papers are stated clearly in the text as well as in the references.
Bogor, July 2013
SUMMARY
KIMAN SIREGAR. Comparison of Emission and Energy for Biodiesel Production From Oil Palm (Elaeis guineensis) and Jatropha Curcas (Jatropha curcas L.) Based on Life Cycle Assessment (LCA) in Indonesia. Supervised by ARMANSYAH H. TAMBUNAN, ABDUL KOHAR IRWANTO, SONI SOLISTIA WIRAWAN and TETSUYA ARAKI
Energy sector plays an important role for Indonesia in achieving its economic development goal. Indonesia is still heavily dependent on fossil based energy, which is accounted for more than 90% of its energy mix (including oil, gas and coal). Biodiesel is one of the biofuel being developed and used intensively in Indonesia. Biodiesel can be produced from various oil borne plants, such as palm oil, jatropha curcas, rapeseed, soybean, etc. The USA produced their biodiesel from soybean, Euoropean countries from rapeseed, while Indonesia mainly from palm oil. Currently, environmental consideration becomes the most important issue in biodiesel production. Even though the source of the energy is considered as carbon neutral, the production path can emit various environmentally hazardous gasses.
European and American countries claim that production of biodiesel from palm oil contributes carbon emission to atmosphere along its production path. Furthermore, US EPA-NODA and EU RED stated that palm oil based biodiesel can only reduce emission of GWP by 17% and 19% compared to fossil-fuel based. Considering that the minimum requirement is 20% for US and 35% for EU, CPO from Indonesia experiences difficulties to enter the global market. Scientific approach should be undertaken by Indonesia to address this issue. However nowadays we only still have few numbers of international scientific publications regarding the environmental aspect of biodiesel production. Appropriate method to analyze aforementioned problems is Life Cycle Assessment (LCA) which complies with the International Organization for Standardization(ISO).
This study is aimed to compare life cycle assessment of biodiesel production from oil palm and jatropha produced in Indonesia. The LCA system boundary for this study was from cradle to gate, which consists of eight sub-processes, with functional unit (FU) of 1 ton biodiesel fuel (BDF).
Life cycle inventory (LCI) analysis was performed using the data collected from oil palm plantation and Jatropha curcas centre, both located in western part of Jawa island in Indonesia, become primary data. The analysis was also grouped into unstable production stage and stable production stage in order to accommodate the natural growth characteristics of both crops. The LCI results were utilized to perform impact assessment using software MiLCA-JEMAI version 1.1.2.5 for data processing.
stable productivity is lower than unstable productivity. Where as there is 4/5 part or 20 years of 25 years of its life cycle (oil palm and Jatropha curcas) lies on this condition. Therefore, appropriate calculation method is needed. In some journals, the calculation is only performed in the first five years. Annual GHG emission value, eutrophication, acidification and energy consumption for producing biodiesel from oil palm was found to be higher than that from jatropha.
For oil palm, the emission and energy consumption due to pre-harvest activity was higher compared to post harvest activity, while for jatropha, the post-harvest activity was higher than the pre-post-harvest one. The characteristics of GWP emission and energy consumption by biodiesel production from oil palm was higher than that from jatropha, both during unstable and stable productivity period. The emission and energy consumption from oil palm was dominated by pre-harvest activity due to the requirement of more intensive maintenance of the plant compared to that of jatropha.
The use of organic fertilizer is very influential in the reduction of GHG value impact in fertilization sub-process. It could reduce up to 96.2 % for oil palm and 76.8% for Jatropha curcas or for all life cycle could reduce up to 37.4 % for oil palm and 61.4% for Jatropha curcas. By scenario 5, using jatropha based biodiesel for electricity generation is still better than using other fossil fuel.
The energy input for production biodiesel from CPO is higher than CJCO as show by higher the NEB which is 146,948.08 and 39,334.79 for BDF from CPO and BDF from CJCO, respectively and by lower the RI value which is 0.162 and 0.270 for BDF from CPO and BDF from CJCO, respectively (result of the scenario 3). Scenario 3 is the best scenario which reflects real condition in Indonesia, in which GHG value before stable productivity is 2575.47 kg-CO2eq./ton-BDF for oil palm and 3057.74 kg-CO2eq./ton-BDF for Jatropha
curcas. When the productivity has reached stability, the GHG value is 1511.96 kg-CO2eq./ton-BDF for oil palm and 380.52 kg-CO2eq./ton-BDF for Jatropha
curcas. With if we compared to diesel fuel, CO2eq. emission is reduced up to
49.27% and 88.45% for BDF-CPO and BDF-CJCO, respectively.
RINGKASAN
KIMAN SIREGAR. Perbandingan Emisi dan Energi Produksi Biodiesel dari Kelapa Sawit (Elaeis guineensis) dan Jarak Pagar (Jatropha curcas L.)
Berdasarkan Kajian Siklus Hidup (LCA) di Indonesia. Dibimbing oleh
ARMANSYAH H. TAMBUNAN, ABDUL KOHAR IRWANTO, SONI SOLISTIA WIRAWAN dan TETSUYA ARAKI
Sektor energi memainkan peranan penting untuk Indonesia dalam mencapai tujuan pembangunan ekonominya. Indonesia masih sangat bergantung pada energi berbasis fosil, yang menyumbang lebih dari 90% campuran energinya (termasuk minyak, gas dan batubara). Biodiesel adalah salah satu dari biofuel yang dikembangkan dan digunakan secara intensif di Indonesia. Biodiesel dapat dihasilkan dari berbagai minyak tanaman, seperti minyak kelapa, jarak pagar, rapeseed, kacang kedelai, dan lain-lain. USA menghasilkan biodiesel dari kacang kedelai, negara-negara Eropa dari rapeseed, sementara Indonesia terutama dari minyak kelapa sawit. Saat ini, pertimbangan lingkungan menjadi isu yang paling penting dalam produksi biodiesel. Meskipun sumber energi ini dianggap sebagai karbon netral, jalur produksinya dapat memancarkan berbagai gas yang berbahaya ke lingkungan.
Negara-negara Eropa mengklaim bahwa produksi biodiesel dari minyak kelapa sawit memberikan kontribusi emisi karbon ke atmosfer sepanjang jalur produksinya. Selain itu, US EPA-NODA dan EU RED menyatakan bahwa biodiesel berbasis minyak kelapa sawit hanya dapat mengurangi emisi GWP 17% dan 19% dibandingkan dengan bahan bakar berbasis fosil. Mengingat bahwa persyaratan minimum US adalah 20% dan EU adalah 35%, maka minyak kelapa sawit dari Indonesia mengalami kesulitan untuk memasuki pasar global. Pendekatan ilmiah harus dilakukan oleh Indonesia untuk mengatasi masalah ini, tetapi saat ini Indonesia hanya memiliki beberapa publikasi ilmiah internasional mengenai permasalahan ini, sehingga perlu untuk menjawab permasalahan emisi pada kelapa sawit ini. Metode yang tepat untuk menganalisis masalah tersebut adalah melalui penilaian siklus hidup (LCA) yang sesuai dengan standar organisai internasional (ISO).
Penelitian ini adalah tentang penilaian komparatif siklus hidup produksi biodiesel dari minyak kelapa sawit dan jarak pagar yang diproduksi di Indonesia. Batasan kajian LCA untuk penelitian ini adalah dari buaian ke pintu gerbang, yang terdiri dari delapan tahapan sub-proses, dengan unit fungsional (FU) 1 ton bahan bakar biodiesel (BDF).
Analisis persediaan siklus hidup (LCI) dilakukan dengan menggunakan data yang dikumpulkan dari perkebunan kelapa sawit dan Pusat Induk Jarak Pagar Pakuwon Sukabumi yang terletak di bagian barat pulau Jawa di Indonesia. Data ini dijadikan sebagai sumber data utama pada kajian ini. Analisis juga dikelompokkan ke dalam tahap produksi tidak stabil dan tahap produksi stabil untuk mengakomodasi karakteristik pertumbuhan alami kedua tanaman tersebut. Hasil LCI digunakan untuk melakukan penilaian dampak dengan menggunakan perangkat lunak MiLCA-JEMAI versi 1.1.2.5 untuk pemrosesan data yang telah menggunakan basis data di Indonesia.
jarak pagar, hal ini juga diperlihatkan dengan nilai masukan material dan energi yang lebih besar pada kelapa sawit dibandingkan jarak pagar. Penggunaan agro-kimia, seperti pupuk, herbisida, insektisida dan pestisida, memberikan kontribusi signifikan terhadap nilai total GWP, yaitu sekitar 68,14% dan 37,56% untuk masing-masing minyak kelapa sawit dan jarak pagar. Karakteristik emisi dari kedua tanaman selama periode produksi tidak stabil ditemukan berbeda dengan produksi stabil. Perhitungan pada produksi stabil lebih rendah daripada produksi tidak stabil. Dimana 4/5 bagian atau 20 tahun dari 25 tahun total siklus kehidupan (kelapa sawit dan jarak pagar) terletak pada kondisi ini. Oleh karena itu, metode perhitungan yang tepat sangat diperlukan. Dalam beberapa jurnal, perhitungan hanya dilakukan di lima tahun pertama. Nilai emisi GRK, eutrophication, acidification dan konsumsi energi untuk memproduksi biodiesel dari minyak kelapa sawit ditemukan lebih tinggi dari jarak pagar.
Untuk kelapa sawit, nilai emisi dan konsumsi energi untuk kegiatan pra-panen lebih tinggi dibandingkan dengan kegiatan pasca pra-panen, sedangkan untuk jarak pagar, kegiatan pasca panen lebih tinggi daripada pra-panen. Karakteristik emisi pemanasan global dan konsumsi energi pada produksi biodiesel dari minyak kelapa sawit lebih tinggi dari jarak pagar, baik selama periode produksi tidak stabil maupun setelah stabil. Emisi dan konsumsi energi pada kelapa sawit yang dominan pada kegiatan pra-panen terjadi karena lebih intensifnya persyaratan pemeliharaan tanaman kelapa sawit dibandingkan tanaman jarak pagar.
Penggunaan pupuk organik ini sangat berpengaruh dalam pengurangan nilai GRK dalam proses tahapan pemupukan. Hal ini dapat mengurangi hingga 96,2% untuk kelapa sawit dan 76,8% untuk jarak pagar atau untuk semua siklus hidup dapat mengurangi hingga 37,4% untuk kelapa sawit dan 61,4% untuk jarak pagar. Dengan skenario 5, menggunakan biodiesel berbasis jarak pagar untuk pembangkit listrik tenaga diesel masih lebih baik daripada menggunakan bahan bakar fosil.
Energi masukan dalam produksi biodiesel dari CPO lebih tinggi daripada CJCO, hal ini ditunjukkan dengan tingginya nilai NEB yaitu 146.948,08 untuk CPO dan 39.334,79 untuk CJCO, serta rendahnya nilai RI yaitu 0,162 untuk CPO dan 0,270 untuk jarak pagar. Skenario 3 lebih mencerminkan kondisi riil Indonesia, dimana nilai GHG sebelum produksi stabil adalah 2575,47 kg-CO2eq./ton-BDF untuk kelapa sawit dan 3057,74 kg-CO2eq./ton-BDF untuk jarak
pagar, serta pada saat produksi stabil diperoleh nilai GHG sebesar 1511,96 kg-CO2eq./ton-BDF untuk kelapa sawit dan 380,52 kg-CO2eq./ton-BDF untuk jarak
pagar, dengan penurunan nilai emisi CO2eq. jika dibandingkan minyak diesel
(fosil) sebesar 49,27% untuk BDF-CPO dan 73,06% untuk BDF-CJCO.
© Copyright 2013 by IPB All rights reserved
1. No part or all of this dissertation may be exerpted without inclusion or mentioning the sources.
a. excerption only for research and educating use, writing for scientific papers, reporting, critical writing or reviewing of a problem.
b. exerption doesn’t inflict a financial loss in the paper interest of IPB
A Dissertation
Submitted in partial fulfillment of the requirements for the Degree of Doctor in Agricultural Engineering Sciences
COMPARISON OF EMISSION AND ENERGY FOR
BIODIESEL PRODUCTION FROM OIL PALM (Elaeis
guineensis) AND JATROPHA CURCAS (Jatropha curcas L.)
BASED ON LIFE CYCLE ASSESSMENT (LCA) IN
INDONESIA
KIMAN SIREGAR
THE GRADUATE SCHOOL
BOGOR AGRICULTURAL UNIVERSITY (IPB) BOGOR
The external assessor for closed examination are :
Dr.Ir.Arief Sabdo Yuwono, M.Sc Dr.Ir.Udin Hasanudin, M.T
The external assessor for open examination are :
Dissertation title : Comparison of Emission and Energy for Biodiesel Production from Oil Palm (Elaeis guineensis) And Jatropha Curcas (Jatropha curcas L.) Based On Life Cycle Assessment (LCA) in Indonesia
Name : Kiman Siregar
Student Number : F164090031
Approved by, Advisory Committee
Prof. Dr. Ir. Armansyah H. Tambunan Chairman
Dr. Ir. Abdul Kohar I, M.Sc Dr. Ir. Soni S.Wirawan, M.Eng Dr.Tetsuya Araki Member Member Member
Acknowledged by,
Chairman of Agricultural Engineering Dean of Graduate School Graduate Study Program
Dr. Ir. Wawan Hermawan, MS Dr. Ir. Dahrul Syah, MSc.Agr
PREFACE
Gratitude for His glory and greatness, author prays to Allah SWT for His grace and bless that let me to finish this draft dissertation.
For the completion of this draft dissertation I would like to express my most profound gratitude to Prof.Dr.Ir.Armansyah H.Tambunan as the chairman of the advisory committee and all members of advisory committee; Dr.Ir.Abdul Kohar Irwanto,M.Sc, Dr.Ir.Soni Solistia Wirawan,M.Eng, and Dr.Tetsuya Araki for all valuable assistance, support and their tireless and patient counsel. I also say many thanks to Dr.Ir.Arief Sabdo Yuwono,M.Sc and Dr.Ir.Udin Hasanudin,M.T over his willingness as the external assessor for close examination, and Dr.Ir.Prastowo,M.Eng and Dr.Ir.Dadan Kusdiana,M.Sc as the external assessor for open examination. Thanks the author gave to the Rector of Bogor Agricultural University (IPB), the Dean of The Graduate School of IPB, the Chairman of Agricultural Engineering Graduate Study Program, and all the lecturer and staff over all the facilities and assistance in studies and my research. The author also say thanks to the Rector of Syiah Kuala University (UNSYIAH), the Dean of Agricultural Faculty of UNSYIAH, the Chairman of Agricultural Engineering Department of UNSYIAH, and all lecturer of my friends in Agricultural Engineering Department of UNSYIAH.
Then, all of my friends in Heat and Mass Transfer of Laboratory (Mas Bayu R, Rosmeika, Agus Ginting, Christian, Angga, Pak Wahyudin, Mona, Tiara, Aliya, Deni, Tiara, and Ismi), Agricultural Engineering Science Study Program (2009, 2010, 2011, and 2012), and The Graduate School of Bogor Agricultural University (IPB).
Finally, I would like to dedicate this research work to my family, my wife (Sholihati,SP,M.Si), my sons (Farhan Dzaky Siregar, Kaysa Mahira Putri Siregar and Raja Putra Siregar “RPS”), specially for my father (Almarhum H.Nakman Siregar) and my mother (Hj.Mima Harahap), my brothers (Kakak Masnoun, Abang Mukmin, Nurleli, Masleni, Samriana, Herman, Marlina and Sadima) for their love, continuous encouragement and constant support in my life. The end of the authors hope may explain in what has been a writer of dissertations this could be beneficial for writer and in need of them.
Bogor, July 2013
Kiman Siregar
LIST OF CONTENTS
LIST OF TABLE xviii
LIST OF FIGURES xix
LIST OF NOMENCLATURE xxii
LIST OF ABBREVIATIONS xxiii
LIST OF APPENDICES xxiv
1 INTRODUCTION 1
Research Background 1
Problem Formulation 2
Research Objective 3
Research Benefits 3
Novelty 3
Research Boundaries 3
2 STATE OF THE ART OF LIFE CYCLE ASSESSMENT OF BIODIESEL 5
Introduction 5
Literature Review 5
Method 14
Results and Discussion 14
Conclusion 30
3 DATA INVENTORY 31
Introduction 31
Literature Review 32
Method 34
Results and Discussion 39
Conclusion 73
4 IMPACT ASSESSMENT 75
Introduction 75
Literatur Review 75
Method 77
Results and Discussion 81
Conclusion 101
5 CONSUMPTION OF ENERGY PRODUCTION, NET ENERGY BALANCE (NEB), NET ENERGY RATIO (NER), AND RENEWABLE INDEX (RI) 103
Introduction 103
Literature Review 103
Method 110
Results and Discussion 113
6 GENERAL DISCUSSION 129
Interpretation (ISO-14043) 129
Global Warming Potential (GWP) 129
Emission Reduction of CO2eq. Biodiesel vs Diesel Fossil 131
Acidification 136
Waste landfill volume 137
Eutrophication 137
Biodiesel Development and The Efforts on Reducing Global Warming
Emissions 141
7 CONCLUSION AND SUGGESTION 149
Conclusion 149
Recomendation 149
Suggestion 149
Acknowledgement 149
REFERENCES 150
APPENDICES 158
BIOGRAPHY 159
LIST OF TABLES
2.1. Composition of shell, kernel, and husk of Jatropha curcas oil
extraction (Trabi,1998) 7
2.2. Composition of fatty acid and physical characteristic of Jatropha
curcas (Banerji et al., 1985 in Ferry, 2009) 7
2.3. Biodiesel quality standard according to SN7182:2012 8 2.4. Properties of biodiesel derived from vegetable oil 10 2.5. Methyl ester properties of several fatty acid 11 2.6. Summary of emissions contained in air, liquid, and solid associated
with the production of crude palm oil (Chavalparit et al., 2010) 16 2.7. Total greenhouse gas emission generated from the production of 1
million liters biodiesel per day 16
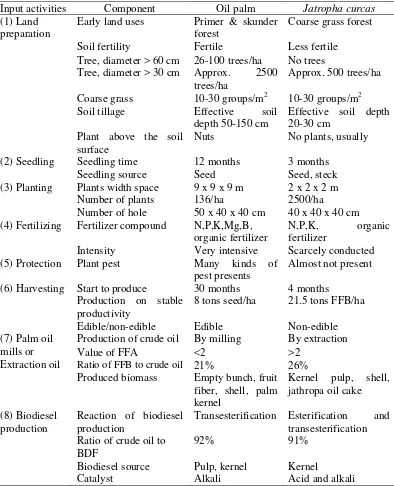
2.8. The need of fertilizer for palm oil in Indonesia 24 3.1. The detail description comparison of life cycle on biodiesel
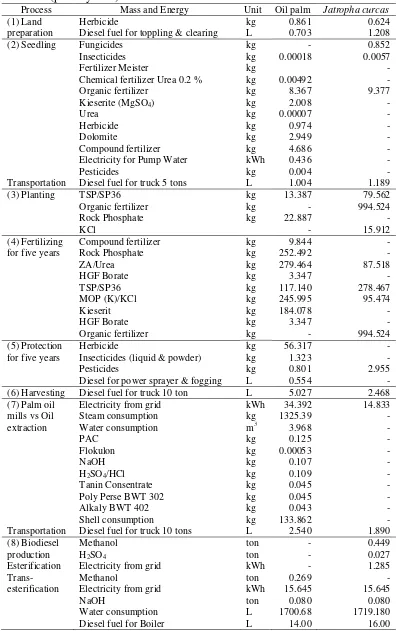
production from palm oil and CJCO with boundary cradle to gate 41 3.2. Mass and energy used for 1 ton BDF per ha per year from palm oil
in PTPN (Persero) VIII Unit Kebun Kertajaya and Jatropha curcas
in PIJP Balitri (primary data) 43
3.3. Mass and energy for 1 ton BDF per ha per year from CPO and CJCO during the first –fifth year (average value of secondary and primary
data) 44
3.4. Some characteristics of Crude Jatropha curcas Oil (CJCO) with
Crude Palm Oil (CPO) 45
3.5. Dose and type of seed fertilizer 48
3.7. Location requirements for Jatropha curcas plantation 63 3.8. Land clearing requirements for Jatropha curcas plantation 64
3.9. Seed requirement in KIJP 64
3.10. Jatropha fertilizer dosage (g/tree/year) 68
4.1. Characterization factors of atmospheric emission impacts 79 4.2. Environmental impacts for producing 1 ton BDF per ha per year
from CPO and CJCO (1-5years) 82
4.3. Percentage of GHG-100 years for LCA with boundary cradle to gate
at oil palm and Jatropha curcas 83
4.4. Impact evaluation for producting 1 ton BDF per ha per year from
CPO dan CJCO (1-5 year) 86
4.5. Percentage of GHG value for LCA with boundary cradle to gate for
BDF-CPO and BDF-CJCO 88
4.6. Electricity composition in Indonesia (Statistic from PT.PLN
(Persero), 2011) 91
4.7. Electricity composition in Japan (Widiyanto et al.,2003) 91 4.8. Impact assessment of power plant system (GHG emission,
acidification, eutrophication, waste landfill volume and energy
consumption) 94
4.9. Impact assessment of various types of fertilizers (GHG emission, acidification, eutrophication, waste landfill volume and energy
consumption) 95
4.10. Result of electrical composition in Indonesia for scenario 5 101 4.11. Impact assessment on GHG emission value of power plant system
for scenario 5 101
5.1. Calor value of some types of fuel 103
5.2. Energy input for phosphate and potassium fertilizer 104
5.3. Energy input for some types of fertilizers 104
5.4. Energy input for nitrogen fertilizer 104
5.5. Energy consumption percentage for LCA with boundary cradle to
gate on palm oil and Jatropha curcas 115
5.6. Percentage value of energy consumption in LCA of palm oil and
Jatropha curcas from cradle to gate 117
5.7. Result of LCIA for energy consumption (fossil fuel) by BDF-CPO in
year 6th 121
5.8. Result of LCIA for energy consumption (fossil fuel) by BDF-CJCO
in year 6th 121
5.9. Result of LCIA for energy consumption (non-renewable fuel) by
BDF-CPO in year 6th 122
5.10. Result of LCIA for energy consumption (non-renewable fuel) by
BDF-CJCO in year 6th 122
5.11. Result of LCIA for energy consumption (renewable fuel) by
BDF-CPO in year 6th 123
5.12. Result of LCIA for energy consumption (renewable fuel) by
BDF-CJCO in year 6th 123
5.13. Result of LCIA for energy consumption (all) by BDF-CPO in year
5.14. Result of LCIA for energy consumption (all) by BDF-CJCO in year
6th 124
5.15. The average value of NEB, NER and RI 125
5.16. HHV and LHV value based on the literature for CPO, CJCO, CPO based biodiesel, CJCO based biodiesel and diesel fuel 126 5.17. Heating value for some input materials in CPO and CJCO
production process 127
6.1. Result of LCIA for global warming potential (GWP) by BDF-CPO
in year 6th 132
6.2. Result of LCIA for global warming potential (GWP) by BDF-CJCO
in year 6th 132
6.3. Result of LCIA for acidification by BDF-CPO in year 6th 138 6.4. Result of LCIA for acidification by BDF-CJCO in year 6th 138 6.5. Result of LCIA for waste landfill volume by BDF-CPO in year 6th 139 6.6. Result of LCIA for waste landfill volume by BDF-CJCO in year 6th 139 6.7. Result of LCIA for eutrophication volume by BDF-CPO in year 6th 140 6.8. Result of LCIA for eutrophication volume by BDF-CJCO in year 6th 140 6.9. Suggestions for government policies for future development
regarding biodiesel production (general suggestions) and biodiesel production based on feedstock utilization of CPO and CJCO in the study (specific suggestions), in the terms potency, prospect, and
problem 143
6.10. Suggested actions for supporting and inhibiting factors and solutions for the biodiesel development (general suggestion) and biodiesel production from CPO and CJCO in Indonesia in the future (specific
suggestion) 146
LIST OF FIGURES
2.1. Molecule structure of several fatty acid 10
2.2. The influence of molecule structure towards cetane number 11
2.3. Four stages involved in LCA 12
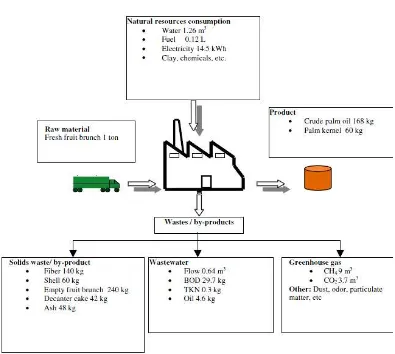
2.4. Average value and mass distribution of 1 ton palm oil FFB production and the amount of waste/emission in solid, liquid and air
waste 17
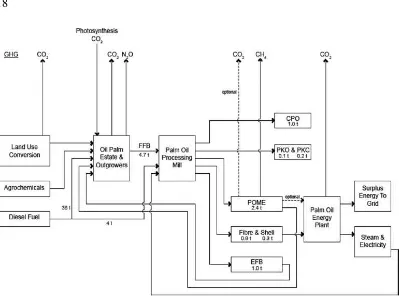
2.5. Mass distribution analysis of 1 ton CPO production and the analysis
of greenhouse gas emission using GWAPP model 18
2.6. Flow diagram of production process and water treatment in the
production of palm oil 27
2.7. Field condition of oil palm plantation 28
2.8. Marginal land condition before and after Jatropha curcas planting 29 3.1. Boundary used for biodiesel production from CPO and CJCO under
catalytic process 35
3.2. Life cycle assessment procedures used in this study 36 3.3. Material and energy balance scheme (input and output) of oil palm
processing starts from cultivation up to biodiesel production 37 3.4. Sub-process of biodiesel production using CPO under catalytic
3.5. Sub-process of biodiesel production using CJCO under catalytic
process 37
3.6. Flow diagram of energy, raw material, and emission/waste during
biodiesel processing from CPO 38
3.7. Flow diagram of energy, raw material, and emission/waste during
biodiesel processing from CJCO 38
3.8. Biodiesel production from CPO and CJCO per day during its life
cycle 42
3.9. Pictures of existing oil palm plantation 50
3.10. Block diagram of biodiesel production 53
3.11. Common biodiesel production flow diagram using vegetable
material 53
3.12. CPO-based biodiesel processing process under transesterification
reaction 54
3.13. Common CPO based biodiesel processing under two stages transesterification reaction in PT Adaro, Central Kalimantan 54
3.14. Sub unit of immersed coil heater 54
3.15. Sub unit of centrifuge 1 55
3.16. Sub unit of mixer 1 55
3.17. Sub unit of transesterification 1 56
3.18. 3D layout biodiesel milling plant with capacity of 500 liter/batch or about 1 ton per day in BRDST BPPT Puspitek Serpong 56
3.19. Sub unit of centrifuge 2 57
3.20. Mass balance flow under catalytic production process 57 3.21. Flow diagram of biodiesel process production in BRDST BPPT
Puspitek Serpong 58
3.22. Sub unit of transesterification 2 59
3.23. Sub unit of centrifuge 3 59
3.24. Sub unit of washing tank 60
3.25. Sub unit of decanter 60
3.26. Sub unit of evaporator 60
3.27. Sub unit of cooler 61
3.28. Sub unit of heater 61
3.29. Sub unit of distillation tray 62
3.30. Sub unit of condenser 62
3.31. Sub unit of reflux drum 62
3.32. Sub unit of reboiler 63
3.33. Weeds planted in Jatropha curcas area 68
3.34. Existing Jatropha curcas plantation in PT Adaro 68 3.35. Jatropha curcas oil extraction using hydraulic pressing 70 3.36. Jatropha curcas oil extraction using screw pressing 71 3.37. Oil extraction flow chart from Jatropha curcas beans under
combination method of twin screw press and solvent extraction 71 3.38. CJCO process under catalytic method in PT Adaro (esterification
and 2 stages transesterification) 72
3.39. Sub unit of esterification reactor 73
4.1. Calculation steps for this research 78
4.3. The total value of GHG emission for oil palm before stable
productivity (1-5 year) 83
4.4. The total value of GHG emission for Jatropha curcas before stable
productivity (1-5 year) 84
4.5. The value of GHG emission for oil palm and Jatropha curcas before
and after stable productivity (1-25 year) 84
4.6. The value of acidification for oil palm and Jatropha curcas before
and after stable productivity (1-25 year) 85
4.7. The value of eutrophication for oil palm and Jatropha curcas before
and after stable productivity (1-25 year) 85
4.8. The value of waste landfill volume for oil palm and Jatropha curcas
before and after stable productivity (1-25 year) 85 4.9. The total value of GHG emission on BDF-CPO before stable
productivity (1-5 year) 87
4.10. The total value of GHG emission on BDF-CJCO before stable
productivity (1-5 year) 88
4.11. The value of GHG emission for oil palm and Jatropha curcas before
and after stable productivity (1-25 year) 88
4.12. The value of acidification for oil palm and Jatropha curcas before
and after stable productivity (1-25 year) 89
4.13. The value of eutrophication for oil palm and Jatropha curcas before
and after stable productivity (1-25 year) 89
4.14. The value of waste landfill volume for oil palm and Jatropha curcas
before and after stable productivity (1-25 year) 89 4.15. The value of GHG emission for oil palm and Jatropha curcas
throughout its life cycle (1- 25 years) 92
4.16. The value of acidification for oil palm and Jatropha curcas
throughout its life cycle (1- 25 years) 92
4.17. The value of eutrophication for oil palm and Jatropha curcas
throughout its life cycle (1- 25 years) 92
4.18. The value of waste landfill volume for oil palm and Jatropha curcas
throughout its life cycle (1- 25 year) 93
4.19. Product system on oil palm of MiLCA-JEMAI software for the first,
second, and third year 96
4.20. Product system on oil palm of MiLCA-JEMAI software for the sixth
year (stable productivity) 97
4.21. Product system on Jatropha curcas of MiLCA-JEMAI software for
the first year 98
4.22. Product system on Jatropha curcas of MiLCA-JEMAI software for
the sixth year 99
5.1. The total value of energy consumption in oil palm before stable
productivity (1-5 year) 114
5.2. The total value of energy consumption in Jathropa curcas before
stable productivity (1-5 year) 114
5.3. The value of non-renewable energy consumption in oil palm and
Jatropha curcas before and after stable productivity (1-25 year) 115 5.4. The value of energy consumption for BDF-CPO before stable
5.5. The value of energy consumption for BDF-CJCO before stable
production (1-5 years) 116
5.6. The value of energy consumption for oil palm and Jatropha curcas
before and after stable production 116
5.7. The value of fossil energy consumption for oil palm and Jatropha
curcas before and after stable production 117
5.8. The value of non-renewable energy consumption for oil palm and
Jatropha curcas before and after stable production 117
5.9. Total renewable energy consumption value before and after stable
production for oil palm and Jatropha curcas 118
5.10. Total energy consumption value before and after stable production
for oil palm and Jatropha curcas 118
5.11. The value of NEB for BDF from CPO and CJCO throughout its life
cycle (1-25 years) 119
5.12. The value of NER for BDF from CPO and CJCO throughout its life
cycle (1-25 years) 120
5.13. The value of RI for BDF from CPO and CJCO throughout its life
cycle (1-25 years) 120
6.1. The reduction percentage of CO2 emission, before stable
productivity 131
6.2. The reduction values of CO2 emission after stable productivity 133
6.3. The total values of CO2 emission 133
6.4. The reduction percentage of CO2 emission, before stable
productivity 133
6.5. The reduction percentage of CO2 emission, after stable productivity 134
6.6. Total reduction percentage of CO2 emission (before and after stable
production) 134
6.7. The reduction percentage of CO2, before stable productivity (1-5
years) 135
6.8. The reduction percentage of CO2 emission, after stable productivity 135
6.9. Total reduction percentage of CO2 emission (before and after stable
production) (1-25 years) 135
6.10. The reduction percentage of CO2 emission, before stable
productivity (1-5 years) 136
6.11. The reduction percentage of CO2 emission, after stable productivity
(6-25 years) 136
6.12. Total reduction percentage of CO2 emission (before and after stable
production) (1-25 years) 136
LIST OF NOMENCLATURE
Bj : The value of the total system loadbj,i : The value of variable load j of sub-system i
D : Diameter of steam at 1.3 m height (m)
dijy : Potential impacts y due to emission compounds i in process j (kg y eq.)
CO : Carbon monoxide CO2 : Carbon dioxide
C : The composition of carbon in the fuel Es : Emission
Ebdf : Energy content of biodiesel fuel
Eff : Energy content of fossil fuel
Efo : Other fossils as a source of energy used during the entire production
cycle
GWP100 : Global warming potential, 100-year based
ej : The energy produced from energy source j in process k (kJ)
eq. : Equivalent
fij : The emission factor of substance i in condition k (kg/kJ)
eqiy : Equivalence value of potential impact y due to compound i (kg y eq./kg i)
H : Height of plant without leaves (m) Ha : Hectares
H2 : The composition of hydrogen in the fuel
H2O : The composition of water vapor in the fuel
H2 : The composition of hydrogen in the fuel
HVi : HV fatty acid of i HFC : Hydrofluourocarbons
hv : The heat of vaporization of water
mij : The mass of compound i (emission) of energy source/fuel j in process k
(kg)
N2O : Dinitrogen oxide
NF3 : Trifluoride nitrogen
NOx : Nitrous oxide
O2 : The composition of oxygen in the fuel
PFC : Perfluorocarbons
S : The composition of sulfur in the fuel SF6 : Sulfur hexafluoride
SF5CF3 : Trifluoromethyl sulfur pentafluoride
TFA : Total percentage of all fatty acid
Xi : Mass fraction of vegetable oil or biodiesel
x, y, z : Molecule number of carbon, hydrogen, and oxygen of chemical formula at each i component
xi : The mass or energy flow associated with the sub-system i
x : Age of plant (years)
yb : Above-soil biomass (tons / plant) ya : Palm roots biomass (tons/plant)
nH2O,out : The moles number of evaporated water
nfuel,in : The moles number of the combusted fuel
LIST OF ABBREVIATIONS
AD : Activity DataAPI : American Petroleum Institute EF : Emission Factor
BDF : Bio Diesel Fuel
BALITRI : Balai Tanaman Industri
C : Carbon
CPO : Crude Palm Oil
CJCO : Crude Jatropha Curcas Oil DF : Diesel Fuel
DESDM : Departemen Energi Sumber Daya Mineral
EFT : Empty Fruit Bunch
EGR : Exhaust Gas Recirculation EU : European Union
EPA : Environmental Protect Agency EMS : Environmental Management System FFB : Fresh Fruit Bunches
FAME : Fatty Acid Methyl Ester FFA : Free Fatty Acids
GWP : Global Warming Potential GHG : Greenhouse Gas
GAPKI : Gabungan Pengusaha Kelapa Sawit Indonesia
GRK : Gas Rumah Kaca
GPSA : Gas Processors Suppliers Association HHV : Higher Heating Value
HC : Hydrocarbons
HSD : Hight Speed Diesel Oil IV : Iodine Value
IDO : Intermediate Diesel Oil
ISO : International Standard Organization ISPO : Indonesia Sustainable Palm Oil
IPPC : Integrated Pollution Prevention and Control IPCC : Intergovernmental Panel on Climate Change IPOA : Indonesian Palm Oil Association
IPB : Institut Pertanian Bogor
ITB : Institut Teknologi Bandung
JME : Jatropha Methyl Ester JBD : Jatropha Bio Diesel
JEMAI : Japan Environmental Management Association for Industry JO : Jatropha Oil
KIJP : Kebun Induk Jarak Pagar
kW : Kilowatt kWh : Kilowatt-hour DJO : Diesel Jatropha Oil LHV : Lower Heating Value LCA : Life Cycle Assessment LCI : Life Cycle Inventory
LCIA : Life Cycle Impact Assessment LCC : Legume Cover Crops
MW : Molecular Weight MFO : Marine Fuel Oil
MiLCA : Multiple Interface Life Cycle Assessment Menristek : Menteri Riset dan Teknologi
NEB : Net Energy Balance NER : Net Energy Ratio
NGO : Non Government Organization NTT : Nusa Tenggara Timur
NTB : Nusa Tenggara Barat
PM : Particulate Matter
PTPN : Perusahaan Terbatas Perkebunan National
PLN : Pembangkit Listrik Nasional
PLTA : Pembangkit Listrik Tenaga Air
PLTP : Pembangkit Listrik Tenaga Panas Bumi
PLTB : Pembangkit Listrik Tenaga Biomassa
Pertamina : Perusahaan Pertambangan Minyak dan Gas Bumu Negara
PKS : Pabrik Kelapa Sawit
RI : Renewable Index
RED : Renewable Energy Directive
RSPO : Roundtable on Sustainable Palm Oil SPM : Solid Particulate Matter
SFC : Specific Fuel Consumption SV : Saponification Value TSP : Trisuperphosphate T : Transportation US : United State UK : United Kingdom
LIST OF APPENDICES
1 The series of activities research (from page 14) 159
2 Field survey documentations (from page 42) 160
3 Data of several large scales of palm oil based biodiesel mills in
Indonesia (from page 46) 162
4 The complete summary for Jatropha curcas and oil palm (from page 46) 164 5 FFB processing flow chart to produce CPO at palm oil milling plant in
PTPN Kebun Unit Kertajaya VIII (from page 52) 178
6 The mass and energy balance to produce CPO at palm oil milling plant in PTPN Kebun Unit Kertajaya VIII (from page 52) 179 7 The complete diagram flow of Jatropha curcas oil extraction method
using hydraulic presses. (from page 70) 180
8 The complete diagram flow of the pressing process using screw pressing
method. (from page 71) 183
9 How to operate of MiLCA software (from page 78) 184 10 Complete results of assessment using MiLCA-JEMAI software for oil
palm and Jatropha curcas (from page 91) 186
11 The running result of overall energy consumption (all) value for oil palm
and Jatropha curcas (from page 117) 192
1
CHAPTER I
INTRODUCTION
Research Background
A continuing development of renewable energy is particularly necessary for Indonesia, which is known as an agrarian country with abundance of natural resources. Energy sector plays an important role for Indonesia in achieving its economic development goal. Short (2002) in Ndong (2009) stated that sustainability of modern economy partly depends on the capacity of the countries to guarantee their energy supply (IEA, 2008). Indonesia is still heavily dependent on fossil based energy, which is accounted for more than 90% of its energy mix (including oil, gas and coal). The most reliable alternative for substitution of the fossil fuel is biofuel.
Biodiesel can be produced from various oil borne plants, such as palm oil,
Jatropha curcas, rapeseed, soybean, etc. Availability of the feedstock is one important consideration for effective production of biodiesel. Thereby, USA produced their biodiesel from soybean, Euoropean countries from rapeseed, while Indonesia mainly from palm oil.
Currently, environmental consideration becomes the most important issue in biodiesel production. Eventhough the source of the energy is considered as carbon neutral, the production path can emit various environmentally hazardous gasses. European countries claim that production of biodiesel from palm oil contributes carbon emission to atmosphere along its production path. Furthermore, EPA-NODA states that palm oil based biodiesel can only reduce GWP emission by 17% compared to fossil-fuel based. The minimum requirement to enter global market is 35%. This condition could make barrier to Indonesia as one of the world‟s largest CPO producer.
Sheehan et al. (1998) reported that biodiesel B100 from soybean will reduce CO2 emission by 78.45% compared to oil produced from fossil (fossil-fuel
based). In regard to this result, Indonesia should analyze the equilibrium balance between carbon emission produced from biodiesel utilization and its biodiesel production path. This analysis should be conducted for two kinds of oil borne plants i.e. oil palm and Jatropha curcas.
Scientific approach through Life Cycle Assessment (LCA) can be used as a tool to assess this issue. LCA has been widely used by America and Europe for other organic materials. Besides for emission analysis, LCA is also designed to analyse all aspects related with energy. LCA is a systematic process which comprises identification, measurement, and assessment of environmental impact caused by a product during its life cycle process or activity. LCA can be used to ensure that all environmental impacts has been considered for deciding action, calculating environmental impact that might occur, comparing process performance and developing data base for further research. In this regard, LCA can be used as a tool to support decision making on environmental improvement conducted by enterprise or government (Cowell, 1999).
2
qualification than others based on particular perspective (Searcy, 2000). The target of LCA is to compare the whole environmental damage caused by product or particular activity and then select one option which have the least damage risk. This step is incorporated in Life Cycle Impact Assessment (LCIA).
LCI is one of four stages of LCA which have important role to conduct the assessment. The result generated from LCA is highly influenced by the validity and sufficiency of data inventory of the object being assessed. In Indonesian case, the data access that can be used in this LCA study is very limited. Collecting data process is the main focus in analyzing the stock and the most time consuming among other process involved in LCA (Searcy, 2000). Number of LCA study on Indonesian biodiesel production come up with different result. This difference could be due to data inconsistency and did not present the actual condition found in the field.
Crude palm oil (CPO) is one kind of biologic resource that has been widely produced for biodiesel fuel, including Indonesia as the world main producer of palm oil. However, CPO is a food resource. This drives Indonesia to find another alternative source for biodiesel production. One promising source is
Jatropha curcas L. which is considered as non-edible industrial plant used for biodiesel fuel (Silitonga et al., 2011; Tambunan et al., 2012). Jatropha curcas
could be planted in marginal soil, semi dry climate, and suitable in tropical and subtropic climate. According to Kaushik et al. (2007) in Ndong et al. (2009),
Jatropha curcas contains 28 and 38% oil that can be changed into jatropha methyl ester (JME).
According to those aforementioned situations, an effort to address this issue should be conducted by identifying and presenting actual condition of Indonesian palm oil and Jatropha curcas estate. In this research, LCA is used to analyze the prospect of oil palm and Jatropha curcas development.
Problem Formulation
According to those aforementioned situations, scientific approach needs to be taken in order to answer the problem related with global warming emission and others environmental effect along its biodiesel production path from oil palm and
Jatropha curcas. Reducing emission value generated from oil palm and Jatropha curcas for biodiesel production is important to be determined in order to meet the standard of global market. The following questions have been formulated from the previous problem in systematic and structured study to provide good result:
1. What is the emission distribution for planting, harvesting and post-harvesting of palm oil and Jatropha curcas oil based biodiesel? Which stage has significant effect? What kind of material input is the most siqnificant increasing the global warming potential emission value?
2. How are the energy consumption, net energy balance, net energy ratio, and renewable index of biodiesel production from palm oil and Jatropha curcas
oil?
3 It is expected that the research could give solution and describe the net energy balance and net energy ratio for further development of biodiesel processing.
Research Objective
The objective of the research is to analyze and compare life cycle assessment (LCA) of oil palm and Jatropha curcas as feedstock for biodiesel in Indonesia with boundary from cradle to gate using data based found in Indonesia.
Research Benefits
The benefits of the research are as follow:
1. Provide information regarding the life cycle assessment of CPO and CJCO to produce biodiesel under catalytic reaction.
2. Provide recommendation to industrialist, government or institute about possible improvement of feedstock for biodiesel production.
Novelty
Novelty of this research are as follows :
1. This is the first comparative study of oil palm and Jatropha curcas by assessing their life cycle in two phases, namely unstable productivity (1-5 years) and stable productivity (6-25 years)
2. This research comprehensively study the life cycle energy consumption of biodiesel production in terms of net energy balance (NEB), net energy ratio (NER), and renewable index (RI).
Research Boundaries
LCA is a life cycle assessment of a product from its existence until its extinction. However, in regard with the limitation of data, time and accessibility, and the objective, this research is limited to these conditions :
1. This study is branded with “cradle to gate” life cycle assessment, which is from land preparation up to the biodiesel production.
2. The data used for analysis with in the range of seed preparation to harvesting is secondary data from numerous sources, which presents the typical Indonesian oil palm and Jatropha curcas plantation activity.
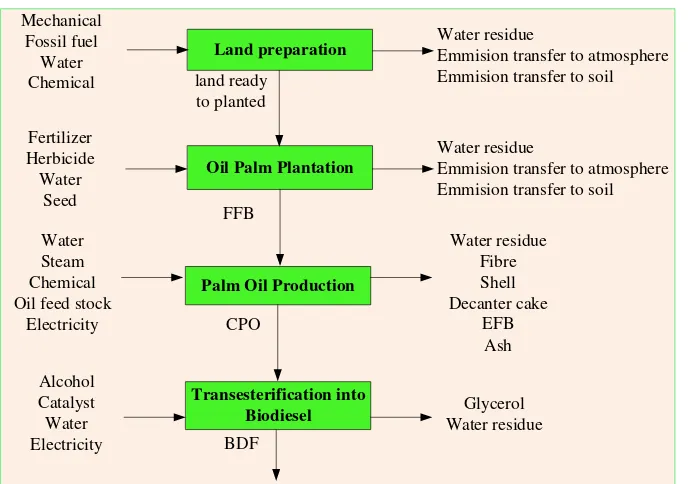
3. The biodiesel production from palm oil and Jatropha curcas oil involve some processing activities from land preparation, seedling, planting, fertilizing, protection, harvesting, extraction crude oil, and biodiesel production. The biodiesel production is processed under catalytic reaction.
4. Emission analysis is performed for air emission, liquid waste and solid waste. 5. Impact analysis is carried out to analyze the global warming potential (GWP),
5
CHAPTER 2
STATE OF THE ART OF
LIFE CYCLE ASSESSMENT OF BIODIESEL
Introduction
In the late of 1990s, the International Organization for Standardization (ISO) published ISO 14040 as a part of ISO 14000 which describes the procedures of Life Cycle Assessment (LCA) as an environment management standard. In agricultural sector, LCA is not only used to improve the efficiency and reduce environmental effect during cultivation process but also used to analyze the utilization of biomass energy as an alternative energy to substitute fossil energy. The purpose of LCA application in agricultural sector is: (i) as an indicator of efficient and comprehensive energy utilization, (ii) to evaluate the energy availability for production activity, (iii) to calculate the mass equilibrium of released carbon dioxide. Helleret al., 2007 also mentioned that LCA can be used to (i) calculate the environmental emission amount transferred into air, water and soil from agriculture and transportation activities, (ii) calculate the amount of energy used at each stage of agricultural processes, (iii) develop alternative evaluation system model in term of managerial, energy conversion and decision making in agricultural sector policy.
This ISO standard provides guidance for organization on design and use of environment performance evaluation. Environment performance evaluation can be definitely applied by all organization no matter what it kinds, sizes, locations and complexity. This standard is not entitled to determine the level of environment performance or certification purpose. There are five delimitations used by researcher in conducting LCA, i.e.: (1) cradle to grave, (2) cradle to gate, (3) cradle to cradle, (4) well to wheel, and (5) gate to gate.
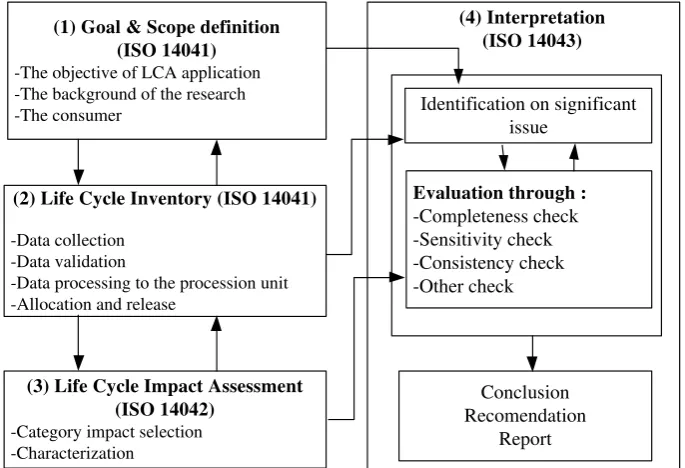
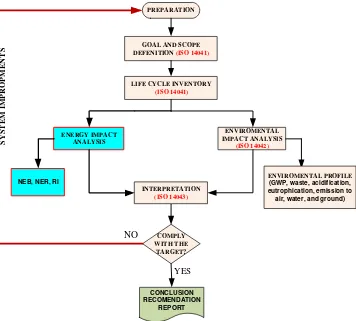
LCA is carried out in four distinct phases, i.e.: (1) goal and scope, (2) life cycle inventory, (3) life cycle impact assessment, (4) interpretation. Each phase is then described at different ISO standards, i.e.: (1) ISO 14040: Principles and framework, (2) ISO 14041: Goal and scope definition and inventory analysis, (3) ISO 14042: Life cycle impact assessment, (4) ISO 14043: Interpretation.
The objective of this chapter is to assess the development of life cycle assessment research that has been conducted by the world and Indonesia in accordance with the development of biodiesel from CPO and CJCO.
Literature Review Feedstock of Biodiesel
There are numerous oil borne plants that have been used to produce biodiesel such as rapeseed oil (canola) in Europe, soybean oil in USA, coconut oil in Philippines, and oil palm (Malaysia and Indonesia). In Hawai, used-frying oil has been used by Pasific Biodiesel Inc. with capacity as much as small-production factory (40 ton/month). In Nagano (Japan), 60 fast-food restaurants use their waste for biodiesel feedstock.
6
Oil (CPO) and Crude Jatropha curcas Oil (CJCO), both of them are easily found in Indonesia.
Crude Palm Oil (CPO)
Biodiesel from palm oil, kernel oil, and coconut oil has satisfied the required cetane number and cloud point based on SNI standard (maximum 18 oC). However, the oil needs additional treatments if it is going to be used (or exported) to subtropical countries. The additional treatments are: adding additive to reduce cloud point, or mixing palm biodiesel/palm-kernel/coconut with very high iodine-value fatty acid methyl ester in order to produce 70-100-iodine-iodine-valued biodiesel or higher, mixing with raw material oil before converting into biodiesel; the example of high iodine-valued oil is rubber seed oil (Hevea brasiliensis, I. V= 132 – 141), candlenut oil (Aleurites moluccana, I. V= 136 – 167), and tobacco kernel oil (Nicotiana Tabacum, I. V. = 129 – 142) (Eckey, 1954).
Crude Jatropha curcas Oil (CJCO)
Jatropha curcas L. fruit is commonly spherical in shape with the average size of its seed is 18 x 11 x 9 mm, 0.62 gram weight, composed by 58.1% fruit kernel and 41.9% fruit shell. The husk can be utilized for fertilizer as it contains potassium and phosphate compound. However, the husk is poisonous due to the existing of curcin, therefore it should be processed before applied to animal. Extract ether exists as much as 0.8% in fruit shell and oil content in fruit kernel is 54.2% or around 31.5% of the total fruit weight. Fatty acid found in oil consists of 22.7% saturated fatty acid and 77.3% unsaturated fatty acid. Jatropha curcas oil is yellow transparent liquid and able to be stored for a long period of time without experiencing color change. Table 2.1 shows composition of shell, kernel, and husk from Jatropha curcas oil extraction. Table 2.2 shows composition of fatty acid and physical characteristic of Jatropha curcas.
Biodiesel Production
Transesterification reaction using short-chain alcohol; methanol and ethanol, is the simplest chemical modification process in order to convert raw vegetable oil to fuel oil with lower molar mass. It contains almost similar viscosity with diesel oil, and high cetane number. This high cetane number expresses an indicator for good biodiesel quality. The process produces fatty acids alkyl ester (or biodiesel alkyl ester) as the main product and glycerin as valuable by-product which is easily separated from the main product.
Biodiesel is easily used due to its characteristic i.e. miscible, similar physical characteristics with diesel oil, biodegradable, ten times less toxic compared to common diesel oil, higher cetane number, colorless exhaust gas, and less sulphur or aromatic compound content. The similar physical characterisitic with diesel oil makes biodiesel can be directly applied in existing diesel engines without further modification. Less sulphur content in biodiesel results zero CO2
emission so it eventually could reduce the effect of global warming.
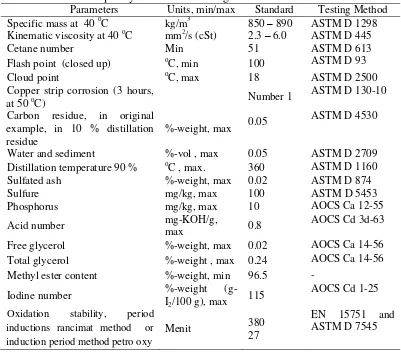
7 employed in certain market area. Table 2.3 displays bioodiesel quality standard according to Indonesian government.
Table 2.1 Composition of shell, kernel, and husk of Jatropha curcas oil extraction (Trabi et al.,1999)
Materials Fruit shell Fruit kernel Fruit husk Dry material (%) 89.8 – 90.4 94.2 – 96.9 100
Component (%-weight dry)
Crude protein 4.3 – 4.5 22.2 – 27.2 56.4 – 63.8
Lipid 0.5 – 1.4 56.8 – 58.4 1.0 – 1.5
Ash 2.8 – 6.1 3.6 – 4.3 9.6 – 10.4
Neutral detergent fiber 83.9 – 89.4 3.5 – 3.8 8.1 – 9.1 Acid detergent fiber 74.6 – 78.3 2.4 – 3.0 5.7 – 7.0 Lignin acid detergent 45.1 – 47.5 0.0 – 0.2 0.1 – 0.4 High heating value (MJ/kg) 19.3 – 19.5 30.5 – 31.1 18.0 – 18.3
Table 2.2 Composition of fatty acid and physical characteristic of Jatropha curcas
(Banerji et al., 1985 in Ferry,2009)
Fatty acid Jatropha curcas Attribute Jatropha curcas
Miristat (14:0) 0 – 0.1 Oil content 48 – 58 Palmitat (16:0) 14.1 – 21.8 Density (25oC) 0.91 – 0.93 Stearat (18:0) 3.7 – 9.8 Bias index (30oC) 1.465 Arakhidat (20:0) 0 – 0.3 Iodium number 97 – 102 Behenat (22:0) 0 – 0.2 Saponification
number 195.0
Palmitoleat (16:1) 0 – 1.3 Calor value, MJ/kg 39.6 – 41.8 Oleat (18:1) 34.3 – 49.0 Calor value, MJ/ltr 43.0 – 45.4 Linoleic (18:2) 27.2 – 44.2
Linolenat (18:3) 0 – 0.3
Catalyst and non-catalyst are two methods that have been applied in biodiesel production. Stoichiometry equation for triglyceride transesterification with methanol is shown below:
8
Reaction can take place without catalyst but it is time consuming. Catalyst is classified into 3 types, i.e. alkaline, acid and enzyme (Lotero et al., 2005; Liu et al., 2006; Fukuda et al., 2001).
Table 2.3 Biodiesel quality standard according to SNI 7182:2012
Parameters Units, min/max Standard Testing Method
Specific mass at 40 oC kg/m3 850 – 890 ASTM D 1298
Kinematic viscosity at 40 oC mm2/s (cSt) 2.3 – 6.0 ASTM D 445
Cetane number Min 51 ASTM D 613
Flash point (closed up) oC, min 100 ASTM D 93
Cloud point oC, max 18 ASTM D 2500
Copper strip corrosion (3 hours,
at 50 oC) Number 1
ASTM D 130-10
Carbon residue, in original example, in 10 % distillation residue
%-weight, max 0.05
ASTM D 4530
Water and sediment %-vol , max 0.05 ASTM D 2709
Distillation temperature 90 % oC , max. 360 ASTM D 1160
Sulfated ash %-weight, max 0.02 ASTM D 874
Sulfure mg/kg, max 100 ASTM D 5453
Phosphorus mg/kg, max 10 AOCS Ca 12-55
Acid number mg-KOH/g,
max 0.8
AOCS Cd 3d-63
Free glycerol %-weight, max 0.02 AOCS Ca 14-56
Total glycerol %-weight , max 0.24 AOCS Ca 14-56
Methyl ester content %-weight, min 96.5
-Iodine number %-weight
(g-I2/100 g), max 115
AOCS Cd 1-25
Oxidation stability, period
inductions rancimat method or induction period method petro oxy
Menit 380
27
EN 15751 and ASTM D 7545
The shortest reaction time occurs when using alkaline catalyst. Therefore, it has been widely used for biodiesel processing. Metanolosis reaction occurs at three phases as follow:
The most commonly used of alkaline catalyst for transesterification process is sodium hydroxide, potassium hydroxide, sodium methylate (metoxide), and potassium methylate. The real catalyst for reaction is methylate ion (methoxide), but when hydroxide is used, the equilibrium reaction is:
9 Mechanism reaction from fatty acid methyl ester in each catalyst cycle is defined below (similar mechanism occurs under convertion of diglyceride into monoglyceride and monoglyceride into glycerol):
Using alkaline catalyst, reaction takes place in short time and requires relatively low reaction temperature (methanol boiling point is 65oC) (Formo, 1954 in Tatang, 2006). Therefore, most of industrial/commercial processes operate in the specified temperature range and atmospheric pressure. The amount of catalyst used is about 0.5-1.5 percent of total oil weight.
Free fatty acid content in vegetable oil determines the process that will be usedby vegetable oil with low free fatty acid content (<2%) such as virgin palm oil whether it can be processed directly with transesterification method. However, if free fatty acid is relatively high (>2%) for example crude castor oil, esterification process needs to determine acid number/FFA content (acid value/mgKOH/g-oil). The difference between transesterification and esterification process is in catalyst which involved in reaction. The purpose of esterification process is to reduce free fatty acid content then convert the oil into FAME (Fatty Acid Methyl Ester). Using this process, the failure in biodiesel production during transesterification process can be diminished. High FFA content (without esterification) will deactivate alkaline catalyst that results non-optimum triglyceride conversion to biodiesel.
The properties such as cetane number, iodine value, and cloud point of biodiesel are categorized as ‟total netto‟ of similar properties in fatty acids methyl ester. Table 2.4 shows some of fuel properties of vegetable oil-based biodiesel. From the table, it can be seen that biodiesel viscosity closes enough with diesel oil‟s viscosity. The cetane number of biodiesel is regarded higher than diesel oil.
Biodiesel/fatty acids methyl ester (iodine value = 0), except methyl ester caprilat and caprat, tends to have high cetane number but relatively have high
10
melting point (for virgin fatty acids methyl ester, melting point pour point), whereas biodiesel cloud point is 3 – 5 oC higher than its pour point. Commonly, fatty acid methyl ester has specific mass at 40 oC (except ester arachide) and kinematic velocity value at 40 oC (except ester caprilat, caprat, and erusat) in required range of biodiesel.
Table 2.4 Properties of biodiesel derived from vegetable oil Biodiesel/
Ester Metil
Density 15oC, kg/liter
Visk. kinem. 40 oC, cSt
Hc, MJ/liter
Cetane number
CFPP,
o
C.
Iodium number, g-I2/(100 g)
Coconut 0.869 2.70 30.80 63 8.0 10
Palm oil 0.874 4.40 32.40 63 16.0 52
Frying oil 0.880 4.20 32.80 49 -5 – +8 60 – 120
Castor 0.879 4.20 32.80 51 95 – 106
Kanola 0.882 4.20 32.80 49 -12 114
Sunflower 0.885 4.00 32.80 47 -4 129
Soybean 0.885 4.05 33.50 46 -4 131
Linseed 0.891 3.70 33.00 53 183
Jatropha curcas* 0.879 4.84 38.50 51 6 - +8 77.81
Diesel No. 2 0.840 2.70 37.08 47.0 -15.0 -33.0
Sources : Mittelbach M, “15 Years of Biodiesel Experience in Europe, ”page 132 – 136 in Gübitz GM, Mittelbach M and Trabi, “Biofuels and Industrial Products from Jatropha curcas”, Dbv-Verlag für die Technische Universität Graz, Graz, Austria, 1997; Mittelbach M and Remschmidt C, “Biodiesel : The Comprehensive Handbook”, Martin Mittelbach Publisher, Graz, Austria, 2004.* Gubitz et al., 1999; Hanumantha Rao et al.,2009 in Silitonga et al.,2011.
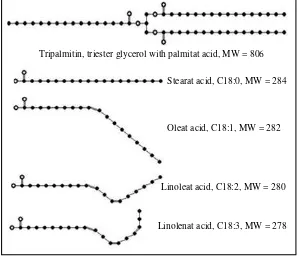
Figure 2.1 Molecule structure of several fatty acid
Tripalmitin, triester glycerol with palmitat acid, MW = 806
Stearat acid, C18:0, MW = 284
Oleat acid, C18:1, MW = 282
Linoleat acid, C18:2, MW = 280
11 Fatty oil derived from vegetable or animal is mainly composed of triglyceride, which is trimester glycerol with fatty acids (C8-C24). Triglyceride is a branched-chain molecule and has high molar mass (600 – 900). Hence, less saturated fatty oil, results higher iodine value and lower cetane number. Figure 2.1 shows molecule structure of several fatty acids. The influence of molecule structure towards cetane number is depicted in Figure 2.2. It can be seen from the figure that many branches will result low cetane number.
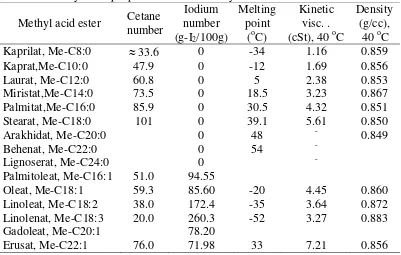
Oleat acid methyl ester (iodine value = 85.60) has optimal characteristic i.e. kinematic viscosity and specific mass are in the range of biodiesel standard, cetane number is relatively high and melting point is low enough for the use in cold climate areas. Table 2.5 summarizes methyl ester properties of several fatty acids.
Figure 2.2 The influence of molecule structure towards cetane number Table 2.5 Methyl ester properties of several fatty acid
Methyl acid ester Cetane number
Iodium number (g-I2/100g)
Melting point
(oC)
Kinetic visc. . (cSt), 40 oC
Density (g/cc),
40 oC
Kaprilat, Me-C8:0 33.6 0 -34 1.16 0.859
Kaprat,Me-C10:0 47.9 0 -12 1.69 0.856
Laurat, Me-C12:0 60.8 0 5 2.38 0.853
Miristat,Me-C14:0 73.5 0 18.5 3.23 0.867
Palmitat,Me-C16:0 85.9 0 30.5 4.32 0.851
Stearat, Me-C18:0 101 0 39.1 5.61 0.850
Arakhidat, Me-C20:0 0 48 - 0.849
Behenat, Me-C22:0 0 54 -
Lignoserat, Me-C24:0 0 -
Palmitoleat, Me-C16:1 51.0 94.55
Oleat, Me-C18:1 59.3 85.60 -20 4.45 0.860
Linoleat, Me-C18:2 38.0 172.4 -35 3.64 0.872
Linolenat, Me-C18:3 20.0 260.3 -52 3.27 0.883
Gadoleat, Me-C20:1 78.20
Erusat, Me-C22:1 76.0 71.98 33 7.21 0.856
Heksadekana, cetane number = 100
2,2,4,4,6,8,8-Heptametilnonana, cetane number = 15
12
The composition of fatty acid in vegetable oil depends on the plant. This composition determines cetane number, iodine numer, and cloud point. Cetane number is the benchmark of „immediate ignition‟ of an engine fuel/diesel motor. Molecule shape/structure of the compound gives effect to cetane number and fuel viscosity. Parafine/alkana that composed diesel fuel is in the range of C13-C17 However, in certain cases, different environmental scope needs different approaches. The objectives are usually concern on the implementation of LCA, the reasons of a research, and what type of the beneficiaries. The scope usually concerns on: function of the system, functional unit and reference flow, definition of a system and delimitation of initial system, description of data category, and criteria for inclusion, and input-output. It includes quality of data requirement, allocation procedure which will be used, impact and assessment methodology, also assumption and analytical constrains.
Figure 2.3 Four stages involved in LCA
Life Cycle Inventory (LCI)
LCI involves data collection of environmental burden that is needed to fulfill the objective of the research. Environmental burdenis determined by the raw material and energy used in a system as well as emission released by liquid waste and solid waste into the environment. The system has several stages such as: making flow diagram process, unit process description, data collection, calculating energy utilization process, and data validation. Data is associated with
(1) Goal & Scope definition (ISO 14041) -The objective of LCA application -The background of the research -The consumer
(3) Life Cycle Impact Assessment (ISO 14042)
-Category impact selection -Characterization
(2) Life Cycle Inventory (ISO 14041)
-Data collection -Data validation
13 process unit being studied. The data of life cycle is collected and measured in unit function e.g.: material input and product energy; waste; and gas, water, and soil emission (Cowell, 1999). The process of inventory analysis follows the fundamental of knowledge and engineering, focuses on energy and material balance at each element in the system (Curran, 1996 in Searcy, 2000).
Data collection process is the main focus in inventory analysis and the most time-consuming stage of all LCA process (Jensen et al., 1998 in Searcy, 2000). According to Ciambrone (1997), Life Cycle Assessment considers 5 types of output, i.e.: gas emission, liquid waste, solid waste, product, and by-product.
Life Cycle Impact Assessment (LCIA)
LCIA is the third stage of LCA. The main objective of LCIA is to interprete the environmental burden which has been quantified in LCI stages. The stages in LCIA are (U.S. Environmental Protection Agency and Science Application International Corporation, 2001):
1) Selection and definition of impact category: identifying relevant impact category related to the process (for example global warming, acidification, and eutrophication).
2) Classification: input and output data obtained from inventory analysis are classified and assigned to spesific impact category (for example: classifying CO2 emission in regard to its global warming)
3) Characterization: developing assessment model of environmental impact based on impact category using science-based conversion factors (for example: modeling the potential impact from CO2 and methane (CH4) on global
warming).
4) Normalization: comparing the result of impact indicator with the defined standard.
5) Grouping: grouping impact indicator result (for example: grouping indicator according to area: local, regional, and global).
6) Scoring: emphasizing the most important potential impact.
The first three steps are mandatory for an LCIA. The other steps are optional. Impact category selection, category indicators, and LCIA models must be consistent with the goal and scope of LCA and must reflect environmental issues of observed system. Classifications involve aggregation of environmental burden to a small number of environmental impact categories which will demonstrate their impacts on human health, ecological health, and resource depletion. In this step, existed environmental burdensare calculated and analyzed. It will be interpreted in the form of potential impacts. This step aims to express the potential impacts in the form of analysis which is useful as the research outputs and is understood by users. Impact analysis types are grouped by considering degradation of abiotic and biotic resource, global warming, acidification, eutrophication, and toxicity level (Cowell, 1999).
Interpretation