ISSN: 1693-6930, accredited by DIKTI, Decree No: 58/DIKTI/Kep/2013
DOI:10.12928/TELKOMNIKA.v14i1.2469 778
Identification of Tuna and Mackerel Based on DNA
Barcodes using Support Vector Machine
Mulyati*1, Wisnu Ananta Kusuma2, Mala Nurilmala3 1,2
Department of Computer Science, faculty mathematics and natural science, Bogor Agriculture University, Indonesia
3
Department of Aquatic Product Technology, Faculty of Fisheries and Marine Science, Bogor Agricultural University, Indonesia
Jl. Meranti, Wing 20 Level 5, Darmaga, Bogor 16680 Telp./Fax.: +62-251-8625584.
*Corresponding author, e-mail: [email protected], [email protected], [email protected]
Abstract
Tuna and mackerel are important fish in Indonesia that have great demand in the community and contain good nutrients for health. Many of the processed products have been faked including processed fish, by replacing the content of products that have high sales value to other lower price one. For ensuring food safety, fraudulent should be prevented by identifying the content of refined product. In this research, we implemented support vector machine (SVM), one of the popular methods in machine learning, to yield a model for identifying the content of refined product based on DNA barcode sequences. The feature extraction of DNA barcode Sequences was conducted by calculating k-mers frequency of each sequences. In this study, we used trinucleotide (3-mers) and tetranucleotide (4-mers). These features were inputted to SVM to classify and identify whether the DNA barcode sequences belong to the class of tuna, mackerel, or other fish. The evaluation results showed model SVM was able to perform identification with the accuracy 88%.
.
Keywords: DNA Barcode, food safety, machine learning, support vector machine
Copyright©2016 Universitas Ahmad Dahlan. All rights reserved.
1. Introduction
The fisheries sector is one of the important sectors that should be developed in order to compete in the global competition. To be able compete and expand export markets, it is needed to ensure that the fishery products have nutritional value and safe to be consumed. The existence of free trade between ASEAN countries which will take effect in December 2015 will lead to many products coming from different countries, so we must have the ability to track (traceability) the product for safekeeping. Many of the processed products have been faked; by replacing the content of products that have high sales value to other lower price one [1]. One of fishery products prone to be faked and has high interest in the community is a processed product made from fish, especially tuna and mackerel.
DNA Barcode-based method can detect the authenticity of a product in the form of fresh raw materials [5] as well as products which have undergone processing and freezing [6]. This method can also be applied to the content of different foods [7]. DNA barcodes is a short sequence taken from the genome of an organism [8]. Genes that widely used as a marker barcode is from protein coding genes among others Cytochrome Oxidase 1 (co1) and Cytochrome b (cyt b) which is a fragment of mitochondria.
DNA barcode-based identification can be done through two approaches, based on homology and composition [9]. Homology approach is by finding alignment that compares the juxtaposition of fragments of DNA sequences with reference sequences contained in the data base used, for example, the National Center for Biotechnology Information (NCBI) and Barcode of Life Database (BOLD) and the results are summarized at each level of the taxonomy. Several studies have been conducted with the approach of homology such as, Benedict et al., (2013) [10]. This research was conducted on the frozenS. tawilis,bluefin tuna fillet,sashimi tuna fillet, frozen shrimp using PCR amplification. The result showed that a high probability of incorrect species declaration in the “tawilis” and “Bluefin“. Tuna fillet and insufficient are labelled information for gindara steaks/fillets. However, sashimi tuna fillets and cream dory products are correctly labeled. Lowensteinet al., (2009) [11] also conducted research on the identification of tuna sushi. Research results shown that with a character-based and BLAST is able to identify the tuna up to 100%.
The composition approach is to do the calculations based the frequency characteristics appearing from base pairs that make up DNA sequence. This composition approach does not need to perform the alignment of each DNA sequences so that the time required is faster. Characteristic frequency calculation can be done by using k-mers. K-mers technique has been used to extract DNA features by Karlin and Burge in 1995 [12], and since that time the technique is used widely with the varying length ofk, the greater value ofkis the more accurate classification results [13]. Results from extraction of the next feature will be the input vector for classification and identification. Some related research have been done among others by Weitschek et al., (2014) [14] by using a supervised learning classification (Support Vector Machine (SVM), Naïve Bayes, RIPPER and C4.5). Research results show that SVM classification method is better than others. Seo (2010) [15] have also been conducting research on the classification of nucleotide sequences using SVM, the results obtained that the SVM has successfully identified the location of a specific pattern on the species. Therefore, in this research SVM is used as a classifier and feature extraction k-mers as an identifier.
The aim of this research is to identify tuna and mackerel based DNA barcode sequences by using SVM as a classifier and frequency of k-mers as identifier. This study identifies based on the level of species.
2. Research Method 2.1. Data Set
The data used in this research are sequences DNA Barcode tuna, mackerel and others fish (Table 1). The data is taken from the BOLD (http: boldsystems.org), BOLD are an informatics workbench that helps the acquisition, storage, analysis and publication of DNA barcode records [16]. Barcode DNA data is represented as a string with the format FASTA form.
2.2. Features Extraction
Training and testing data will be used at first by extraction Features. Feature extraction method used is k-mers. Extraction of k-mers will form the composition according to the amount of data used. Appearance of patterns of k in sequences is calculated by using the four main bases (A, C, G, and T) it is raised to a series of base pairs that will be used (Appearance pattern: 4 ^ k, with k ≥ 1) [17] the k use in this study are trinucleotide (3-mers) and tetranucleotide (4-mers).
2.3. Data Normalization
Normalization = (values x) / (length sequences) (1)
The value of x is the result of feature extraction using k-mers.
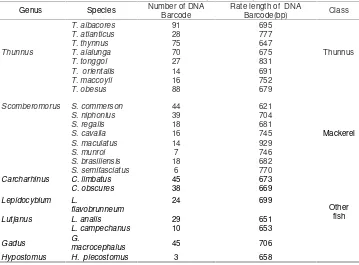
Table 1. The data DNA barcode Tuna, Mackerel, and other fish
Genus Species Number of DNA Hypostomus H. plecostomus 3 658
2.4. SVM Training and Testing
Training data that has been extracted by k-mers will be then performed by SVM training. SVM will find for the best model that can separate the classes. SVM used is from R programming language which available on the library e1071. This SVM training is using radial basis function kernel (RBF) and C-classification. Optimization parameters C and γ using a grid search with 10 cross validation in the range of 10-6– 10-1for the parameter γ and 10-1– 102 for parameter C. The choice of parameters determines the performance of classifiers [19] and the classification results [20].
Model obtained from the training will be tested using test data downloaded from BOLD and Lab FPIK IPB. Testing will identify the test data into their respective classes.
2.5. Analysis
Based on the results of SVM training and testing, the results obtained are then used to analyze the performance of SVM. In the analysis phase will be calculated the accuracy, sensitivity, specificity, and Fmeasure Based on Confusion Matrix table, as shown in Table 2. Each will be calculated by using the formula (2), (3), (4), (5) and (6).
Tabel 2. Confusion Matrix
Prediction class
Positive Negative
Actual class Positive A: True Positive B : False Negative
Negative C: False Positive D : True Negative
= (3)
= (4)
= (5)
= (6)
3. Results and Analysis
This study has used 765 Barcode DNA data sequence which consists of 409 DNA sequences tuna and 194 DNA sequences of other fish. For the testing data, data used is 145 DNA sequences which consists of four tuna species namely Thunnus alalunga, Thunnus albacores, Thunnus obesus, and Thunnus thynnus, and other fish 32 DNA sequences which consists of speciesCarcharhinus limbatus, Gadus macrocephalus, Hypostomus plecostomus.
Confusion matrix is used to evaluate the results of the identification of the data by using frequency trinucleotide and tetranucleotide. To measure the ability of SVM to identify DNA barcode sequences in three separate classes by using sensitivity and specificity. Sensitivity is a comparison of the true fish was identified to the total number of actual fish. Specificity is comparison of the wrong fish that successfully identified correctly. The value of precision and recall are used to measure the ability of SVM in identifying one class only, in this case the tuna, mackerel, or any class other fish. Fmeasure is matrix that integrates precision and recall.
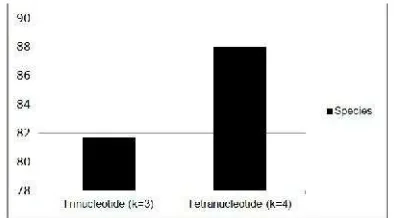
Figure 1. The value of accuracy using trinucleotide and Tetranucleotide
Figure 1 shows the accuracy the data by using trinucleotide and tetranucleotide. The value of accuracy obtained by using tetranukleotide higher than trinucleotide is 88%. This shows that the pattern of occurrence of k on the extraction characteristics affect the accuracy, where by the greater value ofkis the higher accuracy of the identification. Table 3, 4, 5 and 6 show the performance of SVM in identifying DNA sequence data to the data of tuna, mackerel and other fish.
Table 3 shows the value of sensitivity for each species by using a feature extraction trinucleotide and tetranucleotide. The average value obtained for trinucleotide sensitivity is 0.828, which means that at least 82.8% of fish species have been identified to the actual class. While using tetranucleotide average value of sensitivity is 0.89, which is about 89% of fish species can be identified to the actual class. However, for speciesScomberomorus commerson has the lowest sensitivity value is 0, which means none of the species identified in the actual classroom, this is caused by an imbalance of the number of species with other species.
Table 3. Sensitivity value on the species of tuna, mackerel and other fish
Test Data
Sensitivity
Trinucleotide (k=3) Tetranucleotide (k= 4)
Carcharhinus limbatus 1.00 1.00
Gadus macrocephalus 1.00 1.00
Hypostomus plecostomus 0.50 0.50
Scomberomorus commerson 0.00 0.00
Thunnus alalunga 0.92 1.00
Thunnus albacores 0.80 1.00
Thunnus obesus 0.60 0.75
Thunnus thynnus 0.98 1.00
Table 4. Specificity value on the species of tuna, mackerel and other fish
Test Data Specificity
Trinucleotide (k=3) Tetranucleotide (k= 4)
Carcharhinus limbatus 1.00 1.00
Gadus macrocephalus 1.00 1.00
Hypostomus plecostomus 1.00 1.00
Scomberomorus commerson 1.00 1.00
Thunnus alalunga 0.96 0.98
Thunnus albacores 0.98 1.00
Thunnus obesus 0.96 1.00
Thunnus thynnus 0.92 0.96
Table 5 shows the value of precision for each species by using a feature extraction trinucleotide and tetranucleotide. The average value obtained for trinucleotide precision is 0.877, which means that at least 87.7% of the model can identify exactly to the actual class. While using the average tetranucleotide precision value is 0.96, meaning that the model can identify exactly to the actual class by 96%. Lowest precision value owned by Commerson scomberomorusspecies that is 0.
Table 5. Precision value on the species of tuna, mackerel and other fish
Test Data
Precision
Trinucleotide (k=3) Tetranucleotide (k= 4)
Carcharhinus limbatus 1.00 1.00
Gadus macrocephalus 1.00 1.00
Hypostomus plecostomus 1.00 1.00
Scomberomorus commerson 0.00 0.00
Thunnus alalunga 0.69 0.79
Thunnus albacores 0.95 1.00
Thunnus obesus 0.60 1.00
Thunnus thynnus 0.90 0.94
Table 6 shows the value Fmeasure for each species by using a feature extraction trinucleotide and tetranucleotide. The average value obtained for trinucleotide Fmeasure is 0.838, which means that at least 83.8% models can identify exactly to the actual class.
Table 6. Fmeasure value on the species of tuna, mackerel and other fish
Test Data
Fmeasure
Trinucleotide (k=3) Tetranucleotide (k= 4)
Carcharhinus limbatus 1.00 1.00
Gadus macrocephalus 1.00 1.00
Hypostomus plecostomus 0.67 0.67
Scomberomorus commerson 0.00 0.00
Thunnus alalunga 0.79 0.88
Thunnus albacores 0.87 1.00
Thunnus obesus 0.60 0.86
While using the average tetranucleotide Fmeasure value is 0.91, which means that the model can identify exactly to the actual grade of 91%. But the value of the lowest Fmeasure also owned byCommerson Scomberomorusspecies that is equal to 0.
4. Conclusion
The method of classification using SVM models is successfully identified DNA bacode sequences for species of tuna and other fish well because the value of sensitivity and precision are high, but for mackerel fish species models is not able to identify, this is due to the imbalance amount data between species of tuna, mackerel and other fish. The accuracy values obtained using tetranucleotide is higher frequency compared to trinucleotide frequency that is equal to 88% this shows that the pattern of occurrence ofk on the extraction characteristics affect the accuracy, where by the greater value ofkis the higher accuracy of the identification.
References
[1] Dudu A, Georgescu SE, Schiotu AD, Castache M. PCR-RFLP Method to Identify Fish Species of Economic Importance.Archiva Zootechnica. 2010; 13(1): 53-59.
[2] Nurilmala Mala, Ushio Hideki, Kaneko Gen. Ochiai Yoshihiro. Assessment of Commercial Quality Evaluation of Yellowfin Tuna Thunnus albacores Meat based on Myoglobin Properties. Food Sci. Technol.2013; 19 (2): 237-243.
[3] BPKP, Badan Riset Kelautan dan Perikanan. Protet dan Strategi Pengembangan Perikanan Tuna, Udang dan Rumput Laut. Jakarta: Badan Riset Kelautan dan Perikanan. 2013.
[4] Myers MJ. Molecular identification of animal species in food: Transition from research laboratories to the regulatory laboratories.Veterinary Journal. 2011; 190: 7-8
[5] Civera T. Species Identification and Safety of Fish Products.Veterinary Research Communication. 2003; 27(1): 481-489.
[6] Filonzi L, Stefania C, Marina V, Francesco NM. Molecular Barcoding Reveals Mislabeling of Commercial Fish Products in Italy.Food Research International. 2010; 43: 1383-1388.
[7] Mafra I, Ferreira IMPVO, Oliveira MBPPO. Food Authentication by PCR-based Methods.European
Food Researchand Technology. 2008; 227: 649-665.
[8] Hebert PDN, Cywinska A, Ball SL, Dewaard JR. Biological identification through DNA barcodes. Proc. R. Soc. Lond. B. 2013; 270: 313-321.
[9] Pati A, Heath LS, Kyrpides NC, Ivanova N. ClaMS: A Classifier for Metagenomic Sequences.
Standards in Genomic Sciences.2011; 5: 248-253.
[10] Benedict AM, Roselyn DA, Minerva FHV, Sweedy KLP, Mudjekeewis DS. Detection of Mislabeled Commercial Fishery by Products in the Philippines Using DNA Barcodes and its Implications to Food Traceability and Safety.Food Control. 2013; 33(1): 119-125.
[11] Lowenstein JH, Amato G, Kolokotronis SO. The Real Maccoyii: Identifying Tuna Sushi with DNA Barcodes-Contrasting Characteristic Attributes and Genetic Distances.PloS ONE. 2009; 4(11): 7866. [12] Karlin S, Burge C. Dinucleotide Relative abundance Extremes. A Genomic Signature.Trends Genet.
1995; 11: 283-290.
[13] McHardy AC, Martín HG, Tsirigos A, Hugenholtz P, Rigoutsos I. Accurate phylogonetic classification of variabel-length DNA fragments.Nature Methods.2007; 4(1): 63-72.
[14] Weitschek E, Fiscon G, Felici G. Supervised DNA Barcodes Species Classification: Analysis, Comparison, and Results.BMC Bio Data Mining. 2014.
[15] Seo TK. Classification of Nucleotide Sequences Using Support Vector Machines. Journal of molecular evolution. 2010; 71(4): 250-267.
[16] Sujeevan R, Hebert PD. Bold: The Barcode of Life Data System.Mol Ecol. 2007; 7(3): 355-364. [17] Kusuma WA. Combined Approaches for Improving the Performance of Denovo DNA Sequence
Assembly and Metagenomic Classification of Shorts Fragment from Next Generation Sequencer. Disertation. Tokyo: Tokyo Institut of Technology; 2012.
[18] Han J, Kamber M. Data mining: concepts and techniques. Third Edition. New York (US): Morgan kaufmaann Academic Pr. 2012.
[19] Yang Yu, Liang Zhou. Acoustic Emission Signal Classification based on Support Vector Machine.
TELKOMNIKA Indonesian Journal of Electrical Engineering. 2012; 10(5): 1027-1032.