DEVELOPING AUTOMATIC TEST ASSEMBLY
USING LP-SOLVE AND MYSQL FOR PARALLEL
TEST PACKAGES BASED ON THE INFORMATION
FUNCTION
Rumyati
11
Graduate School, Yogyakarta State University,
Campus of Karang Malang Yogyakarta 55281, Indonesia
[email protected]
Abstract
The purpose of this study is to develop item bank of mathematics based on IRT and an
Automatic Test Assembly program (ATA) with some parameters that can be changed. The
method used in this study refers to the Waterfall model suggested by Pressman. The
developmental design was grouped into four developmental procedures consisting of:
(1) Planning, (2) Modeling, (3) Construction, and (4) Deployment. The product assessment
was carried out by a subject matter expert, psychometric expert, and IT expert through FGD.
The unlimited scale of ATA trial and a larger scale trial respectively involved six and 15
teachers. The questionnaire was given to the experts and teachers. This study found two
findings: (1) The item bank of mathematics for senior high school has been calibrated with
IRT, and (2) The ATA program can assemble multiple parallel packages based on test
information function (TIF) curve and content (competence standard, basic competence, and
indicators).
Keywords
:
IRT, ATA, FGD, TIF
Presenting Author’s biography
1.
Introduction
Reliable test is needed to obtain accurate information. This is because the test is one way to assess the level of human abilities indirectly, through a person's response to a number of stimuli or questions (Djemari Mardapi, 2008: 67). Reliable tests that have good quality can be obtained if developed with reference of the official curriculum in force with regard to competencies (competency standard and basic competency).
Educators not only make test items to be compiled into a package of test, but also develop a number of different packages of tests referring to the same test specification. It is aimed to anticipate cheating practice among students if the test items given to them are exactly alike. However, this method is still uncommon, not many teachers have done this. If any, generally it is still done manually by taking one by one test item and arranging them into parallel packages based on the standard of competence, basic competence, number of items, and others. Due to the need to meet detailed specifications, assembling tests manually is not an easy job, and it is quite exhausting to do so. It is definitely impractical and inefficient, especially if the item bank is not available.
The item bank is a key element in the process of assembling the test. Information from the items contained in the item bank can be used to assemble the package of tests in accordance with the detailed test specifications. Assembling different but parallel packages of tests will be easier to do if the item bank contains sufficient number of items.
If the IRT-calibrated item bank is already available, it is possible to do assembly test based on the information function where the IRT information function is identical to the reliability in classical test theory. With the help of the software, assembling some different but parallel test packages with complex specifications can be performed automatically and simultaneously based on the information function with some parameters that can be changed as needed.
2.
Literature Review
Item Response Theory
Item Response Theory (IRT) is a mathematical model that describes relationship between the ability of participants with the test device. 3P-logistic models are presented as follows (Hambleton, Swaminathan, & Rogers, 1991: 17, Hambleton, & Swaminathan, 1985: 49).
; i = 1, 2, ... , n (1) Where Pi(θ)is the probability that an examinee with ability θanswers test item i correctly
.
The threshold parameter of item i, denoted as bi, is the item difficulty parameter. Because in IRT items and persons are on the same scale, it can be said that Person A’s trait level is almost the same as Item 1’s difficulty, or Item 1 is almost as hard as Person A’s trait level (Embretson & Reise, 2000). The slope parameter of item i, denoted as ai, is the item discrimination parameter that characterizes the sensitivity to proficiency (Hambleton &Swaminathan, 1985). The value of the item discrimination parameter, ai, is said to be proportional to the slope of the probability function at the location of bion the ability axis (Rogers et al., 1991). The value of the item discrimination parameter, ai, is said to be proportional to the slope of the probability function at the location of bi on the ability axis (Hambleton, Swaminathan, & Rogers, 1991). Therefore, this discrimination parameter controls how steep the ICC lies. Thus, using this parameter, students can be distinguished with trait levels above and below the rising slope of the ICC. The lower asymptote parameter of item i, denoted as ci, is what is termed the "guessing" or “pseudo-chance level” parameter (Hambleton, Swaminathan, & Rogers, 1991). This ci parameter reflects the chance that a student who has very low proficiency will nevertheless select the correct option (Hambleton & Swaminathan, 1985).Logistic models 3P are generally suitable for the multiple choice questions and the research results have also shown empirically that the logistic model 3P is more suited to the multiple-choice test compared to 1P or 2P logistic models (Hambleton, Swaminathan, & Rogers, 1991: 53–74).
Information Function
Item information function declares strength or donations of items in uncovering latent trait measured in a test. According to Hambleton, Swaminathan, and Rogers (1991: 91) item information function (IIF) is written as follows:
one of the advantages of IIF curves is that they can be added to specify the shape of the curve for the test information function (TIF). This curve is one of the most important characteristics when the automated test assembly is used.
Especially for 3P logistic models, item information function according to Birnbaum (1968) in Hambleton, Swaminathan, & Rogers (1991: 91) is
Ii(θ)=
[
1.7 ( )][
1.7 ( )]
2 information function is an accumulation of information the grains making up the test. Test information function I (θ) is the sum of all item information functions; thus, its value is determined by the item information functions that form the test. According to Hambleton, Swaminathan, & Rogers (1991: 94) test information function can be written by:I(θ)=
∑
=n
i1Ii(θ) (4)
Where Ii(θ)is the item information; and n is the number of test items. It defines the relationship
between ability and the information provided by a test. The more information each item contributes, the higher the test information functions.
Each item has its own information function in the form of a curve called item information function. The curve can be combined or added to determine the curve shape of test information function. The independence between items resulting items in the test device can be added, subtracted, or changed freely, and by using the additive nature of the curve of item information function, it can be assembled a test or multiple tests in accordance with the specific shape approaching the desired shape.
The Item Bank Calibrated by IRT
To use of IRT in the test assembly requires an item bank. Lawrence (1998) states that the item bank is a collection of files that consists of a variety of test items that are encoded according to subject areas, measured instructional objectives, and various other characteristics of the matter. Likewise, Nakamura (2001) defines item bank as a large collection of test questions that has been classified and stored in a database that can be retrieved or selected to create new tests.
The item bank to be used in assembling tests based on information function should be calibrated by one of the IRT’s logistics model, in this case, the model of 3P logistics. The calibration process is used to estimate the item parameters of a test.
Lp-solve Library
Lp-solve library is a library that is able to resolve various problems of Mixed Integer Linear Programming (MILP). lp-solve libraries can be used with a variety of popular programming languages, such as C, C ++, Pascal, Delphi, Java, VB, C #, VB.NET, and Excel. This library is an open source and can be downloaded for free in http://lpsolve.sourceforge.net. This library has also been used by some experts related to automated test assembly. Qi Diao & van der Linden (2011), for example, used lp-solve for automated test assembly through R. Unlike the software that will be built here, the use of R lp-solve still requires the ability of the user to translate a problem into an automated test assembly linear programming model.
Indication of the Equalitythe Test Packages
Psychometricians have used statistical definitions and criteria to operate parallelism. However to create truly parallel forms, that both content and statistical targets must be met (van der Linden & Adema, 1998). The first component that must be met is statistical criteria which will be described below. The second component includes substantive or judgmental evidence. For example, a substantive review by content specialists can be conducted. Content specialists could review the items to ensure test cohesion within forms, high quality across forms, and adequate content coverage.
Curve shape from Test Information Function
According to Samejima (1977), tests are considered parallel if they have the same test information functions (Boekkooi Timminga E., 1986: 12). In IRT, each test has an informationfunction, which is called as test information function. When there are curves information function of some package depicted in a plot in Cartesian coordinates and they have identical or almost similar shape, then some packages were considered parallel or statistically equivalent.
ValueInformationFunction on Specific Ability Scale
When a test is constructed using automated test assembly methods, a target for a TIF makes goal values (also called target values) available along the θ scale to use for the item bank. Test Assemblers are free to choose the number and distance of the target value of the level of ability to guarantee required precision. But in practice, the target values as an objective function to be considered only at a few points on the proficiency scale θ, also denoted as �� , i = 1,…, L. Zero-One (0/1) linear programming model just assume the target value at a certain point (van der Linden & Boekkooi-Timminga, 1989).
Usually only three or four points needed (Adema et al., 1991: 106). van der Linden (in press) provided target values that yield excellent results for the 3PL model: (�1 , �2,�3) = (-1.0, 0.0, 1.0) or (�1 , �2,�3,�4, ) = (-1.5, -0.5, 0.5, 1.5). One of the reasons for choosing a smaller number of points is that
fewer points result in much faster solutions in the practical automated test assembly (van der Linden, in press). At a certain point ability scale, this studyused θ = -1.0,θ = 0.0, andθ = 1.0. When information function on the three-point ability scale, each package has a value information function about approaching the same at each point, then this indicates that some of the package is about equivalent seen from the information function of the three points. Then this indicates that the fifth packet is about
parallel.
Mean Item Parameter
Correlation Item Parameter
Each package has a test information function respectively. When the correlation of test information function between two packages is high enough, then this indicates that the packages are parallel.
Mean and MSE of Test Information Function Difference between the Packages
The mean test information function difference was small, indicating that the TIFs were comparable for packages, and the mean square error of the test information function difference less than or equal to 0.05 indicates good fit.
Relative Efficiency
Mathematically relative efficiency according to Hambleton, Swaminathan, & Rogers (1991: 96) is formulated as follows:
RE(θ) =��(�)
��(�) (5)
where, RE(θ) = Relative Efficiency, ��(�) = Information Function to Test A, ��(�) = Information
Function to Test B. When there are two packages that have relative efficiency close to 1, it can be said that packages with the ability to measure the length test are the same and have the same measurement precision.
Relevant Studies
Cor et al., (2009) conducted a study on the application of linear programming to perform automated test assembly using the add-in for Microsoft Excel 2007 and upgrade Premium Solver Platform. Data obtained from the simulation with an average item parameters for a, b, and c respectively are 0.91; -0.14; and 0.20. Then the researcher do the assembly of three packages parallel tests automatically and simultaneously with no restrictions or constraints that three test packets are assembled, each consisting of 10 items without overlap, and for the content categories of one to four each in sequence consisting of 2, 3, 2, and 3 items. Three-point ability scale considered in this study is at θ = -1.0, θ = 0.0 and θ = 1.0 and the objective function is based on minimax method.
The study results showed that Excel program is worth doing to solve the problem of automated test assembly of increasingly large and complex, and the main factors that affect the timing of the solution is the nature of the constraints and the objective function are modeled in every of test assembly problems. With increasingly more complex constraints, it takes long enough solution in the process of test assembly. Although there are variations within the solution in the test assembly in Excel, but a solution that required less when compared to procedure tests assembly performed manually will take several days or even weeks to produce some test packets. In addition, the assembly process test in Excel with the Premium Solver Platform is quite simple and easy to learn. However, there are some limitations such as by more sophisticated constraint, modeling in spreadsheets become unwieldy and inefficient, and the fact that Premium Solver Platform is quite expensive.
Qi Diao and van der Linden (2011) has conducted a study on Automated Test Assembly by using version 5.5 of the Program lp-solve R. In the used item pool, there are six categories of content with 165 items of achievement from test grade 9 science subjects that have been tested on approximately 40,000 students, and have been calibrated with 3PL response model. Categories 1 through 6 respectively consist of 23, 26, 22, 29, 29, and 36 items. Then the researcher do the assembly of two parallel test package automatically and simultaneously with no restrictions or constraints that both the test packets each consisting of 55 items and each without overlap. The values of absolute targets for
Koun-Tem Sun, Yu-Jen Chen, Shu-Yen Tsai, and Chien-Fen Cheng (2008) have conducted a study on the assembly parallel test forms based on IRT using Genetic Algorithms. They used two item bank that have a different size, each consisting of 1000 items and 320 items are used to evaluate the performance of the genetic algorithm method against two popular alternative methods; they are Swanson-Stocking and Wang-Ackerman methods. Genetic algorithm method successfully built parallel tests with a large number of constraints. When test specifications defined as a constraints model, the fitness function of the GA can be derived by combining the equation constraints and the objective function. After applying genetic operations (crossover, mutation, and reproduction), they obtained solution near optimal to meet all the test specifications. The results showed that the proposed approach is able to efficiently obtain very good results.
Developing Automatic Test Assembly
The process of developing an Automatic Test Assembly is by following the model of software development Waterfall (Pressman, 2009), which includes the steps of: 1) planning, 2) modeling, 3) construction, and 4) installation (Deployment).
Specifications of Automatic Test Assembly
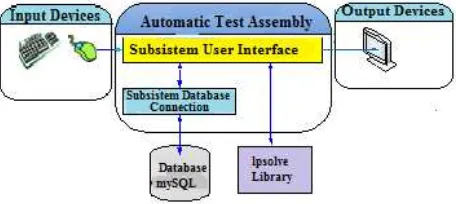
The assembled software is expected to be able to: 1) manage data item parameters from the item bank that is stored in mySQL; 2) accept parameters about the package that will be assembled from the user; 3) assemble some packages based of the parameters that have been set; and 4) show and process the packages that have been assembled. The package assembly process itself will be performed by the lpsolve library called from the main program. Here is a block diagram of the developed system.
Fig.1 Block diagram from Automatic Test Assembly
Design of Automatic Test Assembly
Automated test assembly is designed as a program that runs on Windows operating system. The program is designed by employing Multiple Document Interface (MDI) approach that is a graphical user interface in which multiple windows or the form is in a window or the main form. To meet the needs in accordance with the features that are already defined above, some forms are designed as follows.
1) The main form. It serves as the parent of the other forms in MDI approach. In this form, it will be attached menu to access other forms.
2) The assembling form. It is the form that will handle input from user related to the assembly, calling the assembly process, and showing the results of the assembly.
3) The test item form. It displays those items that exist in the test item bank and handle the management of the test items, for example to add, edit or delete. As a complement of this form is the form of edit items in charge of the process of adding and editing items.
4) The user form. It is the form that will handle the management of users because the software is designed to be used by multiple users with different activities.
5) The login form. It will ask for names and keywords when the program is first run.
6) About the package form. It is the form that will display the packages of test items that have been prepared.
7) History form. It is the form that will display the user login history.
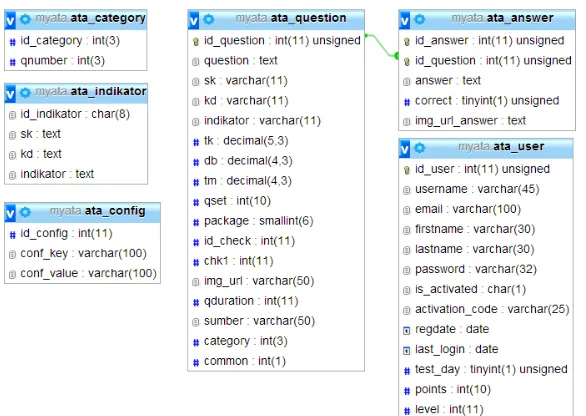
Fig. 2 The structure of the table used
Implementation of Automatic Test Assembly
After the design is developed, it is then implemented by using Delphi 2007 CodeGear development tools (Delphi 11). It is because it allows the fast operating creation of software by making good use of the many ready-made components supplied by both Delphi 11 itself or various third party developers. Here is a view of the results of the implementation of the program.
Fig. 3 Display of login
Fig. 5 Display of form to items list in the item bank
3. Discussion
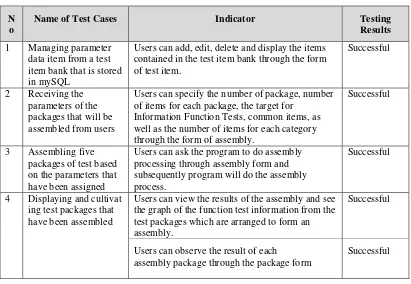
After Automatic Test Assembly is completed, testing is done with a black-box testing or functional testing is to determine whether the planned features have been implemented properly. Below is a table of the results of functional testing.
Table 1 Results of testing black box
N o
Name of Test Cases Indicator Testing
Results
1 Managing parameter data item from a test item bank that is stored in mySQL
Users can add, edit, delete and display the items contained in the test item bank through the form of test item.
Users can specify the number of package, number of items for each package, the target for
Information Function Tests, common items, as well as the number of items for each category through the form of assembly.
Users can ask the program to do assembly processing through assembly form and subsequently program will do the assembly process.
Successful
4 Displaying and cultivat ing test packages that have been assembled
Users can view the results of the assembly and see the graph of the function test information from the test packages which are arranged to form an assembly.
Successful
Users can observe the result of each
assembly package through the package form
Successful
Functional testing results show that the software built has already been able to meet the planned features. The software is able to receive input of various data required for the assembly process, and manage data to construct a linear programming model that is subsequently completed by lp-solve library. The results of the completion of lp-solve are processed to be displayed in the form and also to set the package number information of each item in a MySQL database. However, the performance of other methods still need further study.
senior high school of science program. There are twelve (12) test packages, with the overall number of items consisting of 450 items, including common items for the same year or different years. After calibrated with Bilog-MG, it was acquired 392 items grouped into 17 competence standards, 24 basic competences, and 38 indicators. Statistics item to a test item bank can be seen in table 2.
Table 2 Statistics item of 392 items
a b c
Mean 1.13 0.162 0.203
Standard Deviation 0.293 1.202 0.038
Max 3.53 11.339 0.435
Min 0.087 -3.097 0.024
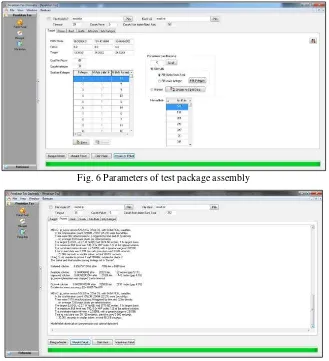
Tests performed to obtain about five packages each of which consists of 40 items with information function on theta of -1.0, 0.0, and 1.0 for each 0.2. In addition, as many as eight common items processed by the computer automatically by selecting the 8 items of the first to have the most maximum information function of the items contained in the item bank. As a result, eight items were selected, that is items number 26, 145, 199, 249, 288, 301, 315, and 349. There are
three ways to determine the common items on the program automated
assembly, namely: (1) automatically selects n first item which has the maximum information function in the item bank; (2) automatically selects n first item which has the maximum information function on selected indicators; and (3) manually decide n items from the item bank that will be common items. As shown in Fig. 6.
Fig. 6 Parameters of test package assembly
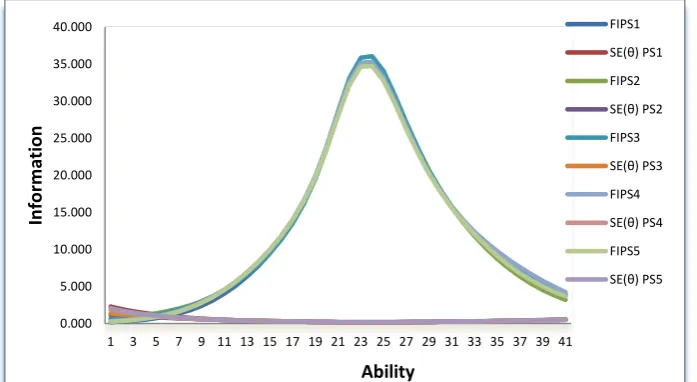
Fig. 8 Graph tests of information function for five packages were successfully constructed.
Fig. 9 Distribution of the test items selected in each package
Shape information function curve of the five packages, when it was drawn on the same ability scale θ, it
appears that shape of the curve is identical with each other, as shown in Fig 10. This indicates that five packages are parallel.
Fig. 10 FIT to five packages
0.000 5.000 10.000 15.000 20.000 25.000 30.000 35.000 40.000
1 3 5 7 9 11 13 15 17 19 21 23 25 27 29 31 33 35 37 39 41
In
fo
rma
ti
o
n
Ability
Table 3 is a summary of the mean and standard deviation for each item parameter package. It appears from Table 3, the mean of item discrimination parameter (a) is in the range of 1.354 to 1.409. Mean to item difficulty parameter (b) is in the range of 0.132 to 0.243. While, mean of the “guessed” or “pseudo-chance level” parameter (c) is in the range of 0.207 to 0.220. Mean to item discrimination parameter (a) for each packet is uniform approach. Similarly, item difficulty parameter (b) and the “guessed” or “pseudo-chance level” parameter (c) also looks uniform.
Table 3 Mean and standard deviation to item parameter
Mean Standard Deviation
Package a b c a b c
I 1.354 0.215 0.207 0.571 0.366 0.048
II 1.371 0.132 0.212 0.575 0.560 0.042
III 1.409 0.159 0.218 0.563 0.513 0.058
IV 1.374 0.177 0.209 0.550 0.426 0.049
V 1.387 0.243 0.220 0.547 0.554 0.051
Meanwhile, the range of standard deviation from the item difficulty parameter (b), the item discrimination parameter (a), and “guessed” or “pseudo-chance level” parameter (c), can be described as follows: standard deviation the item discrimination parameter (a) in the range of 0.547 to 0.575; for the item difficulty parameter (b) of standard deviation in the range of 0.366 to 0.560; and the "guessing" or “pseudo-chance level” parameter (c) standard deviation in the range of 0.042 to 0.058. Based on these ranges, the item difficulty parameter is more varied than the other two item parameters, and the item discrimination parameter more varied than the “guessed” or “pseudo-chance level” parameter.
The correlation to FIT between packets is above 0.9, which is considered as very high correlation. This was as shown in Table 4.
Table 4 Correlation between the FIT package
Package Package
I II III IV V
I 0.0000 0.99896 0.99947 0.96317 0.99969
II 0.99896 0.0000 0.99973 0.99872 0.9994
III 0.99947 0.99973 0.0000 0.99933 0.99946 IV 0.96317 0.99872 0.99933 0.0000 0.99971
V 0.99969 0.9994 0.99946 0.99971 0.0000
With regard value FIT on three-point ability scale at θ = -1.0, θ =0.0 and θ = 1.0, from the three-point each point gives value which uniform, as shown in Table 5.
Table 5 FIT package at θ = -1.0, θ = 0.0 and θ = 1.0 Package FIT to three-point ability scale (θ)
-1.0 0.0 1.0
1 4.020 28.281 15.777
2 4.529 28.167 15.667
3 4.491 28.616 15.763
4 4.546 28.422 15.732
Relative efficiency is the estimator of ability to scale ability (θ) specific. Relative efficiency is calculated by comparing information functions both packet of the same scale ability. For example, with regard of Table 5, relative efficiency between package one with package two on ability scale θ = 1.0 is 15.777 / 15.667 = 1.007 which is close to the value one. This means that for two packages, each consisting 40 items will generate an estimated ability to have precision the same on ability scale. This also applies when one calculates relative efficiency among all package, which the results will be close to the value 1; thus, the resulting estimates ability to have precise of the same for all packages on
ability scale θ = -1.0, θ = 0.0, and θ = +1.0.
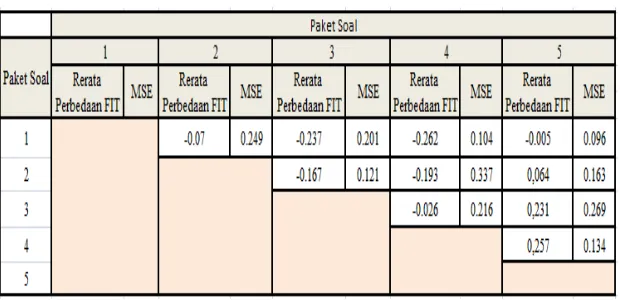
The mean and MSE of FIT differences between packages can be seen in Table 6. In consecutive, the mean FIT difference package one with next package is equal to -0.07, -0.237, -0.262, and -0.005. Respectively, the mean FIT difference in package two with next package is equal to -0.167, -0.193, and 0.064. Correspondingly, the mean FIT difference in package three with next package is equal to -0.026 and 0.231. The mean FIT difference in package four with package five is equal to 0.257. Package one with other packages has very small mean FIT difference, which is ≤ 0.05. Followed by mean FIT difference between package two with package three and package four is ≤ 0.05. Similarly, the mean FIT difference between package 3 and package 4 is ≤ 0.05. Although the TIF difference between packages that other ≥ 0.05, but the overall mean FIT difference inter the package is quite small. The mean FIT difference inter package shows the fit relative inter packet, smaller value indicates FIT between two packages is comparable or fit.
On the other hand, the MSE of FIT differences package one with next package is equal to 0.249, 0.201, 0.104, and 0.096, respectively. Correspondingly, the MSE of FIT differences package two with next package is equal to 0.121, 0.337, and 0.163. In consecutive MSE of FIT differences package three with next package is equal to 0.216 and 0.269. MSE of FIT difference package four with packet five is equal to 0.134. When viewed from calculation MSE of FIT difference, all grades showed ≥ 0.05, meaning that inter-package has a poor fit.
However, as it has been previously explained that the mean and standard deviation item parameter is uniform and shape information function curve from all packages is identical, FIT relative for mean and MSE of TIF differ inter package, and the value of relative efficiency inter-package approach is one. This indicates that the five packages assembled using ATA program is parallel, although MSE of TIF difference inter-package ≥ 0.05
Table 6 Mean and MSE of FIT difference inter-package
Although, lp-solve library already been used in relation to automated test assembly by Qi Diao and Wim J. van der Linden, they are using lp-solve for automated test assembly through R. However, the use of lp-solve from R still requires the user’s ability to translate the problem of automated test assembly into a linear programming model.
for each package about to be assembled from the user, (3) assembles several packages based parameter assembly that has been set, (4) display and process packages that have been assembled. The process of assembling itself will be done by library lp-solve that called from the main program.
4. Conclusion
1. The developed software meets the following initial specifications that have been set: (a) manage the data parameters of the questions from a test item bank that is stored in mySQL, (b) accept parameters about the package that will be assembled from the user, (c) assemble three test packages based on the parameters that have been set, and (d) display and process the packages of tests that have been assembled.
2. The software is developed by using CodeGear Delphi 2007, which can work well to connect with MySQL as the data storage server and lpsolve library as the "engine" that does the assembly process as a linear programming problem.
3. To verify the test package assembly, a test item bank with 392 items composed of 12 mathematics test packages for senior high school of science program used for National Examination was thoroughly utilized. Lp-solve performance testing is done to achieve 5 test packages with the level of information function in theta -1.0, 0.0, and 1.0 for each 0.2.
4. The equal value of the packages are indicated by: the graph from test information function of each package which was identical; the mean and standard deviation for the uniformity of each item parameter, and a high correlation; the mean and MSE from information function difference among packages, and value of information on uniform scale of ability (θ= -1, θ= 0, θ= 1); and relative efficiency between the package which had a value close to 1.
5. Lp-solve performance testing used as part of this software still needs to be analyzed further to determine the most optimum parameters of lp-solve use.
References
[1] B. Timminga. E. Simultaneous test construction by zero-one programming. Methodika. Enschede, The Netherlands: Twente University of Technology, 1986.
[2] K. Cor, C. Alves, and M. J. Gierl,. Three applications of automated test assembly within a user-friendly modeling environment. Practical Assessment, Research and Evaluation, 14. 1-23, 2009. [3] D. Mardapi. Teknik Penyusunan Instrumen Tes Dan Nontes. Yogyakarta: Mitra Cendekia Offset,
2008.
[4] S. E. Embretson, and S. P. Reise. Item response theory for psychologists. Mahwah, NJ: Lawrence Erlbaum Associates, Inc, 2000.
[5] R. K. Hambleton, and H. Swaminathan. Item response theory: Principles and applications. Boston, MA: Kluwer Nijhoff Publishing, 1985.
[6] R. K. Hambleton, H. Swaminathan, and H. J. Rogers. Fundamentals of Item Response Theory. Newbury Park, CA: Sage Publications, 1991.
[7] K.T. Sun, Y.J. Chen, S.Y. Tsai, and C.F. Cheng. Creating IRT-based parallel test forms using the genetic algorithm method. Applied Measurement in Education, 21. 141–161, 2008.
[8] R. Lawrence. Item banking. Practical Assessment, Research and
Evaluation http://pareonline.net.getvn.asp?v=6&n=4, 1998.
[9] Lord. Applications of item response theory to practical testing problems. Hillsdale NJ: Lawrence Erlbaum Associates, 1980.
[10]Y. Nakamura. Rasch measurement and item banking. Research Report. 2001.
(http://www.eric.net).
[11]R. S. Pressman, Software Engineering: A Practitioner's Approach 7th Edition. New York: McGraw-Hill, 2009.
[13]F. Samejima. Weakly parallel tests in latent trait theory with some criticisms of classical test theory. Psychometrika, 42, 193-198, 1977.
[14]W. J.van der Linden, & B. Timminga, E. A maximum model for test design with practical constraints. Psychometrika, 54, 237–247, 1989.
[15]W. J. van der Linden, and J. J. Adema. Simultaneous assembly of multiple test forms. Journal of Educational Measurement, 35, 185-198, 1998.