CHAPTER III
METHODOLOGY
A. Research Method and Research Design
1. Research Method
The study applied descriptive research method to the use of
concept map as assessment tool on urinary system. According to Best,
descriptive research is concerned with how or what is exists related to
some preceding event that has affected a present condition or event
(Cohen et al., 2007). In this research, data was gathered by conducting
paper and pencil test and concept map scoring. The score of students’
paper and pencil test and concept map were analysed and used to find
the correlation between two variables.
2. Research Design
In this research correlation design is used. According to Gay, Mills
and Airasian (2009) correlation research involves collecting data to
determine whether, and to what degree a relation exist between two or
more quantifiable variable.
B. Population and Sample
1. Research Location and Period
The location of this research is International Junior High School in
Bandung in the School period of 2014/2015. This school uses English
as the formal language of instruction and applies Cambridge
Curriculum in combined with National Curriculum and their own
curriculum. This school mostly combines Cambridge and National
Curriculum for science subject.
2. Population and Sample
The population of this research was all 8th grade students. The
samples are 26 students in from 8th grade. The sampling technique that
implemented is convenience sampling or accidental sampling. Gay,
Mills and Airasian (2009) stated that convenience sampling is the
C. Operational Definition
In order to avoid misconception about this research, some operational
definition is explained. Those terminologies are explained as follow:
1. Definition of concept map is a visual representation of the
relationships between concepts held by an individual, materials of a
lecture, textbook, or laboratory exercise. In conducting learning
process, concept map is constructed manually by student in a piece of
paper. The score of student’s concept map was gathered as data.
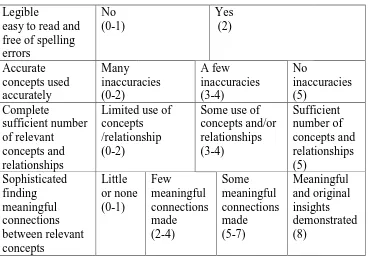
Concept map would be scored by Mueller’s Classroom Concept Map
Rubric that has four aspect of assessment: legibility, accuracy,
completeness and sophistication.
2. Paper and pencil test was constructed by 20 multiple choice question
and four essay questions. Multiple choice questions were constructed
by cognitive domain C1 until C5 while essay question construct by C3
until C6 cognitive process. Paper and pencil instrument will be testing
its validity by expert judgement and ANATES. Essay item test was
scored based on the indicator. The score of multiple choice and essay
objective test were then combined and use as the data.
3. Cognitive that is being measured in this research involves level of
cognitive remembering (C1), understanding (C2), applying (C3),
analysing (C4), evaluating (C5) and creating (C6) based on Taxonomy
Bloom from Anderson (2001). This competence is measured by using
multiple choice and essay question of paper and pencil test.
D. Research Instrument
In this research, instrument is necessary to be used for gaining
data. There are two type of instrument that is used in this research. Those
instruments are described below.
1. Objective and subjective test is used as an evaluation to measure the
students’ cognitive after learning urinary system.
2. Concept map rubric is proposed to determine the score of students’
3. Guidance of interview is purpose to guide in collecting data through
interview.
1. Design of Research Instrument
a. Objective and Subjetive Test Instrument
Objective test is in a form of multiple-choice questions. This
objective test is used to see student cognitive after learning urinary
system concept. There are six cognitive process that used in
multiple-choice and essay questions; there are remembering (C1),
understanding (C2), applying (C3), analysing (C4), evaluating (C5)
and creating (C6). Multiple choice questions consist of five cognitive
domains remembering (C1), understanding (C2), applying (C3),
analysing (C4), and evaluating (C5). While essay question consist of
four cognitive domains applying (C3), analysing (C4), evaluating (C5),
and creating (C6).
All of the test item has been judged by experts and then analysed
using ANATES statistical software after tested to 9th grade students.
The result of the test items after tried out was used, revised or deleted.
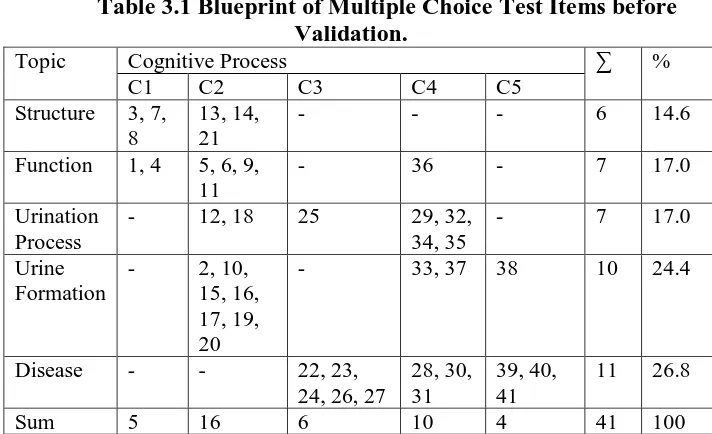
The blueprint of objective question before conducting instrument
analysis is shown in Table 3.1 and 3.2.
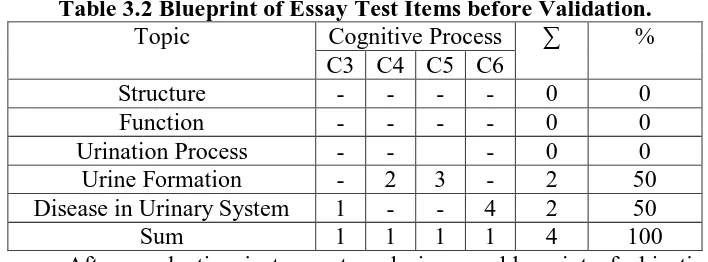
Table 3.2 Blueprint of Essay Test Items before Validation.
Topic Cognitive Process ∑ %
C3 C4 C5 C6
Structure - - - - 0 0
Function - - - - 0 0
Urination Process - - - 0 0
Urine Formation - 2 3 - 2 50
Disease in Urinary System 1 - - 4 2 50
Sum 1 1 1 1 4 100
After conducting instrument analysis, new blueprint of objective
test is gained and used as research instrument. The result of research
analysis is attached in appendix. From 41 questions that have been judged
and revised 20 questions are used. While for essay item test from four
questions, all of them are used and revised. The blue prints of test items
after instrument analyses are shown in the Table 3.3 and 3.4.
Table 3.3 Blueprint of Multiple Choice Test Items after Validation.
Topic Cognitive Process ∑ %
C1 C2 C3 C4 C5
Structure 2,6 8,11 4 20
Function 1 3 2 10
Urination Process 4,17 10, 13 4 20
Urine Formation 5,7,9 18 4 20
Disease in Urinary System
19 12,14 15,16 20 6 30
Sum 3 9 4 3 1 20 100
Table 3.4 Blueprint of Essay Objectives Test Items after Validation.
Topic Cognitive Process ∑ %
C3 C4 C5 C6
Structure - - - - 0 0
Function - - - - 0 0
Urination Process - - - 0 0
Urine Formation - 2 3 - 2 50
Disease in Urinary System 1 - - 4 2 50
Sum 1 1 1 1 4 100
b. Rubric
Rubric scale is used to analyse the concept map that made by the
student. This rubric scale will determine whether student is able to
make a good concept map or not. The rubric is based on Mueller’s
Table 3.5 Table of Mueller’s Classroom Concept Map Rubric.
regarding about students impression in constructing concept map
and doing paper and pencil test.
2. Instrument Analysis
The objective test instrument is used to measure student’s
cognitive. The analysis of instrument will be covers validity,
discriminating power, level of difficulty, and reliability.
a. Validity
Validity is defined as the extent to which the instrument
measures what it is designed to measure that emphasize on not
on the test itself, but on the result (Arikunto, 2003). According
to Arikunto (2003) to get valid result of the activity, the
instrument that will be used must be valid. The validity that
because the instrument will be design to measure student
cognitive based on learning objective. To determine the number
of validity, it is done with the product moment correlation
equation as follows.
∑ [ ∑ ∑ ]
√[ ∑ ∑ ][ ∑ ∑ ] Where,
rxy = items correlation coefficient.
∑ = sum of total score of all student for each question’s item.
∑ =sum of total scoreof all students for whole test. Y = total score of each student.
X = items scores.
N = amount of subject.
(Arikunto, 2003)
Table 3.6 Validity Interpretation Correlation Coefficient Validity Criteria
0,80 < r ≤ 1,00 Very high
defined as the extent to which an instrument produce the same
result on repeated trials. Reliability tends to a definition about
trust instrument that is used as collecting data tools. To define
the reliability of objective test, alpha formula will be used as a
formula because the question using multiple question
Where,
r11 : Instrument reliability
n : Amount of question
2i
: Amount of variant score in each item 2i
: Varian total
(Arikunto, 2003)
Table 3.7 Reliability Interpretation Correlation
Coefficient
Reliability Criteria 0,80 < r ≤ 1,00 Very high
0,60 < r ≤ 0,80 High
0,40 < r ≤ 0,60 Enough
0,20 < r ≤ 0,40 Low
0,00 ≤ r ≤ 0,20 Very low
(Arikunto, 2003)
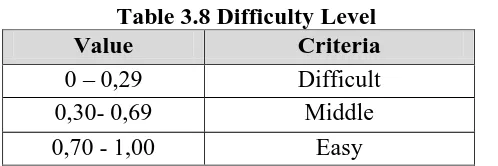
c. Difficulty Level
Too much difficult question will not good for student
because it can make student depressed and do not motivated to
solve the problem. The good question is the question that has
easy, medium and difficult item on it.
To show the difficulty level of the question, difficulty index
can be used to show the difficulty level of question. The range
of level of difficulty is from 0,00 to 1,00. The lower the index
then the question is more difficult and vice versa. To find out
the difficulty index the formula that is used is shown below:
JS B P
Where,
P =Difficulty index
B =Number of students who answer the question correctly
JS = Number of all students who join the test
Table 3.8 Difficulty Level
Value Criteria
0 – 0,29 Difficult
0,30- 0,69 Middle
0,70 - 1,00 Easy
(Arikunto, 2003)
d. Discriminating power
Decimating power is define as ability of particular question
to distinguish student who classified as higher achiever and
lower achiever the amount of higher achievement student
compared to lower achievement student means that those
question have positive discriminating power index (Arikunto,
2003). Discriminating power index show the scale from minus
one until positive one, with the negative one represent the
lower discriminating power index. The formula is represented
below.
Where:
DP= discriminating power
Ba= the number of upper group that answer correctly
Ja= total of student in upper group
Bb= the number of upper group that answer incorrectly
Jb= total of student in lower group
(Arikunto, 2003)
Table 3.9 Classification of Discriminating Power
D Classification
0,00 – 0,20 Poor
0,21 – 0,40 Satisfactory
0,41 – 0,70 Good
0,71 – 1,00 Excellent
(Arikunto, 2003)
e. Distractor
In multiple choice item tests, there is one right answer and
to make student attract to that option. In determining whether
the distractor is good or no, we use this formula.
(Arikunto, 2003)
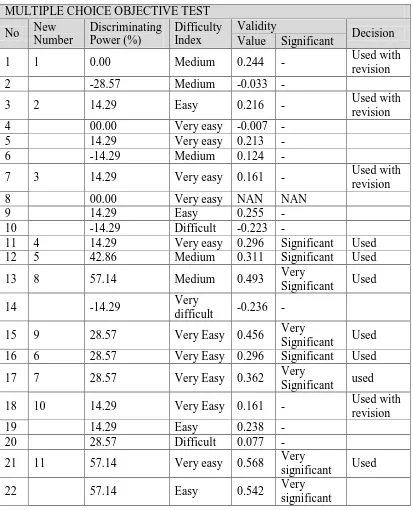
The summary of all instrument data analysis is displayed in Table 3.10.
Table 3.10 Summary of Instrument Data Analysis Result
MULTIPLE CHOICE OBJECTIVE TEST
E. Data Analysis
In this research the data is processed in quantitatively and
supported by qualitative data. Quantitative data processing is used for
measuring both students’ paper pencil and concept map.
1. Quantitative Data Analysis
Quantitative data analysis is done by Microsoft excel and SPSS
calculation, in order to determine the score of pre-test and post-test. Then
the result of the data will be processes as the following explanation.
a. Scoring test items
The first step to process data is scoring the test items. The test
items are provided in the 20 number of multiple choice questions and
four essay questions. The result will be scored, and the scores were
processed using Microsoft excel. . Full score of multiple choice will be
20 while essay 30. To determine the final score of objective test as
follow.
b. Scoring Concept Map
The second step is to process the scoring of student’s concept map. Student’s concept map is cored based on Mueller’s Classroom Concept
Map Rubric. The scoring aspect is about the legibility, accuracy of concept
used, the completeness of concept and the relation between every concept.
The scores are processed using SPSS statistic 19.
c. Normality Test
Normality test is use to know whether the sample comes from
population that has normal distribution or not (Ghasemi and Zahediasl,
2012). In this research, Normality test is used statistic test from SPSS 19
d. Determining the Correlation Coefficient
Determining the correlation coefficient is needed to analyse
whether or not there is correlation between students’ paper pencil test and
concept map. The analysing process is using non parametric statistic
Spearman rank correlation. According to Simon and Goes (2011)
Spearman rank correlation can be use to analyse the data that has less
than 30 samples. Spearman rank correlation is used if the data at least
one variable is an ordinal data (Gay, Mills and Airasian: 2009).
According to Simon and Goes (2011) the formula of Spearman rank
correlation is:
∑
Where,
rs = spearman coeficient
di =difference in the ranks given to the two variable values
n = amount of data
(Simon and Goes, 2011)
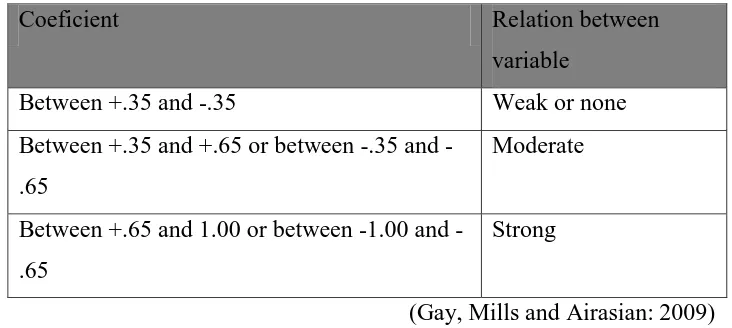
The spearman coefficient then will be interpreted to identify
whether or not there is correlation between two variables. One way to
interpret the correlation coeficient is shown in Table 3.11.
Table 3.11 Interpreting Correlation Coefficient Chart.
Coeficient Relation between
variable
Between +.35 and -.35 Weak or none
Between +.35 and +.65 or between .35 and
-.65
Moderate
Between +.65 and 1.00 or between 1.00 and
-.65
Strong
(Gay, Mills and Airasian: 2009)
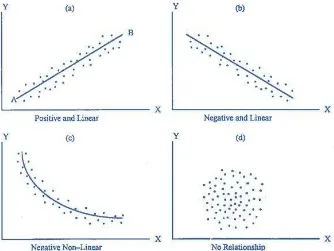
Based on figure below, there are three types of association pattern;
linear curvilinear and uncorrelated. The linear relation classified into two
relationship of score where the low (or high) the score on one variable
relate to how low (or high) score on the other variable (Creswell, 2007).
Figure 3.1 Pattern of Association Between Two Variables.
(Source: aqq.auburn.edu)
Creswell (2007) stated that a curvilinear distribution shows
increase, plateau, and decline in Y- axis variable with increasing in
x– axis variable or increase, plateau, and decline in Y- axis
variable with increasing in – axis variable decrease, plateau, and
increase in Y- axis variable with increasing in X– axis variable.
While no correlation relationship shows the distribution of
variables that independent each other. A particular score in one
variable does not predict or tells us any information about the
possible score on the other variable.
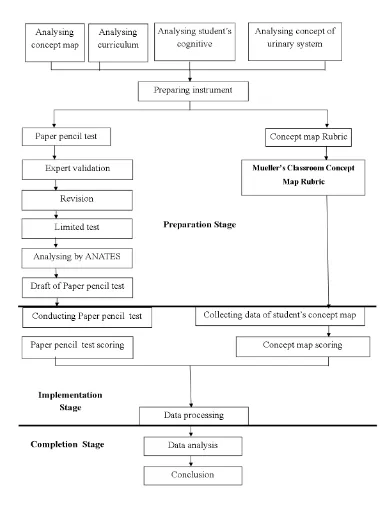
F. Research Procedure
There are three stages of procedure consist of preparation stage,
implementation stage and completion stage. Those three stages will be
1. Preparation Stage
In this stage researcher prepare everything that will be needed for
the implementation of this research. In this stage, the researcher
conduct several stages that support the research, the steps will be
explained as follow:
a. Conducting literature study.
This part is an initial step that conducted to gain actual
information related to the theories and research problem. These
data can be taking from compatible resources, such as the latest
book, journal, articles, etc.
b. Choose the topic for implementing research.
c. Analysing the concept.
d. Conducting prior study.
It can be done by examining schools’ archived file about
students achievement in science subject and observe how the
lesson conducts in the classroom.
e. Determine the research sample.
f. Construct and justify the instrument.
2. Implementation Stage
a. Administration the instrument.
b. Take data of student concept map.
c. Conducting objective test.
d. Scoring the data of student’s paper pencil test and concept map.
3. Completion stage
a. Data analysis.
b. Draw conclusion.
c. Give suggestion for further research.