BURN SEVERITY MAPPING IN AUSTRALIA 2009
R. McKinley a,*, J. Clarkb, J. Leckerb
a
U.S. Geological Survey, Earth Resources Observation and Science Center, Sioux Falls, SD USA – rmckinley@usgs.gov
b
U.S. Forest Service, Remote Sensing Applications Center, Salt Lake City, UT USA – (jtclark, jlecker)@fs.fed.us.
KEY WORDS: Hazards, Forest fire, Change detection, Landsat, Landscape
ABSTRACT:
In 2009, the Victoria Department of Sustainability and Environment estimated approximately 430,000 hectares of Victoria Australia were burned by numerous bushfires. Burned Area Emergency Response (BAER) teams from the United States were deployed to Victoria to assist local fire managers. The U.S. Geological Survey Earth Resources Observation and Science Center (USGS/EROS) and U.S. Forest Service Remote Sensing Applications Center (USFS/RSAC) aided the support effort by providing satellite-derived
―soil burn severity‖ maps for over 280,000 burned hectares. In the United States, BAER teams are assembled to make rapid
assessments of burned lands to identify potential hazards to public health and property. An early step in the assessment process is the creation of a soil burn severity map used to identify hazard areas and prioritize treatment locations. These maps are developed primarily using Landsat satellite imagery and the differenced Normalized Burn Ratio (dNBR) algorithm.
1. INTRODUCTION
Land managers in the United States are concerned with the response of watersheds to precipitation after a wildfire. With an ever-expanding wildland-urban interface (WUI), land managers must be continually cognizant of potential damage to private property and other values at risk due to fire (Clark, 2011). Land management agencies deploy Burned Area Emergency Response (BAER) teams to ―prescribe and implement emergency treatments to minimize threats to life or property or to stabilize and prevent unacceptable degradation to natural and
cultural resources resulting from the effects of a fire‖ (USDA
Forest Service, 2004). In the United States, the primary BAER team objective is emergency stabilization of burned areas rather than long-term restoration of the landscape after a fire. BAER teams assess conditions and prescribe treatments in an effort to protect life and property and prevent additional damage to resources (Clark, 2011). Burned area treatments can include seeding of desired species, application of mulch to provide ground cover, contour log felling and the construction of log barriers to reduce erosion, and protecting transportation corridors by enlarging culverts or installing fences to minimize the impact of debris flows and increased runoff.
BAER teams attempt to immediately address hazards that burned areas may represent for several years. For example, lands experiencing high levels of burn severity may be susceptible to mud and debris slides during and after heavy rain events. BAER teams attempt to locate areas of high burn severity and assess the potential downstream damage that could result from such slides. Factors such as the presence of personal property, threatened and endangered species, archeological sites, water supplies, and threats to soil productivity must be considered by BAER teams. In the United States, one of a
BAER team’s first tasks is to develop a soil burn severity map that highlights the areas of low, moderate, and high burn severity within a wildfire perimeter (Clark, 2011). The term
―soil burn severity‖ is used to prevent confusion with other BAER maps that focus more specifically on vegetation mortality. For BAER purposes, soil burn severity is generally defined as fire-caused changes in soil characteristics that affect the soil hydrologic function. Along with other environmental and terrain variables, soil burn severity is a critical input to
subsequent GIS modeling scenarios used to assess or predict potential post fire effects such as increased surface water runoff, debris flows (Cannon, 2010), and erosion. The soil burn severity map also serves as a base map for subsequent BAER assessments.
Traditionally, the BAER soil burn severity map was created by sketching burn perimeters on a topographic map—or even a forest-visitor map—from a helicopter or road-accessible overlook (Clark, 2011). These methods were often inaccurate and labor intensive especially when mapping large fires in remote or inaccessible locations. In 2001, the use of satellite imagery and remote sensing techniques for soil burn severity mapping was pioneered by the United States Department of Agriculture (USDA) Forest Service (FS) Remote Sensing Applications Center (RSAC) and the Department of the Interior (DOI) United States Geological Survey (USGS) Center for Earth Resource Observation and Science (EROS). Working cooperatively, the two centers have succeeded in establishing an operational program to serve DOI and USDA BAER teams and other local, state and federal land management entities. This support activity is usually required from the time of fire containment to 7 to 14 days post-fire when BAER teams generally must complete their assessments. EROS and RSAC have developed methodologies to provide immediate post-fire GIS-ready map and image layers that characterizes landscape change due to fire. In the United States, remote sensing and geographic information system (GIS) technologies have proven to be an effective alternative to traditional soil burn severity mapping techniques.
In 2009, US BAER teams were deployed to Victoria to assist local fire managers. USGS EROS and USFS RSAC supported these teams by providing satellite-derived soil burn severity maps for over 280,000 burned hectares (691,895 acres). The BAER team support work and the satellite burn mapping effort were achieved with a high degree of cooperation with
Victoria’s Department of Sustainability and Environment
(DSE) and the Australian government’s National Earth Observation Group (previously known as ACRES), which is affiliated with Geoscience Australia. This group provides earth
observation services including data from Australia’s principal
earth resource satellite ground station and data processing International Archives of the Photogrammetry, Remote Sensing and Spatial Information Sciences, Volume XXXIX-B8, 2012
XXII ISPRS Congress, 25 August – 01 September 2012, Melbourne, Australia
facility. Specifically, Australia Geosciences assisted the effort by providing near real time access to Landsat 5 and 7 acquisitions for the burned area. Appropriate Landsat scenes were identified using the image browsing capabilities of the ACRES Digital Catalogue. Scenes were then transferred by file transfer protocol (FTP) to EROS/RSAC staff in the United States for generation of the burn mapping products. Once generated, products were FTP transferred or emailed directly to BAER team members in Australia for use in field assessments and planning activities.
2. METHODOLOGY
2.1 Study Area and Products
In 2009, EROS/RSAC received requests from US BAER teams deployed to Victoria to provide burn severity maps for several fires (or fire complexes). BAER team staff worked closely with local land and fire managers. Specifically, assessments for the following fires were requested:
Beechworth
Bunyip
Churchill-Delburn
East Tyer-Thompson
Murrindindi
Wilson Promontory
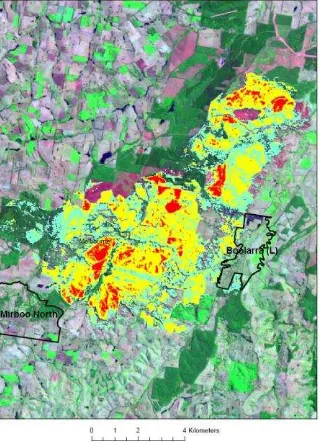
The spatial relationship of individual mapped fires to the Melbourne urban area and a Landsat image mosaic that provided coverage for path 92 and rows 85-87 is shown in Figure 1. Data layers generated for all Victoria fires included the following: a pre-fire image, a post-fire image as shown in Figure 2, continuous burn severity data in the form of a differenced normalized burn ratio (dNBR) (Eqs. (1) and (2)) or the differenced normalized difference vegetation index (dNDVI) (Eqs. (3) and (4)) image, and a classified dNBR or dNDVI image displaying low, moderate and high soil burn severity as shown in Figure 3.
2.2 Satellite Image Processing
Burn mapping products were generated for the 2009 Victoria bushfires using the same methodology that has been used in the United States to support BAER teams since the 2003 fire season. These mapping techniques are based upon the normalized burn ratio (NBR) and dNBR (Key, 2006). The NBR is a remote sensing image derivative that exploits the characteristics of the near-infrared and short-wave infrared portions of the electromagnetic spectrum as they have proven to be good discriminators of burn scars and the mosaic of severities that typically occur within a burn perimeter. The dNBR compares NBR imagery acquired before the fire with imagery of the same area acquired immediately after the fire to identify the location and magnitude of changes in vegetation.
The NBR is computed using Landsat Enhanced Thematic Mapper (ETM) or Thematic Mapper (TM) near-infrared (NIR) and short-wave infrared (SWIR) spectral bands (4 and 7) respectively. The NBR is calculated as follows:
) /(
)
(NIR SWIR NIR SWIR
NBR (1)
Figure 1. Overview of 2009 mapped fires (bright red) and their proximity to the Melbourne urban area and Landsat path 92 and
rows 85-87 (yellow line grid).
Figure 2. Delburn post-fire image acquired 02 Feb 2009. International Archives of the Photogrammetry, Remote Sensing and Spatial Information Sciences, Volume XXXIX-B8, 2012
XXII ISPRS Congress, 25 August – 01 September 2012, Melbourne, Australia
Figure 3. Delburn classified soil burn severity image. Light blue = Low, Yellow = Moderate, and Red = High.
By convention, NBR is normally scaled by 1000 to transform the data to integer format. For burn severity mapping purposes, the NBR is generally calculated for both a pre- and post-fire image and then used to derive a differenced NBR (dNBR) as follows:
postfir e pr efir e NBR NBR
dNBR
(2)
After being developed by Key and Benson (Key, 2006), NBR and dNBR have been widely used to map burned areas across the USA and internationally. Using dNBR and comparing a pre-fire image to a post-fire image captures the fire-related changes that interest BAER teams. For example, sites that were heavily forested prior to a fire and then experience complete vegetation-canopy loss are more likely to exhibit drastic increases in runoff during subsequent rainfall. In contrast, sites with little pre-fire biomass that experience complete canopy loss are less likely to exhibit drastic increases in runoff. Using pre-fire imagery in the mapping process also helps account for vegetation characteristics and changes unrelated to the fire, such as the current effects of historic fires, drought, and management activities.
Landsat or other satellite imagery that possess SWIR and NIR spectral bands may not be available for some fires and therefore the dNBR index can not be generated. In these cases, EROS and RSAC use alternative satellite or airborne scanner image indices, most often the normalized difference vegetation index (NDVI). NDVI is an index that has been used to identify vegetated areas and estimate vegetation condition since the
early 1970’s (Rouse, 1973). It is also a standardized method of comparing vegetation greenness between satellite images over time. NDVI is computed using Landsat ETM/TM near-infrared (NIR) and visible red (RED) spectral bands (4 and 3) respectively. NDVI is calculated as follows:
) /(
)
(NIR RED NIR RED
NDVI (3)
When mapping burn severity with imagery lacking a SWIR band (a band used in the dNBR calculation) NDVI has been shown to be a suitable substitute for NBR and dNBR (Hudak, 2007) (Zhu, 2006). For burn severity mapping or change detection purposes, the differenced NDVI (dNDVI) is calculated using two images acquired at different time intervals (i.e. pre-fire and post-fire) as shown in this example for mapping burn severity:
postfir e pr efir e NDVI
NDVI
dNDVI
(4)
In the United States, BAER teams are tasked to identify these burn areas and to produce a full-coverage, four-class soil burn severity map. Within a fire perimeter, the maps generally possess unburned or very low severity, low severity, moderate severity and high severity map classes. RSAC and EROS assist in this process by providing BAER teams in the field with a number of near real-time remote-sensing based products.
BAER teams rely heavily on the burned area reflectance classification (BARC) map. Figure 3 provides a BARC map developed for the Delburn fire. BARC maps are a generalization of the dNBR created for team members with varying geospatial skills. The BARC has two formats: BARC4 and BARC256. The BARC4 is a four-class (unburned to very low severity, low severity, moderate severity, and high severity) thematic map layer created by analysts with predefined, discrete severity classifications. The BARC256 is a continuous-value map layer with a 0–255 data-value range generated by rescaling dNBR values to less than full precision. If BAER teams analyze the BARC4 map and determine that certain elements are misclassified, they can easily re-classify the cell values in the BARC256 and recreate the BARC4 to reflect conditions more consistent with ground sampling data and/or observations by local experts.
In addition to BARC maps, BAER teams in the United States are provided with pre- and post-fire georeferenced and top-of-atmosphere (TOA) reflectance corrected satellite imagery (Huang, 2002). This allows the team to do manual image interpretation or additional digital image analyses if they possess the required technical expertise. The imagery also provides a synoptic view of the entire fire area that may be useful for briefings and public presentations. The majority of the imagery used to map wildfires in the United States is obtained from the Landsat series of Earth-observing satellites. The USGS provides this imagery at no cost to BAER teams and the public. On occasions when Landsat satellite imagery is not available, other domestic and international sources of imagery are used (Clark, 2011).
3. DATA AND TRAINING AVAILABILITY
3.1 USA BAER Online Data Archive
Burn severity data layers as well as pre- and post-fire satellite imagery, for all Australian fires mapped in 2009, are available for download. These datasets include the BARC256 and continuous dNBR layers, as well as Landsat TM pre- and post-fire image subsets. One exception is the data available for the Wilson Promontory fire. Due to clouds, Landsat imagery was not available. The products for this fire were generated from an image acquired by the Advanced Spaceborne Thermal International Archives of the Photogrammetry, Remote Sensing and Spatial Information Sciences, Volume XXXIX-B8, 2012
XXII ISPRS Congress, 25 August – 01 September 2012, Melbourne, Australia
Emission and Reflection Radiometer (ASTER) instrument on the Terra satellite using the dNDVI index. All BAER burn severity products generated by EROS and RSAC, including products generated for Australia in 2009, can be previewed and downloaded at the USFS/USGS BAER data distribution website (http://activefiremaps.fs.fed.us/baer/download.php).
3.2 Monitoring Trends in Burn Severity Project
Burn severity products similar to those described in this paper are being generated for the United States for the period 1984 to the present (Eidenshink, 2007) by the Monitoring Trends in Burn Severity (MTBS) project. Products generated by MTBS are not designed to satisfy BAER team immediate post fire mapping requirements. MTBS products may not be available for several months after a fire. However, this joint USDA FS and DOI USGS project is mapping all historical fires greater than 1,000 acres and examining national trends in fire characteristics over time. More MTBS related information and data downloads are available at the USGS/USFS MTBS website (http://www.mtbs.gov).
3.3 Training for Burn Severity Mapping
In the United States, except for one designated specialist, BAER team members are generally not GIS experts. BAER teams are typically staffed by hydrologists, soil scientists, archeologists, and wildlife biologists. The BARC and other geospatial map layers require some ability to view and manipulate data in common GIS software. Therefore, the remote sensing centers offer training in basic remote sensing theory, BARC editing, and methods for appropriate use of BARC data in erosion-risk and other models (Clark, 2011). These training sessions are open to all interagency professionals. More information about the remote sensing support offered to BAER teams in the United States and online burn mapping training is available at the USFS/USGS BAER imagery support website (http://www.fs.fed.us/eng/rsac/baer/).
4. CONCLUSIONS
Burn severity mapping using remote sensing and GIS technologies has become an operational component of BAER teams in the United States. These methodologies may be applicable in Australia and other countries where wildfires have potential to impact human health and property, as well as other critical resources. Although this effort did not assess the accuracy of burn severity products in Australian ecosystems, burn severity mapping using NBR, NDVI and other indices, such as the leaf area index, have been evaluated with reasonable results in Australia (Boer, 2008). The most efficient and responsive approach to generating burn severity products for fires in Australia and other countries is likely a process where products are developed locally. Organizations such as EROS and RSAC may be useful sources of satellite imagery, user and data processing training, processing methodologies and models, and image calibration techniques. However, local staff involvement in the burn mapping process would promote the collection of field verification/validation data and facilitate a more interactive approach to developing final map products. Additional work evaluating satellite image-derived indices for mapping burn severity in Australian ecosystems should be conducted.
REFERENCES
Boer, M.M., Macfarlane, C., Norris, J., Sadler, R.J., Wallace, J., and P.F. Grierson, 2008. Mapping burned areas and burn severity patterns in SW Australian eucalypt forest using remotely-sensed changes in leaf area index, Remote Sensing of Environment, 112(12), 4358-4369.
Cannon, S.H., Gartner, J.E., Rupert, M.G., Michael, J.A., Rea, A.H., Parrett, C., 2010. Predicting the probability and volume of post-wildfire debris flows in the intermountain west. USA: Geological Society of America Bulletin, v. 122, no. 1/2, p. 127– 144, doi: 10.1130/B26459.1.
Clark, J., McKinley, R., 2011. Remote Sensing and Geospatial Support to Burned Area Emergency Response Teams. Fire Management Today, 71(2), May 2011.
Eidenshink, J., Schwind, B., Brewer, K., Zhu, Z., Quayle, B., Howard, S., 2007. A project for monitoring trends in burn severity. Fire Ecology 3(1): 3-21.
Huang, C., Wylie, B., Homer, C., Yang, L., Zylstra, G., 2002. Derivation of a Tasseled cap transformation based on Landsat 7 at-satellite reflectance. International Journal of Remote Sensing, Vol. 23:No. 8, 1741-1748.
Hudak, A.T., Morgan, P., Bobbitt, M.J., Smith, A. M. S., Lewis, S.A., Lentile, L. B., Robichaud, P.R., Clark, J.T., McKinley, R.A., 2007. The relationship of multispectral satellite imagery to immediate fire effects. Fire Ecology, 3(1): 64-90.
Key, C.H., Benson, N.C., 2006. Landscape assessment: ground measure of severity, the Composite Burn Index; and remote sensing of severity, the Normalized Burn Ratio. In: Lutes, D.C.; Keane, R.E.; Caratti, J.F.; Key, C.H.; Benson, N.C.; Sutherland, S.; Gangi, L.J., FIREMON: Fire Effects Monitoring and Inventory System, Gen. Tech. Rep. RMRS-164-CD. Ogden, UT: USDA Forest Service, Rocky Mountain Research Station: LA 1–51.
http://frames.nbii.gov/projects/firemon/FIREMON_Landscape Assessment.pdf (January 2011).
Rouse, J.W., Haas, R. H., Schell, J. A., Deering, D. W., 1973. Monitoring vegetation systems in the Great Plains with ERTS. Third ERTS Symposium, NASA SP-351 I, 309-317.
USDA Forest Service, 2004. Forest Service Manual 2500— Watershed and Air Management, Chapter 2520—Watershed Protection and Management. Washington, DC: USDA Forest Service, 44 p.
http://www.fs.fed.us/cgi-bin/Directives/get_dirs/fsm?2500 (January 2011).
Zhu, Z., Key, C., Ohlen, D., Benson, N., 2006. Evaluate Sensitivities of Burn-Severity Mapping Algorithms for Different Ecosystems and Fire Histories in the United States. Final Report to the Joint Fire Science Program, Project JFSP 01-1-4-12, October 12, 2006, 35pp.
International Archives of the Photogrammetry, Remote Sensing and Spatial Information Sciences, Volume XXXIX-B8, 2012 XXII ISPRS Congress, 25 August – 01 September 2012, Melbourne, Australia