www.elsevier.comrlocateratmos
The effect of diffusion kinetics on the
supersaturation in clouds
You-Suo Zou, Norihiko Fukuta
)Department of Meteorology, UniÕersity of Utah, Salt Lake City, UT 84112, USA
Received 23 November 1998; received in revised form 30 March 1999; accepted 7 April 1999
Abstract
To describe the nucleation–growth interaction at and above the cloud base, a cloud model has been formulated including the haze process below the cloud base and before nucleation of cloud droplets, and a proper diffusion-kinetic droplet growth equation. Analytical equations for the
w
maximum supersaturation by Twomey Twomey, S., 1959. The nuclei of natural cloud formation: Part II. The supersaturation in natural clouds and the variation of cloud droplet concentration. Geofis. Pura Appl. 43, 243–249; Twomey, S., 1977. Atmospheric Aerosols. Elsevier, Amsterdam,
x w
302 pp. and by Fukuta and Xu Fukuta, N., Xu, N., 1996. Nucleation–droplet growth interactions x and microphysical property development in convective clouds. Atmos. Res. 41, 1–22 , both employing the Maxwellian growth theory, are compared with the model outputs, and the model outputs are found to be the smallest. To preserve the clarity and usefulness of the analytical equations, a correction factor to the latter is obtained in comparison with the model results for
Ž .
different condensation coefficient b and cloud condensation nucleus activity spectra of typical continental and maritime air masses. Effect of b is found to be larger for small b and in continental clouds.q1999 Elsevier Science B.V. All rights reserved.
Keywords: Diffusion kinetics; Supersaturation; Nucleation–growth interaction; Clouds
1. Introduction
The microphysical properties of clouds, the droplet size distribution in particular, are known to significantly affect their radiative properties and processes leading to
precipita-)Corresponding author. Fax:q1-801-585-3681; E-mail: [email protected]
0169-8095r99r$ - see front matterq1999 Elsevier Science B.V. All rights reserved.
Ž .
Ž .
tion development IPCC, 1995 . Cloud droplets form on cloud condensation nuclei
ŽCCN ; the number concentration and the size spectrum of droplets are determined by.
the interaction between the generating updraft and the supersaturation-reducing growth process of droplets that formed on CCN according to the supersatura-tion the interacsupersatura-tion achieves. The interacsupersatura-tion yields a supersaturasupersatura-tion maximum which primarily decides the number concentration of the formed droplets, and the number concentration remains approximately constant thereafter until precipitation processes begin. Throughout the process, entrainment and turbulence widen the size distribution. Determination of the maximum cloud supersaturation specifically involves chemistry of nucleus particles, haze stage of their growth, nucleation, and the following droplet growth in the dynamically changing cloud environment. The early works on the cloud
Ž . Ž .
supersaturation were carried out mostly by Howell 1949 , Squires 1952 , Mordy
Ž1959 and Twomey 1959 . More studies followed in the subsequent years e.g., Mason. Ž . Ž
and Chien, 1962; Mason and Jonas, 1974; Warner, 1969; Arnason and Brown, 1971; Soong, 1974; Ochs, 1978; Clark and Hall, 1979; Saxena and Fukuta, 1982; Robinson,
.
1984; Politovich and Cooper, 1988; Grabowski, 1989 . Numerical works recently carried
Ž . Ž . Ž . Ž .
out are typically Young 1993 , Chen 1994a,b , Xu 1994 , Korolov 1995 , Fukuta and
Ž .
Xu 1996 . These cloud models or numerical simulations, though useful, require considerable time and effort in construction and hence are not convenient for practical application as compared to analytical formulas. Nevertheless, cloud processes are so complicated that it is not possible to obtain an analytical solution to predict the supersaturation maximum, including all the details of interactions involved.
Ž .
Twomey 1959 successfully worked out an analytical formula for the maximum supersaturation. It is based on the Maxwellian droplet growth theory and does not deal
Ž . Ž .
with the more realistic diffusion-kinetic DK theory Fukuta and Walter, 1970 . The
Ž .
DK theory describes the effects of the condensation coefficient b and thermal
Ž . Ž .
accommodation coefficients a . Leaitch et al. 1986 pointed out the importance of the DK effect stating that a change in condensation coefficient represents a change in the early droplet growth rate, which would in fact modify the supersaturation in a cloud. Most importantly, this would alter the maximum supersaturation in the cloud, which would then modulate the droplet concentration. The DK effect was discussed by Hudson
Ž1993 for CCN spectrum measurement in his device. Under this circumstance, Fukuta. Ž1993 and Fukuta and Xu 1996 developed an analytical method which includes both. Ž .
2. Description of the new cloud model
2.1. Aerosol composition and the initial particle sizes for haze growth process
Atmospheric observations have shown that in the northern hemisphere, sulfate
Ž .
aerosols now dominate at the sources Hobbs, 1993 . Observations in urban, remote continental, polar and maritime areas reveal the chemical composition of tropospheric aerosols in which the negative ions are largely populated by in mass concentration for both continental and maritime air masses, and the positive ions by NHq and Naq
4
ŽJaenicke, 1993 . These observations indicate that NH. Ž 4 2. SO , ammonium sulfate, and4
the derivatives represent the majority of CCN. It should then be reasonable to select ammonium sulfate as the solute of haze particles before being involved in cloud droplet formation.
In the present cloud model to describe the haze process, we first obtain size distribution of dry particles out of the selected CCN activity spectrum, assuming the
Ž .
particles are all ammonium sulfate. Similar to the cloud model of Young 1993 , the mass of ammonium sulfate in the range 10y1 9–10y1 1 g is logarithmically divided into
100 groups as
m
Ž .
j s10w0 .08Ž101yj.y19x,Ž .
1N
where js1, 2, . . . , 101.
The dry nucleus particles thus divided are assumed to be perfectly spherical, so that they may be converted into the corresponding sizes using
1r3
3mN
Ž .
jrN
Ž .
j sž
/
,Ž .
24prN
where rN is the density of the dry nucleus compound. Then the 100 groups of dry particles are allowed to grow at a prescribed atmospheric condition of pressure, temperature, relative humidity in the updraft. In this way we can follow the change of the size distribution of haze particles by growth in a pre-cloud parcel.
2.2. Condensation growth of haze particles and cloud droplets
In the present cloud model, both haze particles and cloud droplets are allowed to
Ž . Ž
grow by condensation, all adopting thermodynamically improved Lcr R Tv ` Mason,
. Ž .
1971 and including Kelvin surface tension as well as the solute effects under low concentration. The following growth formulas are selected:
Maxwellian droplet growth equation is given as
Fukuta DK equation is described as
Eq. 4 is based on Knudsen treatment of accommodation phenomena right above the
Ž .
surface of the droplet Chapman and Cowling, 1970 and is basically the same as that of
Ž . X X
Fukuta and Walter 1970 , except that representativea andb of the latter are replaced
Ž . Ž . Ž .
ŽPruppacher and Klett, 1978 may be taken, where T is in Kelvin and p in hPa.. `
Ž . Ž
Eq. 4 is now to be compared with other DK droplet growth formulas Fuchs, 1959;
.
Ž . Ž . Ž .
Fitzgerald 1972 and Fitzgerald 1978 , along the treatments of Fuchs 1959 and
Ž .
Fukuta and Walter 1970 , obtained the following equation
X X 2
where w is the mixing ratio of water vapor, es` saturated vapor pressure at the
Ž .
temperature of cloud environment, and ´ s0.622 is the ratio of molecular weight
Ž .
between water and air. Other parameters in Eq. 6 are the same as those used before
ŽFukuta and Xu, 1996 ..
In these treatments, the origin of Dtraces to the concentration gradient at a distance
Ž .
away from the surface Fuchs, 1959 , and in this D-zone, transfer of the water molecules is assumed to take place without concentration gradient, an obvious contradiction since a finite gradient is the necessary condition for the transfer even in the free molecule regime.
Ž . Ž .
Note that in Eqs. 3 – 6 , a and b express Kelvin and solute effects on droplet growth, respectively,
whererXL is the density of solution droplet and surface tension and van’t Hoff factor are
Ž . Ž
functions of molality X of solute Fitzgerald, 1972; Young, 1993; Young and Warren,
.
Ž . Ž .
where S is the saturation ratio. Then, Eq. 6 becomes
a b
a Maxwellian growth equation for dilute solution droplet. By making use of these
Ž .
conditions, Eq. 6 can be written as
a b
Eq. 10 is the droplet growth equation of Fitzgerald 1972, 1978 , which, together with
Ž . Ž .
Eqs. 3 – 5 , will be used for comparison in our computation for droplet growth. However, for haze particle growth, both Kelvin effect term and solute effect term are to be used in their original forms instead of their linear approximation to make the equation more accurate for high concentrations of solute:
y1
It is clear that Eq. 3 does not consider any DK effect on droplet growth, while Eq.
Ž .5 includes the DK effect but on water vapor transfer process only across a thickness of
D without concentration gradient, an unrealistic physical process as pointed out above.
Ž .
The differences between Fukuta’s and Fitzgerald’s droplet growth equations are
Ž
found in three places. First of all, the former relies on Knudsen’s treatment Fukuta and
.
Xu, 1996 , while the latter follows Fuch’s unrealistic method involving D. Secondly, the former uses bX and aX following the Knudsen method, but the latter employs b and a,
Ž .
instead. The third difference is that the former takes cvq1r2 Ra in l , including thea
Ž .
contribution of hotter molecules, but the latter takes cvqRa sc , which finds nop
place in the steady state heat flow. Only in the non-steady heat flow, which is not the present case, the c transfer is accompanied by gas expansion to bring the R term in, sov a that c becomes involved. These different treatments lead to a substantial discrepancy inp the predicted cloud supersaturation.
2.3. Nucleation of haze particles
In the present cloud model, particles in each of the total 100 groups contain different amounts of ammonium sulfate, but within a given bin, the amount is equally divided among them. Therefore, we consider the heterogeneous nucleation process of haze particles of different groups. When an air parcel reaches the level of cloud base, the supersaturation becomes positive and the nucleation of haze particles becomes possible. However, regardless of whether a haze particle has nucleated or not, the equilibrium
Ž .
radius r may be determined by Kohler, 1921
¨
a b
Sy1y q 3s0,
Ž .
12r r
where S-1 is the supersaturation. The critical supersaturation of this Kohler equation or
¨
the maximum can be obtained by differentiation as1r2
where rN is the radius of dry nucleus, and
1r2 3
4 2s MN
C1s
ž
X2 2 3/
. 3 3irLR Tv `rNMLStrictly speaking, s and i are a function of r since they depend on the droplet molality. However, the molality of the ammonium sulfate solution droplet is below 0.3 when the
Ž .
critical supersaturation is less than 0.5% Pruppacher and Klett, 1978 , and the errors arising from using constant dilute solution values for s and i are below 1 and 6%,
Ž .
respectively Low, 1969 . Under this assumption of dilute solution, the critical radius, for which the critical supersaturation corresponds, is
1r2
3b 3r2
rcriticals
ž /
sC r2 N ,Ž .
14where
At or after S-1critical, haze particles in the group are considered to have nucleated and grow without restriction towards the cloud droplets. Smaller haze particles, whose critical supersaturations are greater than environmental or cloud supersaturation, remain unactivated, although they swell.
The treatment of CCN in our cloud model is quite different from those of some other
Ž
cloud models in which aerosol size distribution e.g., Junges distribution, gamma
.
distribution, or log-normal distribution characterizes the CCN activities. It should be pointed out that aerosol particles are not necessarily CCN, and use of the former in place of the latter, merely based on size, may cause a serious error. We start with dried particle size distribution derived from the CCN activity spectrum, which is
experimen-Ž .
tally verified Twomey, 1959 as
k
NsC S
Ž
y1.
,Ž .
15where N is the total number concentration of CCN, C the constant for the number
Ž .
concentration of CCN particles, and k the slope index. N in Eq. 15 corresponds to activated CCN particles:
Njs
Ý
njŽ .
r ,Ž .
16j
Ž .
where n r is the CCN number concentration of bin j.j
Ž .
The CCN number concentration in each bin n r is determined by first using Eqs.j
Ž . Ž . Ž . Ž1 , 7 , 8 , 13 and 14 to evaluate the critical supersaturation and then to obtain the. Ž .
critical radius. After the cloud base, supersaturation exceeds 0%, and CCN activation process becomes possible. As the cloud parcel rises, the supersaturation increases and more and more particles nucleate. The group of aerosols with the largest dry size as well as the critical radius is first activated in the cloud. The CCN number concentration in
Ž .
group j is calculated by Eq. 15 as
nj
Ž .
r sNjyNjy1.Ž .
17Ž . Ž .
This method satisfies both Eqs. 15 and 16 and helps us determine the CCN number
Ž .
concentration in each size group. The droplet radius corresponding to n r is deter-j
mined by
rjq1qrjy1
rjs .
Ž .
182
2.4. Microphysics-dynamics interaction inside of cloud
neglect droplet collision–coalescence processes. This is to say that our cloud model is a closed adiabatic one with haze particle growth, nucleation, and cloud droplet growth processes. Then, we have
is the condensation rate where n is given by Eq. 17 , andj
a b
The equations of state for air and water vapor are given, respectively, by
psraR T ,d `
Ž .
27For the mass conservation of water substance in cloud,
qv0sqcqq .v
Ž .
29Ž . Ž . Ž . Ž .
Eqs. 19 – 22 together with Eqs. 23 – 28 are to be solved in the present cloud model.
2.5. Physical processes outside of cloud
In the present parcel model, although temperature, humidity and other physical quantities inside and outside of cloud are different, atmospheric pressure p is assumed to be the same at the given height, the hydrostatic approximation. In order to calculate
Ž .
p, we use the dry adiabatic or US standard atmosphere.
Assuming temperature T and pressure p are given, then the height of cloud base0 0 above the sea level, z , can be calculated asb
Rdrcp
T0 pb
zbs
ž
1y/
,Ž .
30g p0
wheregs0.988Cr100 m, and T and p0 0 are temperature and pressure at sea level, respectively,
The height of the parcel above sea level is
t2
zszbq
H
w d t.uŽ .
32t1
If updraft velocity wusconstant, then
zszbqwuDt ,
Ž .
33where Dtst2yt . Then the temperature and pressure outside cloud at the height of1
parcel are
where p z is the pressure both inside and outside of cloud at the height of the parcel.
2.6. Computation procedure
The procedure of our computation is as follows. First, when cloud base conditions,
Ž .
e.g., p , T , S-1b b bs0% are decided, conditions outside of cloud are computed, such as
Ž . Ž . Ž .
growth. For comparison, the cloud base conditions are taken the same as that used in
Ž . Ž .
Twomey 1959, 1977 ; pbs800 hPa, Tbs108C, and RH bs100%. This leads to the starting conditions of haze growth process below the cloud base: p0s809.21 hPa,
Ž .
T0s10.938C, and RH 0s95%.
Then for prescribed size groups of dry solute and properties of the corresponding solution droplets considering van’t Hoff factor as a function of molality, the critical radius and the critical supersaturation are evaluated to obtain supersaturation change and haze size evolution below the cloud, which will provide the initial condition for nucleation and growth of droplets above the base. The nucleation of droplets takes place and droplet size distribution forms as
njq1ynjy1
f r
Ž .
j s .Ž .
362 r
Ž
jyrjy1.
The subsequent estimation of droplet growth process involves estimation of temperature, supersaturation and mixing ratios of water vapor and liquid water which leads to the maximum supersaturation.
For the Maxwellian droplet growth system, our model results for cloud
supersatura-Ž .
tion are checked with that of Rogers and Yau 1989 . In the DK droplet growth system,
Ž .
the predictions of our model are compared to those of the model by Young 1993 which uses the droplet growth equation of Fuchs. The output of the present model agrees with that of others when compared under the same condition.
3. Results and discussion
3.1. Analytical formula of Twomey
Ž .
Twomey 1959 derived an analytical formula to predict the maximum supersatura-tion in dew point elevasupersatura-tion in8C, sma x at a fixed cloud base condition, pbs800 hPa,
Tbs108C,
where B kr2, 3r2 the complete beta function which can be expressed by gamma function G
G
Ž
3r2.
PGŽ
kr2.
B k
Ž
r2, 3r2.
s .G
Ž
3r2qkr2.
Ž .
where C and k are parameters of CCN activity spectrum in Eq. 15 . Due to the
Ž . Ž . Ž .
different nature of sma x, S-1 in Eq. 15 cannot be replaced with Eq. 37 .
Ž .
Since Eq. 37 is obtained at the specific cloud base conditions, it does not include
Ž .
the variation. In order to overcome this shortcoming, Twomey 1977 revised it, so that
1 Ž .
Eq. 38 includes the temperature and pressure variation at cloud base through parameters A, B, and G;
gLc g
where g is the acceleration of gravity.
Ž .
In the following, we will use Eq. 37 to numerically evaluate the accuracy of the work.
3.2. Analytical formula of Fukuta–Xu
Ž .
Fukuta and Xu 1996 employed a different treatment within the condition of
Ž .
Maxwellian droplet growth, and obtained an analytical formula prognostic for cloud maximum supersaturation:
For p s800 hPa, T s108C, 2 A3r2By1G1r2s6.9=10y2 is used erroneously for percentage
supersatu-b b
Ž . y6
ration in Pruppacher and Klett 1978 . It has to be replaced with 7.8=10 for fractional supersaturation.
2
In the original derivation, the bracketed term in B is missing, and values for B and G in Table 4.4
Ž . Ž . Ž .
Then, from Eqs. 15 and 39 , the maximum activated CCN or droplet number concentration in cloud is
There is no need to mention the advantage of analytical solutions for their clarity in the relationship among the variables and readiness for use. However, they are restricted here within the Maxwellian condition of droplet growth. In addition, the solutions do not incorporate the Kelvin effect of droplet curvature and the Raoult effect of solute and start with zero size after activation. The output of the present cloud model can now be used to compare with those of analytical solutions and their limits of error can be assessed or correction factor can be obtained for their practical use.
3.3. Cloud supersaturation predicted by present model
In the present study of microphysical cloud modeling, we take p0s809.21 hPa,
Ž .
T0s10.98C, and RH 0s95%. This selection leads to the cloud base forming at
Ž .
pbs800 hPa, Tbs108C, and RH bs100%, so that we can compare the model output with analytical solutions under the same cloud base conditions.
In the activation and growth phase, haze particles in 98 groups begin to grow after
Ž .
the cloud base the smallest two groups are too small to activate , and the radius of
y3 Ž .
solution droplets of the 98 groups ranges from 2.9=10 to 5.6mm at S-1 s0%. As the parcel continues to rise, cloud supersaturation increases so that more and more droplets become activated. In the meantime, droplets become larger and larger through condensation growth. The resultant moisture removal and latent heat addition cause increases of cloud supersaturation to be slower. The interaction of these two opposing processes results in the evolution of supersaturation to finally reach a point of their balance, and the maximum supersaturation is achieved. Corresponding to the supersatu-ration, the maximum number of CCN is activated. Afterwards, as the supersaturation decreases due to its depletion by condensation, but the droplet number concentration remains nearly constant without further activation of CCN.
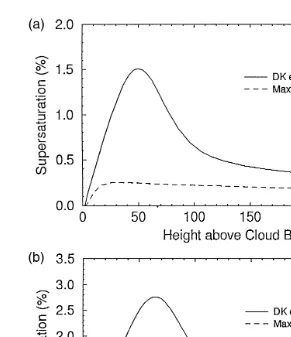
Fig. 1a and b show the supersaturation change in clouds predicted by the present cloud model with a given constant updraft, wus2 mrs. Fig. 1a is for a continental
Ž .0.5 Ž .0.7
cloud with Ns600 S-1 and Fig. 1b for a maritime cloud with Ns100 S-1
ŽTwomey and Wojciechowski, 1969 . Cloud base conditions for both figures are the.
Ž .
same: pbs900 hPa, Tbs158C, and S-1 bs0%. In these figures, the solid line shows the result predicted by using the DK equation and the dashed line the result using the
Ž
Maxwellian equation. In the DK equations,as1 and bs0.03 are used Hagen et al.,
.
1989 . The maximum supersaturation of the latter is about 1.5–2.0 times higher than that of the former.
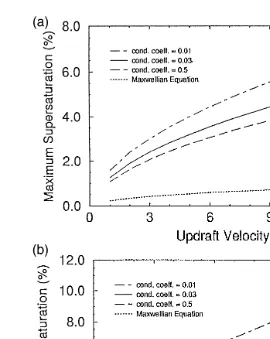
Fig. 2a and b illustrate the relationship between the maximum cloud supersaturation and updraft velocity in clouds, predicted by the present model for DK theory with varying level of b and by the Maxwellian theory. Fig. 2a is for continental clouds, and
Ž
Ž .
Fig. 1. a Supersaturation change in continental cloud predicted by the present cloud model. The dashed line is for Maxwellian droplet theory, and the solid line for DK theory withas1 and bs0.03. In both cases,
Ž .0.5 Ž .
Ns600 S-1 , and pbs900 hPa and Tbs158C, wus2 mrs. b Supersaturation change in maritime cloud
Ž . Ž .0.7
predicted by the present cloud model. Conditions are the same as in a , except for Ns100 S-1 .
.
1996 , these figures show that a smaller b results in a markedly larger supersaturation maximum, and use of the Maxwellian equation results in the lowest supersaturation maximum. It reveals that the ratio of supersaturation maximum between the DK model with as1 and bs0.03, and the Maxwellian is between 1.5–3.5.
3.4. Comparison of the maximum cloud supersaturation predicted by the present cloud model and those by the analytical formulas
Ž .
Fig. 2. a Comparison of the maximum supersaturation in continental clouds predicted by the present cloud model with Maxwellian and diffusion-kinetic droplet growth theories for different condensation coefficient as
Ž .0.7 Ž .
a function of updraft velocity. Tbs158C, pbs900 hPa, as1, and Ns500 S-1 . b Comparison of the maximum supersaturation in maritime clouds predicted by the present model with Maxwellian and
diffusion-Ž .
kinetic droplet growth theories for different condensation coefficient. Other conditions are the same as in a ,
Ž .0.5
except Ns100 S-1 .
Ž . Ž
As Twomey 1959 is far more widely cited and used than his later work Twomey,
. Ž .
1977 , we will use the former formula, Eq. 37 , despite its predictions being smaller than those of the latter. As pointed out above, supersaturation should be a dimensionless
Ž .
number. So, we will convert the output of Eq. 37 in the dew point temperature, T , ind
Ž .
8C into supersaturation a dimensionless number by
e Ts
Ž .
dSy1 s y1, 41
Ž
.
maxŽ .
where T is the temperature at cloud base. Here we let Tb bs108C, and
Twomey and Wojciechowski 1969 also determined through observations that Cs100 cmy3, ks0.7 for maritime clouds and Cs600 cmy3, ks0.5 for continental clouds.
Ž
However, in cloud modeling, some others Clark, 1974; Grabowski, 1989; Chen,
.
Figs. 3–5 compare the maximum supersaturation predicted for maritime clouds using
Ž Ž . Ž ..
analytical formulas Eqs. 37 and 39 and the present cloud model. Fig. 3 shows the
Ž .1r3
Fig. 3. Comparison of the maximum supersaturation in clouds for maritime CCN spectrum, Ns125 S-1 . Supersaturation predicted by the present cloud model and Twomey’s and Fukuta–Xu’s analytical formulas are given, as a function of updraft velocity, all using the Maxwellian droplet growth theory. pbs800 hPa and
Ž .1r4
Fig. 4. Comparison of the maximum supersaturation in clouds for maritime spectrum, Ns160 S-1 , predicted by the present cloud model and analytical formulas of Twomey and Fukuta–Xu with the Maxwellian droplet growth theory. Other conditions are the same as in Fig. 3.
result using maritime CCN activity spectrum with Cs125 cmy3 and ks1r3. Fig. 4
gives the result with another maritime CCN activity spectrum with Cs160 cmy3 and
ks1r4. Fig. 5 is for the typical maritime CCN spectrum in which Cs100 cmy3 and
ks0.5. In these three figures, both analytical formulas show the supersaturation maximum discrepancy with the cloud model. In Fig. 3, the prediction of Fukuta–Xu is about 2.3 times larger than that by the cloud model, and that of Twomey is about 1.4 times. In Fig. 4, the maximum supersaturation of the Fukuta–Xu formula is about 1.9 times larger than that of the cloud model, and that of the Twomey formula about 1.4
Ž .0.5
Fig. 6. Comparison of the maximum supersaturation in continental clouds for continental spectrum, Ns
Ž .0.4
2000 S-1 , predicted by the present cloud model and Twomey’s and Fukuta–Xu’s formulas in the Maxwellian droplet growth system. Other conditions are the same as in Fig. 3.
times larger than that of the cloud model. In Fig. 5, the prediction of Fukuta–Xu is about 2.9 times larger than that of the cloud model, and that of Twomey about 1.3 times. The gap between the two analytical equations of the Maxwellian growth system appear
Ž .
to be due to the difference for r term handling in Eq. 3 . Fukuta–Xu does not follow the actual history of CCN-droplet growth and tends to underestimate the term making the supersaturation maximum larger relative to Twomey’s treatment.
Figs. 6 and 7 show the predicted maximum supersaturation as a function of updraft velocity for continental clouds. In Fig. 6, Cs2000 cmy3, ks0.4, and in Fig. 7,
Cs500 cmy3, ks0.7 are used. Each compares the results of two analytical solutions
Ž .0.7
with that of the cloud model. In Fig. 6, the predicted maximum supersaturation of Fukuta–Xu is about 2.5 times larger than those predicted by the cloud model, and the values of Twomey about 1.5 times. In Fig. 7, Fukuta–Xu gives the maximum supersatu-ration about 3.5 times larger than the cloud model does, and Twomey’s formula about 1.5 times larger. The result of these computations shown in Figs. 5–7 suggests that the ratio is a function of C and k but only slightly dependent on updraft velocity.
3.5. Correction factor and modified Fukuta–Xu formula
3.5.1. Difference of maximum supersaturation between analytical formulas and cloud model
We have shown in Section 3.4 that the maximum supersaturation predicted by Eq.
Ž37 shows some discrepancy with that predicted by the present cloud model. Eq. 39. Ž .
gives an even larger difference. There are three main reasons for such differences as explained in Section 3.2. What the analytical solutions fail to include are:
Ž .i the DK effect of droplet growth,
Ž .ii the finite size of haze particles at the moment of nucleation, which is due to the Kelvin and solute effects of the Kohler theory, and
¨
Ž .iii the delay of growth to cause nucleation sometime after passing through the critical supersaturation observed in the environment.
3.5.2. Correction factor for Fukuta–Xu formula
Although the analytical formulas show considerable difference for the maximum cloud supersaturation prediction compared with the results of the present cloud model, in practical cloud physics research, their clarity and convenience outweigh a complicated cloud model, which is time-consuming to build. Analytical formulas are still useful as
Ž .
long as the above gap is properly corrected. Though Eq. 37 predicts smaller values
Ž . Ž .
than that of Eq. 39 , the beta function B kr2, 3r2 in the former also causes some
Ž .
inconvenience in practical use. Eq. 39 , on the other hand, includes the variation of cloud base temperature and pressure change. Therefore, we will focus on improving the accuracy of the latter.
In the previous discussion, we have seen that the ratio of the maximum
supersatura-Ž .
tion predicted by the cloud model over that predicted by Eq. 39 is a function of b, a,
C, and k, but nearly independent of w . Therefore, we define a ratiou
Sy1
where S-1 max, DK, mod is the maximum supersaturation of cloud model using DK theory
Ž . Ž .
and S-1ma x, FX is that of Eq. 39
Ž . Ž .
Eq. 42 shows that once the ratio J C, k,a,b is determined, the maximum
Ž . Ž .
supersaturation can be accurately calculated by multiplying J C, k,a,b to Eq. 39 .
ŽS-1.ma x, FX or Eq. Ž39. contains no inconvenient parameters; it just requires the
Ž .
maritime clouds and ks0.7 for continental clouds are selected. Then J C, k,a,b is reduced into a two-variable function,
J C,0.5,1,1
Ž
b.
sJ C,1Ž
b.
for maritime cloudsJ2
Ž
C,0.7,1,b.
sJ2Ž
C,b.
for continental cloudsŽ . Ž . Ž .
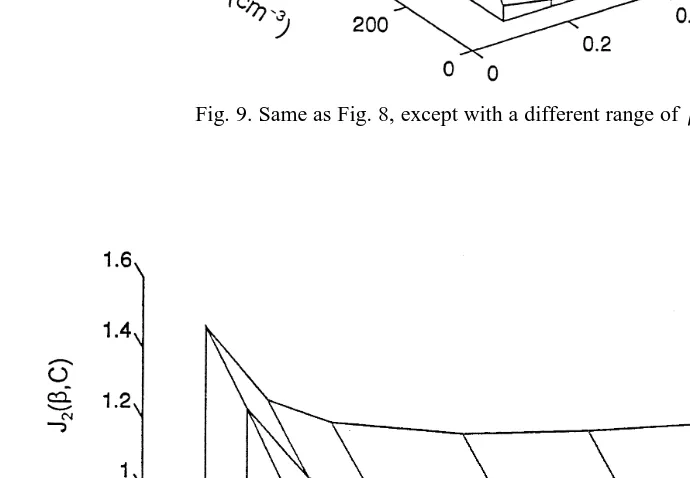
Using the present cloud model and Eq. 39 , J C,1 b and J C,2 b have been computed, and their relationship is shown in Figs. 8–11, in which b changes from 0 to
Ž .
1. As J C,b varies very rapidly with decrease of b, we plot the relationship in two separate figures, one with b from 0 to 0.1 and the other with b from 0.1 to 1.
Figs. 8 and 9 show the correction factor for maritime clouds. Fig. 8 ranges from
y3 Ž .
Cs100–1000 cm and bs0.01–0.1, and shows that J C,1 b changes smoothly with the C, and very slowly with b when b)0.08. However, it varies rapidly when
b-0.04. Fig. 9 describes the relationship for the range with Cs100–1000 cmy3 and
bs0.1–1.
Ž . y3
For continental cloud, Fig. 10 gives J C,2 b for the range Cs500–2500 cm and
bs0.01–0.1, and in Fig. 11, Cs500–2500 cmy3, but bs0.1–1.0.
Ž . Ž .
From Figs. 8–11, we see that both J C,1 b and J C,2 b increase with the increase
Ž .
of C but decrease with the increase of b. J C,b changes very rapidly as b™0 but
very slowly as b™1. This means that smaller b values are more sensitive to the
changes of the supersaturation maximum in cloud. In all of the above, we are
Ž . Ž .k
Fig. 9. Same as Fig. 8, except with a different range ofb:bs0.1–1.0.
Ž .
Fig. 11. Same as in Fig. 10, except forbs0.1–1.0.
Ž . Ž . Ž .
particularly interested in two special cases of J C,b ; J 100, 0.03 and J 500, 0.03 .1 2
Ž .
Computations for J C, k,a,b show that
J 100, 0.5, 1, 0.031
Ž
.
s0.881,J 500, 0.7, 1, 0.032
Ž
.
s0.916.Ž .
Then Eq. 39 is modified under the above conditions as
Sy1 s0.881 Sy1 for maritime clouds,
Ž
.
max , DK , modŽ Ž
.
max , FXand
Sy1 s0.916 Sy1 for continental clouds.
Ž
.
max , DK , modŽ Ž
.
max , FXThese provide simple but more accurate analytical formulas for practical use in calculating cloud maximum supersaturation.
3.6. AtmosphericÕariation of condensation coefficient
A major consequence of anthropogenic air pollution is the contamination of cloud liquid water and the air in which cloud forms. The emitted sulfur dioxide is particularly water soluble. Experiments show that water vapor and water droplets can strongly absorb the SO in air, and that causes serious difficulty in atmospheric SO measure-2 2 ments since water vapor condenses on the wall of the intake tubing of the SO2
Ž .
measurement devices Zou et al., 1992 . Actually, the polluted air contains not only SO2
the surface in particular. Once these chemical substances are contained in droplets through condensation growth or gas phase absorption, the surface property of droplets will change. One of the surface properties of droplets to affect the growth is the condensation coefficient and to an unknown extent the thermal accommodation coeffi-cient. Laboratory experiments demonstrated that some chemical substances in the atmosphere are able to drastically reduce the condensation coefficient of droplets to
y4 y3 Ž .
values as low as 10 –10 Mazin, 1974 . Experiments in the room air showed that
Ž .
the condensation coefficient reaches as low a value as 0.01 Hagen et al., 1989 . Most frequently, the value of condensation coefficient bs0.03 is used in cloud physics
ŽWarner, 1969; Fitzgerald, 1972, 1978; Young, 1993; etc ..
Ž .
According to Twomey 1977, 1991 , if clouds are able to cause a 2% change in global albedo, the heating effect of doubled CO2 increase can be countered by the cooling effect of aerosol and clouds. For assessing the cloud albedo effect in the radiative balance, what is needed is detailed knowledge of factors that contribute to the increase of negative forcing or the effect of DK droplet growth, together with that of CCN increase, against the positive forcing caused by various emissions of anthropogenic origins.
4. Conclusion
A central problem for the linkage among CCN change, droplet generation through activation-growth interaction, and cloud albedo variation is the evaluation of maximum
Ž .
supersaturation in clouds. Analytical equations of Twomey 1977 and Fukuta and Xu
Ž1996 are limited within the Maxwellian droplet growth process only, being unable to.
deal with the diffusion-kinetic droplet growth and haze process before activation. The latter equation gives too large values for the cloud supersaturation maximum while the beta function of the former causes some inconvenience in practical use. The Fukuta–Xu formula, which includes parameters of cloud base condition, is simple and slightly more convenient for cloud research. Therefore, a cloud model including the diffusion-kinetic effect and haze process before activation was constructed and the correction factor has been obtained for the formula in comparison with the model output. The cloud model generates maximum supersaturation change and cloud droplet number concentration and provides evidence that the condensation coefficient reduction effect of air pollution or the DK-effect for droplet number concentration increase results in cloud albedo enhance-ment.
5. List of symbols
Bi Beta function
cv specific heat of air at constant volume
cp specific heat of air at constant pressure
C constant describing CCN activity, condensation growth rate
es` saturation vapor pressure
Ž .
f r droplet size distribution function
g gravity acceleration
i van’t Hoff factor
J correction factor for Fukuta–Xu analytic formula
Ž .
k constant describing CCN activity, defined by Eq. 15
K thermal conductivity of air
l mean free path length
Lc specific latent heat of water vapor condensation
M molecular weight of water
MN molecular weight of dry nucleus substance
N cumulative number concentration of active CCN or droplet number concentration,
nj CCN or droplet number concentration of bin j,
p air pressure
p0 air pressure to start the condensation growth of dry particles
pb air pressure at the cloud base
q , q , qc r v mixing ratio of cloud water, liquid water and water vapor, respec -tively
q , qvs v0 saturated and initial mixing ratio of water vapor in cloud, respec -tively
r radius
rj radius of particles in bin j
rN radius of dry nucleus
rcritical critical radius of haze particles cloud albedo or reflectance
Ra the specific gas constant of air
Rv the specific gas constant of water vapor
S saturation ratio
ŽS-1. supersaturation
ŽS-1.critical critical supersaturation of Kohler curve
¨
ŽS-1.ma x, M supersaturation maximum generated by using Maxwellian equation
ŽS-1.ma x, DK supersaturation maximum generated by using DK equation
ŽS-1.ma x, DK, mod supersaturation maximum generated by the present cloud model
with DK droplet growth theory
ŽS-1.ma x, FX supersaturation maximum of Fukuta–Xu analytic formula
ŽS-1.ma x, PK supersaturation maximum of analytic formula modified by Prup
-Ž .
pacher and Klett 1978
ŽS-1.ma x, TW supersaturation maximum of analytic formula by Twomey 1959,Ž
.
1977
t time
T0 absolute temperature to start parcel ascent
Tb cloud base temperature
Td dew point temperature
T` absolute temperature of environmental air
wu updraft velocity
X molality of a solution droplet
z vertical distance
a thermal accommodation coefficient of air
X
Ž .
a s2ar 2ya
b condensation coefficient of water vapor
X
Ž .
b s2br 2yb
Ž .
g dry adiabatic lapse rate s0.988Cr100 m
G Gamma function
D mean free path length of Fuchs
Dt length of time step
´ MrMas0.622
u potential temperature
Ž .
p a parameter defined by Eq. 24
rL density of liquid water
ra density of air
rN density of dry ammonium sulfate
rsr saturation vapor density of droplet
rs` saturation vapor density at T`
Ž .
s supersaturation in dew point temperature excess Twomey, 1959 , surface tension
Acknowledgements
This study was supported by the Division of Atmospheric Sciences, National Science Foundation, under Grant ATM-9112888.
References
Arnason, G., Brown, P.S. Jr., 1971. Growth of cloud droplets by condensation: a problem in computational stability. J. Atmos. Sci. 28, 72–77.
Chapman, S., Cowling, T.G., 1970. The Mathematical Theory of Non-Uniform Gases. Cambridge Univ. Press, 422 pp.
Chen, J.-P., 1994a. Predictions of saturation ratio for cloud microphysical models. J. Atmos. Sci. 51, 1332–1338.
Chen, J.-P., 1994b. Theory of deliquescence and modified Kohler curves. J. Atmos. Sci. 51, 3505–3516.¨
Clark, T.L., 1974. On the modeling nucleation and condensation theory in Eulerian spatial domain. J. Atmos. Sci. 31, 2099–2117.
Clark, T.L., Hall, W.D., 1979. A numerical experiment on stochastic condensation theory. J. Atmos. Sci. 36, 470–483.
Fitzgerald, J.W., 1972. A study of the initial phase of cloud droplet growth by condensation: comparison between theory and observation. PhD Dissertation. Dept. of Geophys. University of Chicago, 144 pp. Fitzgerald, J.W., 1978. A numerical model of the formation of droplet spectra in advection fogs at sea and its
applicability to fogs off Nova Scotia. J. Atmos. Sci. 35, 1522–1535.
Fukuta, N., 1993. Water supersaturation in convective cloud. Atmos. Res. 30, 105–126.
Fukuta, N., Walter, L.A., 1970. Kinetics of hydrometer growth from a vapor-spherical mode. J. Atmos. Sci. 27, 1160–1172.
Fukuta, N., Xu, N., 1996. Nucleation-droplet growth interactions and microphysical property development in convective clouds. Atmos. Res. 41, 1–22.
Grabowski, W.W., 1989. Numerical experiments on the dynamics of the cloud-environment interface: small cumulus in a shear-free environment. J. Atmos. Sci. 46, 3513–3541.
Hagen, D.E., Schmitt, J., Trueblood, M., Carstens, J., White, D.R., Alofs, D.J., 1989. Condensation coefficient measurement for water in the UMR cloud simulation chamber. J. Atmos. Sci. 46, 803–816.
Ž .
Hobbs, P.V. Ed. , 1993. Aerosol–Cloud–Climate Interactions. Academic Press, San Diego, 233 pp. Howell, W.E., 1949. The growth of cloud droplets in uniformly cooled air. J. Meteorol. 6, 134–149. Hudson, J.G., 1993. Cloud condensation nuclei. J. Appl. Meteorol. 12, 596–607.
Ž .
IPCC Intergovernmental Panel on Climate Change , 1995. Radiative forcing of climate change. In: Houghton,
Ž .
J.T., Meira Filho, L.G., Bruce, J., Lee, H., Callander, B.A., Haites, E., Harris, N., Maskell, K. Eds. , Climate Change 1994. Cambridge Univ. Press, Cambridge, 1–231.
Ž .
Jaenicke, R., 1993. Tropospheric aerosols. In: Hobbs, P.V. Ed. , Aerosol–Cloud–Climate Interactions. Academic Press, San Diego, 235 pp.
Kohler, H., 1921. Zur Kondensation des Wasserdampfes in der Atmosphare, zerste Mitteilung. Geofys. Publ.¨ ¨ ¨
2, 3–5.
Korolov, A.V., 1995. The influence of supersaturation fluctuations on droplet size spectra formation. J. Atmos. Sci. 52, 3620–3634.
Leaitch, W.R., Strapp, J.W., Isaac, G.A., Hudson, J.G., 1986. Cloud droplet nucleation and scavenging of aerosol sulphate in polluted atmosphere. Tellus 388, 328–344.
Low, R.D.H., 1969. A generalized equation for the solution effect in droplet growth. J. Atmos. Sci. 26, 608–611.
Mason, B.J., 1971. The Physics of Clouds, 2nd edn. Oxford Univ. Press, London, 671 pp.
Mason, B.J., Chien, C.W., 1962. Cloud-droplet growth by condensation in cumulus. Q. J. R. Meteorol. Soc. 88, 136–142.
Mason, B.J., Jonas, P.R., 1974. The evolution of droplet spectra and large drops by condensation in cumulus clouds. Q. J. R. Meteorol. Soc. 100, 23–38.
Ž .
Mazin, I.P., 1974. Mechanism for droplet spectra formation. Izv. Atmos. Ocean. Phys. 10 4 , 379–386. Mordy, W., 1959. Computations of the growth by condensation of a population of cloud droplets. Tellus 11,
16–44.
Ochs, H.T., 1978. Moment-conserving techniques for warm cloud microphysical computations: Part II. Model testing and results. J. Atmos. Sci. 35, 1959–1973.
Politovich, M.K., Cooper, W.A., 1988. Variability of the supersaturation in cumulus clouds. J. Atmos. Sci. 45, 1651–1664.
Pruppacher, H.R., Klett, J.D., 1978. Microphysics of Clouds and Precipitation. Reidel, Boston, 714 pp. Robinson, N.F., 1984. The efficient numerical calculation of condensational cloud droplet growth. J. Atmos.
Sci. 28, 72–77.
Rogers, R.R., Yau, M.K., 1989. A Short Course in Cloud Physics, 3rd edn. Pergamon, 293 pp. Saxena, V.K., Fukuta, N., 1982. The supersaturation in fogs. J. Rech. Atmos. 16, 327–335.
Soong, S.T., 1974. Numerical simulation of warm rain development in an axisymmetric cloud model. J. Atmos. Sci. 31, 1262–1285.
Squires, P., 1952. The growth of cloud drops by condensation: I. General characteristics. Aust. J. Sci. Res., Ser. A 5, 66–68.
Twomey, S., 1959. The nuclei of natural cloud formation: Part II. The supersaturation in natural clouds and the variation of cloud droplet concentration. Geofis. Pura Appl. 43, 243–249.
Twomey, S., 1977. Atmospheric Aerosols. Elsevier, Amsterdam, 302 pp.
Twomey, S., 1991. Aerosols, clouds and radiation. Atmos. Environ. 25A, 2435–2442.
Twomey, S., Wojciechowski, T., 1969. Observations of the geographical variation of cloud nuclei. J. Atmos. Sci. 26, 684–688.
Xu, N., 1994. A study of maximum supersaturation in convective cloud with Maxwellian and diffusion-kinetic droplet growth theory. MS Thesis. Department of Meteorology, University of Utah.
Young, K.C., 1993. Effects of simplifications of the Kohler equation on the activation of CCN in an updraft. J.¨
Atmos. Sci. 50, 2314–2317.
Young, K.C., Warren, A.J., 1992. A reexamination of the derivation of the equilibrium supersaturation curve for soluble particles. J. Atmos. Sci. 49, 1138–1143.