BIG GEO DATA MANAGEMENT: AN EXPLORATION WITH SOCIAL MEDIA AND
TELECOMMUNICATIONS OPEN DATA
C.Arias Munoz*, M.A Brovelli, S.Corti, G.Zamboni
Department of Civil and Environmental Engineering, Politecnico di Milano, Como Campus, Via Valleggio 11, 22100 Como Italy - (carolina.arias, maria.brovelli, simone.corti, giorgio.zamboni)@polimi.it
Commission II, ThS 14 – Recent Developments in Open Data
KEYWORDS: User-generated communication traffic, Open Data, Big Geo Data, Twitter data
ABSTRACT:
The term Big Data has been recently used to define big, highly varied, complex data sets, which are created and updated at a high speed and require faster processing, namely, a reduced time to filter and analyse relevant data. These data is also increasingly becoming Open Data (data that can be freely distributed) made public by the government, agencies, private enterprises and among others. There are at least two issues that can obstruct the availability and use of Open Big Datasets: Firstly, the gathering and geoprocessing of these datasets are very computationally intensive; hence, it is necessary to integrate high-performance solutions, preferably internet based, to achieve the goals. Secondly, the problems of heterogeneity and inconsistency in geospatial data are well known and affect the data integration process, but is particularly problematic for Big Geo Data. Therefore, Big Geo Data integration will be one of the most challenging issues to solve. With these applications, we demonstrate that is possible to provide processed Big Geo Data to common users, using open geospatial standards and technologies. NoSQL databases like MongoDB and frameworks like RASDAMAN could offer different functionalities that facilitate working with larger volumes and more heterogeneous geospatial data sources.
1. INTRODUCTION
The term Big Data has been recently used to define big, highly varied, complex data sets, which are created and updated at a high speed and require faster processing, namely, a reduced time to filter and analyse relevant data. According to the 2013 IBM Annual Report (IBM, 2013), 2.5 billion gigabytes of data are created every day, and 80 percent of these data is everything from images, video, and audio, to social media, telecommunications data, and distributed devices, which are geo-referenced or can be geo-referenced. Specifically, geo-referenced Big Data or Big Geo Data is produced every day mainly from fixed and mobile sensors such as satellites, aircrafts, webcams, UAVs, location-based social networks such as Twitter, Volunteered Geographic Information or even citizens through their normal activities (Brovelli et al., 2015).
Big Data has, nevertheless, brought to attention many restrictions associated with a relational database management systems (Jacobs, 2008), especially when handling complex data formats. With the advance on data availability, in fact, scalability and flexibility have become major concerns (Vitolo et al., 2015).
The large volumes of unstructured or semi-structured data mentioned before, often cannot be represented in terms of relations. Next generation of databases need to have the capabilities to read, modify and update unstructured data sources without making copies but by versioning (geo) data and keeping track of the data source.
Big Data is gradually becoming Open Data, made public by the government, agencies, private enterprises, universities among others. Open Data, as defined in the Open Data Handbook is
“data that can be freely used, re-used and redistributed by anyone - subject only, at most, to the requirement to attribute and
* Corresponding author
sharealike” (Open Knowledge Foundation, 2012). With datasets growing larger and larger, the scientific community is finding that the limitation to access big data is no longer a lack of it but the difficulty to manage, analyse, and share these large datasets. Open Data can be the key of validation an reproducibility needed by the scientific community, and in the end, it can prevent the duplication of effort and resources (Gallagher et al., 2015).
At least two issues can obstruct the availability and use of Open Big Datasets: Firstly, the gathering and geoprocessing of these datasets are very computationally intensive; hence, it is necessary to integrate high-performance solutions, preferably internet based. Secondly, the problems of heterogeneity and inconsistency in geospatial data are well known and affect the data integration process, but is particularly problematic for Big Geo Data (Gao et al., 2013). Therefore, Big Geo Data integration will be one of the most challenging issues to solve.
This contribution presents two web applications of Big Geo Data management, which attempt to address these issues, using a freely available large telecommunications dataset from Telecom Italia. Both applications were implemented as demos, to test the technologies, specifically:
To create a data filtering or/and processing system that exchanges different data formats into one format To create an Interactive web map on the fly with the
processed data
This paper is organized into three main sections. The first section of this article introduces the open data used for the two applications. Sections three and four describes the Social Media Data Management with RASDAMAN and the Sensing the City, Calls, and Tweets applications respectively, their technical The International Archives of the Photogrammetry, Remote Sensing and Spatial Information Sciences, Volume XLI-B2, 2016
implementation and client side design. Finally, the last section concludes pointing to further future work.
2. THE TELECOM OPEN DATA
Telecom Italia together with, SpazioDati, MIT Media Lab, EIT ICT Labs, Polytechnic University of Milan, Northeastern University, University of Trento, Fondazione Bruno Kessler and Trento RISE have been organizing the Telecom Italia Big Data Challenge1, providing various geo-referenced and anonymized datasets. For the 2014 edition, they provided data for two Italian areas: the city of Milan and the Province of Trentino (Barlacchi et al., 2015). These data are available to the public under the Open Database License (ODbL) (https://dandelion.eu/datamine/open-big-data/).
From all the Telecom open data available, the used data corresponds to two months (November and December 2013) of mobile telecommunications and Twitter activity of the city of Milan. The datasets and variables are:
User-generated telecommunication traffic, corresponding to the result of computation over the Call Detail Records (CDRs)2 of Sent SMS, Received SMS, Incoming Calls, Outgoing Calls and Internet traffic
Number of calls issued between the city of Milan and the Italian provinces
Data derived from an analysis of georeferenced tweets (anonymized Twitter user, DBPedia entities, language, time stamp, location)
All Datasets have a temporal aggregation of ten minutes. Data is provided in a series of CSV files, each containing one day of records. Since the data come from different companies which have adopted different standards, their spatial distribution irregularity is aggregated in a square grid (100 columns by 100 rows) covering the city of Milan, with a square cell size of 235 meters and WGS84 projection (EPSG:4326). The Milano Grid is available in GeoJSON format (see Figure 1).
The CDRs records provided by Telecom Italia are not the real records; they are proportional values of the actual records, in order to provide anonymized data. To understand how these values were calculated, please refer to Barlacchi et al., 2015.
1http://www.telecomitalia.com/tit/en/bigdatachallenge/contest.html
2Every time a user engages a telecommunication interaction, a new CDR is created
recording the time of the interaction. CDRs log the user activity for billing purposes and network management.
Figure 1. Representation of the Milano grid, with d, = 235 meters3
On the CSV files, each record is related to a specific cell id of the Milano grid, in such a way that each record can be referenced to each grid cell. Once the data is represented spatially, it can be seen as a series of raster maps, one for each time stamp (i.e. 144 raster map per day for each variable).
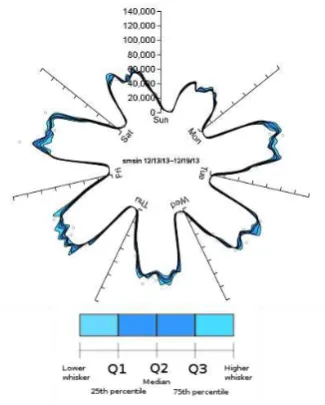
Figure 2. Received SMS from Friday, December 13th to Thursday, December 19th for all Milano grid cells
Figure 2 evidences a strong daily seasonality of receive SMS corresponding with working and non-working hours; the same behavior is observed for the rest of the variables (Calls, Internet connections, tweets) indicating a temporal human behavioral pattern. Likewise, there is a weekly seasonality between working days and weekends, with Sunday the day with less activity.
On the next sections, we describe how these data can be visualized and accessed using web applications, were data behavior can also be shown.
3Source: http://dandelion.eu/datagems/SpazioDati/milano-grid/description/ The International Archives of the Photogrammetry, Remote Sensing and Spatial Information Sciences, Volume XLI-B2, 2016
3. SOCIAL MEDIA DATA MANAGEMENT WITH RASDAMAN
Recently, RASDAMAN Database Management System has arisen as a scalable and cost-effective database solution to store and retrieve massive multi-dimensional raster data (arrays), such as a sensor, image or statistics data. RASDAMAN extends standard relational database systems with the ability to store and retrieve arrays through an SQL-style query language: RasQL (Baumannet al., 1999).
RASDAMAN conceptual model consists of multidimensional arrays with n-dimensions extend and cell type. Data storage relies on partitioning of the arrays into sub-arrays called tiles, which can be storage either in a relational database, in files in the data systems or archives of files that can be accessed externally.
In 2008 the Open Geospatial Consortium OGC included to its wide set of standards the Web Coverage Processing Service WCPS, which defines a protocol-independent language for the extraction, processing, and analysis of multi-dimensional coverages representing sensor, image, or statistics data (Open Geospatial Consortium, 2009). A part from the functionalities of the Web Coverage Service WCS, WCPS offer complex operations such as slicing or trimming, induced operations (arithmetic, exponential, trigonometric among others), condensers(count, avg, some, all), metadata extraction or reprojection (Aiordăchioaie, A. and Baumann, P., 2010).
For Web Coverage Service WCS and WCPS, RASDAMAN is the reference implementation. The RASDAMAN components devoted to the handling of the geospatial interface of arrays are:
Rasgeo: This application is used to ease the ingestion of georeferenced rasters into RASDAMAN, possibly stacked to compose 3D spatial or spatio-temporal cubes.
Petascope: The OGC services Java servlet; it relies on its own database of metadata and exposes RASDAMAN array data to the web. It leverages several open source geospatial and geometry libraries, as well as rasdaman data access libraries and relational database access components (PUBLICAMUNDI, 2013).
SECORE: The companion of Petascope and official OGC resolver for Coordinate Reference Systems (CRS); Petascope relies on this component to know all the semantics of the CRS space inside of which the coverages are defined.
Social Media Data Management with RASDAMAN is a web
application currently available at
http://landcover.como.polimi.it/socialmedia_rasdaman/index.ht ml. This web application allows not only to visualise, but also to download requested and filtered data. It is based on RASDAMAN Database Management System and the Web Coverage Processing Service (WCPS). The objective of this web application is to provide access to Telecommunications open data through the WCPS using free and open source software. This implies:
4globallandcover.com
5http://www.gdal.org/
6With the structure: [cellid, time stamp, country code, sms_in, sms_out, calls_in,
calls_out, internet] 7https://eclipse.org/ide/
Creating a data filtering and processing system that exchange different data formats into one format Creating a data cross query system that interrogates
For the WCPS cross queries, we include 2010 land use data from GlobeLand304 data project. This land use data includes ten land cover types including, “permanent snow and ice”, “wetland”,
“artificial cover”, “tundra”, “grassland”, “barren land”,
“croplands”“water bodies” ,“shrubland” and “forest” (Chen, J.,
et al., 2015). The cross queries between Telecommunications data and the land use data can be of the type: “obtain a raster map with the number of outgoing calls made in the artificial cover of
Milan”.
At the moment, RASDAMAN embeds GDAL library5 which supports a huge list of data formats. To import the data into RASDAMAN, data were transformed from the original csv files6 provide by Telecom, to a series of GeoTIFF files using a parser created in Eclipse integrated development environment7. Data were automatically parsed and imported into a specific collection (i.e. a set of multidimensional arrays) in rasgeo, using rasimport8. One collection was created for each of the Telecom data variables.
3.1 Technical Implementation
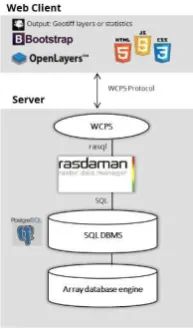
The application’s architecture can be summarized as in the following figure:
Figure 3. Social media data management with RASDAMAN Architecture
The application has the classical two-tier client/server architecture with processing made entirely on the server side. On the client side, the application is built on OpenLayers9, which is an open source, widely used Javascript web mapping framework, providing several map query capabilities. To build the web page we used the Bootstrap framework10.
8 The import/update utility of rasgeo. See:
http://www.rasdaman.org/wiki/RasgeoUserGuide 9http://openlayers.org/
10http://getbootstrap.com/
Regarding data storage, array data in RASDAMAN can reside in a conventional database, in files, or in some pre-existing archives. In our case, arrays are stored in a PostgreSQL11 database, were both the bulk data and the supplementary spatial semantics (coordinates, resolution, metadata) reside.
Data is made accessible over the web by the petascope component of RASDAMAN, translating incoming WCPS requests into RASDAMAN rasql queries, to efficiently fetch and process the storage array data. It then translates the output into png or GeoTIFF files, according to the request. The generic syntax of a WCPS request is:
for < ref_variable> in (< collection_name> ) return encode (
< some processing function using the ref_variable> , "< return format csv | png | jpg | tiff | netcdf | hdf > "
)
As an example of our application WCPS query, the following query returns the number of incoming sms (td2) received on November 16th 2013 over the artificial cover (milanocov, c = 5). The result is encoded in Geotiff format and on the defined extend:
for i in (td2), c in (milanocov) return encode( extend( i[ansi("2013-11-16")] *
c= 5,{Long(9.01149:9.31269),Lat(45.3563:45.5682)}), "tif" )
3.2 Client-side design
The web interface is divided into a series of panels that allow the creation of a WCPS query. The first panel allows setting the basic parameters of the WCPS query. On this panel users can (see figure 4):
Step 1: Select variable Step 2: Enter a date
Step 3: Specify the extend corners (bounding box) of the resulting map. The Milano Grid’s extend is the default.
Figure 4. WCPS query first panel
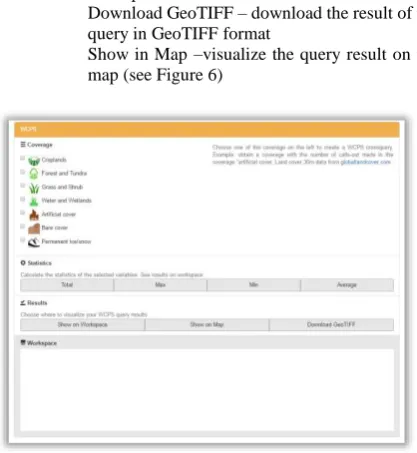
On the second WCPS panel (see figure 5) it is possible to set the rest of the query parameters, such as:
11http://www.postgresql.org/
Step 4: Choose one of the land coverages to create a WCPS cross query (i.e. obtain a map of the number of calls-out made in the coverage "artificial cover) Step 5: Statistics
Total – sum all values from all retrieved area Max – the max value in retrieved area Min – the min value in retrieved area
Count – the count the number of cells of retrieved area
Step 6: Results
Show on workspace - result portrait on the workspace window
Download GeoTIFF – download the result of the query in GeoTIFF format
Show in Map –visualize the query result on the map (see Figure 6)
Figure 5. WCPS query second panel
After submission of the query (pressing one of the buttons) the running WCPS query appears in the WCPS form. Under the interface, there are few examples of different queries to show the possibilities of the system. The application is easy to use, and it provides a valuable resource for accessing the Telecom Open data spatial datasets.
Figure 6. Social media data management web interface The International Archives of the Photogrammetry, Remote Sensing and Spatial Information Sciences, Volume XLI-B2, 2016
4. SENSING THE CITY, CALLS, AND TWEETS
MongoDB12 is an open-source, highly scalable NoSQL database management system featuring flexible data model and dedicated features for location-based data. In fact, MongoDB understands geospatial coordinates and natively supports geospatial indexing.
MongoDB, as all document databases, do the sql table-and-row model altogether by storing all relevant data together in single "document" in JSON, XML, or another format, which can nest values hierarchically.
Sensing the City, Calls, and Tweets is currently available at:
http://landcover.como.polimi.it/BGDV/ and its focus is
specifically on visualization of the number of calls issued between the city of Milan and the Italian provinces and the data derived from an analysis of georeferenced tweets (anonymized Twitter user, DBPedia entities, language, time stamp, location).
In this case, data did not need to be transformed. MongoDB natively supporting GeoJSON data allowed importing the Milano grid. Using the built-in function MongoImport. We imported the geographic features as individual objects, to avoid having a single document (of type FeatureCollection) in the MongoDB collection. The same function was used to import tweets and calls data.
4.1 Technical Implementation
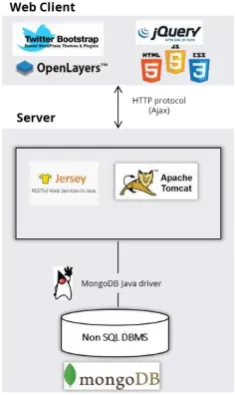
The application is based on a REST-based architecture, were everything is a resource that can be accessed via a common interface based on the HTTP standard methods (see figure 7). We built a REST server to provide access to the resources using Jersey13, an implementation of Java API for RESTful Web Services JAX-RS. Using the configuration standards of Jersey, we defined a mapping for generic URIs having the expression
“/rest” followed by an arbitrary sequence of characters as a
suffix. The base URI for our service is “/geodata”, while each method is associated to a dedicated path, containing parameters when needed.
Figure 7. Sensing the city architecture
12https://www.mongodb.org
13https://jersey.java.net/
Data is processed interacting with the MongoReader class, This class is designed to perform read operations on data and to send back textual responses that the web service will return to the client. The queries over the database collections are made with the MongoDB Java Driver, processing results and formatting them. Results are passed as content of HTTP responses as JSON strings, in such a way that our client is able to process them easily thought JavaScript.
MongoReader uses Aggregation Pipeline operation to calculate some values related to activities located in the same cell. Using this operation, MongoDB passes the documents of a single collection through a pipeline that transforms the documents into aggregated results.
Finally, the client side was built with jQuery and jQuery UI (version 1.11.1 and 11.1.4 respectively), Twitter Bootstrap (version 3.3.4) and OpenLayers (version 3.5.0).
4.2 Client- side design
The application’s web interface is divided horizontally: there is a map on top, centered and zoomed in the Milano area; on the bottom there is a control panel (to apply filters and create queries) and a log view (see figures 5 and 7). The map is loaded using basic functions of the OpenLayers API.
Figure 8. Client’s control panel
Data requests are performed asynchronously using jQuery’s Ajax method, to which we assigned as URL parameters the REST URIs listed in the web service. In particular, as the document is loaded and ready ($(document).ready() method of jQuery), an asynchronous request triggers the web service to send the whole
Milano grid GeoJSON, which is then parsed using OpenLayers’
API and displayed as a new layer on the map. A pop-up window shows up when clicking on a cell, displaying the associated cell ID.
To visualize voice traffic records, users must perform the following filtering steps:
Step 1: Select province
Step 2: Select year, month and day
Step 3: Adjust time range of a day (00:00 - 23:55) Step 4: Choose the direction of the voice traffic (Milano to Province or Province to Milano)
Step 5: Select a statistic to calculate (average, sum or maximum number)
For tweets data, the steps are:
Step 1: Select the importance value14 (not specified, medium, low, none)
14The importance value is assign by Twitter
Step 2: Select the Twitter user’s identity (not specified, not verified, or verified) i.e. retrieve only tweets posted by verified users
Step 3: Select a language
Voice calls and Tweets data are returned by the web service as JSON objects. Therefore, the JavaScript code works very effectively to parse and process them. Each JSON object contains information associated with a particular cell on the grid (using their ID value to retrieve them); taking advantage of the styling possibilities of OpenLayers, the cells are individually processed) to assign them a specific color. The color computation is performed by a JavaScript function accordingly with the values returned in the JSON: the average “stp” or “pts” values of voice calls data and the count of tweets matching the filtering criteria for geo-Tweets.
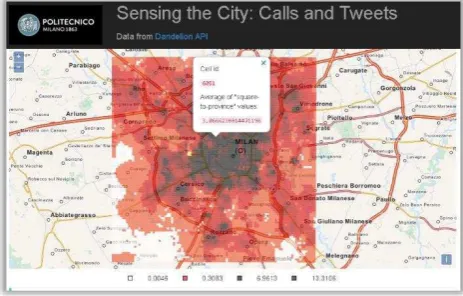
Figure 9. Sensing the city web interface. Data printed on grid: voice traffic from Milano towards Milano from Fri Nov 01
2013 00:00:00 GMT+0100 to Fri Nov 01 2013 23:55:00 GMT+0100
The Log Panel, pictured below, displays the latest operation performed by the client, also specifying the filters applied.
Figure 10. Client’s log panel
5. CONCLUSIONS
This contribution presents two web applications of Big Geo Data management, using a freely available large telecommunications dataset from Telecom Italia. We demonstrate the feasibility of employing web services as WCPS for data handling. Setting apart the concern for big volumes of data, we have described how web services can be used to reduce the necessary time to download, and filter the data sets for processing or modeling.
Made these datasets available throught web services greatly reduce the necessary time to download, and use for processing or modelling. In terms of coverage/arrays web services, it is clear that WCS provides only limited query capabilities other than basic filtering and subsetting, WCPS is robust enough to allow any processing of raster data, including complex calculations such as the vegetation index, temperature curves, among others.
As immediate and on-demand geoinformation and processing is
the overall goal, we find that the applications’ performance is
sufficient, the response time for generating maps is of the order of miliseconds.
The web applications presented in this paper can easily be extended and integrated with other systems because of its structure and flexibility, demonstrating once again the advances of free and open sourced web tools to provide web based applications.
On future research RASDAMAN should be examined and compared with other similar approaches, including file-based systems, NoSQL databases (e.g., MongoDB or CouchDB) and relational databases (e.g., PostgreSQL/PostGIS).
With these applications, we demonstrate that is possible to provide processed Big Geo Data to common users, using open geospatial standards and technologies. NoSQL databases like MongoDB and frameworks like RASDAMAN could offer different functionalities that facilitate working with larger volumes and more heterogeneous geospatial data sources.
ACKNOWLEDGEMENTS
The authors wish to acknowledge computer-engineering students Anna Trofimova, Emanuele Mariani e Jacopo Mossina from Politecnico di Milano, for their significant contribution to this work.
REFERENCES
Aiordăchioaie, A., Baumann, P., 2010. PetaScope: an open -source implementation of the OGC WCS geo service standards suite, in: Scientific and Statistical Database Management. Springer, pp. 160–168.
Barlacchi, G., De Nadai, M., Larcher, R., Casella, A., Chitic, C., Torrisi, G., Antonelli, F., Vespignani, A., Pentland, A., Lepri, B., 2015. A multi-source dataset of urban life in the city of Milan and the Province of Trentino. Sci. data 2, 150055. doi:10.1038/sdata.2015.55
Baumann, P., 2009. Web Coverage Processing Service (WCPS) Language Interface Standard.,(OGC 08-068r2).
Baumann, P., Dehmel, A., Furtado, P., Ritsch, R., Widmann, N., 1999. Spatio-temporal retrieval with RasDaMan, in: VLDB. pp. 746–749.
Baumann, P., Dehmel, A., Furtado, P., Ritsch, R., Widmann, N., 1999. Spatio-temporal retrieval with RasDaMan, in: VLDB. pp. 746–749.
Brovelli, M.A., Zamboni, G., Arias Muñoz, C., 2015. From paper maps to the Digital Earth and the Internet of Places. Rend. Lincei 26, 97–103. doi:10.1007/s12210-015-0437-y
Chen, J., Chen, J., Liao, A., Cao, X., Chen, L., Chen, X., He, C., Han, G., Peng, S., Lu, M., 2015. Global land cover mapping at 30m resolution: A POK-based operational approach. ISPRS J. Photogramm. Remote Sens. 103, 7–27.
Gallagher, J., Orcutt, J., Simpson, P., Wright, D., Pearlman, J., Raymond, L., 2015. Facilitating open exchange of data and information 721–739. doi:10.1007/s12145-014-0202-2
Gao, S., Li, L., Goodchild, M.F., 2013. A Scalable Geoprocessing Workflow for Big Geo-Data Analysis and Optimized Geospatial Feature Conflation based on Hadoop. 2013 CyberGIS All Hands Meet.
IBM, 2013. 2013 IBM Annual Report - What will we make of this moment ? 1–154.
Jacobs, A., 2008. The Pathologies of Big Data. asmqueve. doi:1536616.1536632
Open Geospatial Consortium, 2009. Web Coverage Processing Service (WCPS) Language Interface Standard.
Open Knowledge Foundation, 2012. Open Data Handbook [WWW Document]. URL http://opendatahandbook.org
PUBLICAMUNDI, 2013. Publicamundi: Scalable, Reusable Open Geospatial Data. Deliverable D3.1 [WWW Document].
URL
http://www.publicamundi.eu/wp-content/uploads/2013/09/D3.1.pdf
Vitolo, C., Elkhatib, Y., Reusser, D., Macleod, C.J.A., Buytaert, W., 2015. Web technologies for environmental Big Data. Environ. Model. Softw. 63, 185–198.