3D RECONSTRUCTION OF BUILDINGS WITH GABLED AND HIPPED STRUCTURES
USING LIDAR DATA
H. Amini a, *, P. Pahlavani b, Karimi, Rc
a Department of Civil and Geomatics Engineering, Tafresh State University, Tafresh, Iran- [email protected] b Center of Excellence in Geomatics Eng. in Disaster Management, Dept. of Surveying and Geomatics Eng., College of Eng.,
University of Tehran, Tehran, Iran- [email protected]
c Civil Engineering faculty, Tafresh State University, Tafresh, Iran- [email protected]
KEY WORDS: LiDAR data, feature, Support Vector Machine (SVM), 3D reconstruction, intersection
ABSTRACT:
Buildings are the most important objects in urban areas. Thus, building detection using photogrammetry and remote sensing data as well as 3D model of buildings are very useful for many applications such as mobile navigation, tourism, and disaster management. In this paper, an approach has been proposed for detecting buildings by LiDAR data and aerial images, as well as reconstructing 3D model of buildings. In this regard, firstly, building detection carried out by utilizing a Supper Vector Machine (SVM) as a supervise method. The supervise methods need training data that could be collected from some features. Hence, LiDAR data and aerial images were utilized to produce some features. The features were selected by considering their abilities for separating buildings from other objects. The evaluation results of building detection showed high accuracy and precision of the utilized approach. The detected buildings were labeled in order to reconstruct buildings, individually. Then the planes of each building were separated and adjacent planes were recognized to reduce the calculation volume and to increase the accuracy. Subsequently, the bottom planes of each building were detected in order to compute the corners of hipped roofs using intersection of three adjacent planes. Also, the corners of gabled roofs were computed by both calculating the intersection line of the adjacent planes and finding the intersection between the planes intersection line and their detected parcel. Finally, the coordinates of some nodes in building floor were computed and 3D model reconstruction was carried out. In order to evaluate the proposed method, 3D model of some buildings with different complexity level were generated. The evaluation results showed that the proposed method has reached credible performance.
* Corresponding author.
1. INTRODUCTION
3D reconstruction of urban area using remote sensing and photogrammetry data has a lot of applications such as mobile navigation, environment simulation, urban planning, and tourist, as well as many other applications. LiDAR is a powerful system in photogrammetry and remote sensing and it is a worthy source in order to collect 3D point cloud with high accuracy and to rate from the urban regions. Before the reconstruction, detecting buildings would be needed. Combining aerial images and LiDAR data is very effective for classifying urban objects with high accuracy and precision.
In the recent decade, many researches have been studied to detect and classify LiDAR data and aerial images. Moussa & EI-Shemy (2012) filtered point cloud in order to separate ground and non-ground points, and accordingly, divided them into trees and buildings using the Normalized Difference vegetation Index (NDVI). Zhao & You (2012) extracted the DTM using a progressive morphological filter (Zhang et. al., 2003). Then devided non-ground objects into trees and buildings using convexity and flatness parameters. They detected road network by scanning region using some templates with various size and direction. Also, the algorithms such as k-means clustering, fuzzy k-k-means clustering, as well as region growing based on slope (Alharty & Bethel, 2004) and normal vectors were utilized for classification data (Zhang et. al, 2009; Wang & Chu, 2009). Two different approaches are existed to reconstruct buildings (Mass & Vosselman, 1999). The first one
reconstruction buildings. In this regard, the slope change regions were recognized to separate roof plates. Then the corners of building were obtained by calculating the intersection of detected plates. Finally, the models of plates were merged to reconstruct the final 3D model of buildings.
This study is organized as follow. The proposed approach to detect buildings and reconstruct 3D models are explained in section 2. In section 3 the experiment results are presented, and in section 4, the conclusion is represented.
2. PROPOSED METHODOLOGIES
In this section, firstly, an approach is illuminated in order to classify data in section 2.1, and then the proposed approach for 3D reconstruction is explained in section 2.2.
2.1 Building Detection
Building detection is carried out in two sections. At first, the utilized features in this study are introduced with their abilities and characteristics for collecting training data (Section 2.1). Then SVM algorithm is illustrate clearly in Section 2.2.
2.1.1 Generating Features
Building detection by using supervised systems need the training data, because, these systems decide about a pixel entity by considering feature vectors of that pixel. Accordingly, the features that are effective for detecting considered objects should be selected. Actually, suitable knowledge about textural, geometrical, and structural characteristics of objects would be needed to choose appropriate features. In this paper, five features were selected and produced using LiDAR data and aerial images in order to detect buildings in urban areas. The first feature is intensity image of LiDAR data. This feature has approximately same values for objects with similar gender. This means this feature is only sensitive to objects gender in a way having similar values in two various objects would be possible because of their genders. The second feature is the normalized Digital Surface Model (nDSM). This feature contains the off-terrain objects, which are equal to the difference between the DSM and the DTM. In this paper, the morphological reconstruction based on geodesic dilation was utilized to produce the nDSM. In this regard, range image of LiDAR is specified as Mask (I) and a Marker (J) is computed according to Eq. (1) (Arefi & Hahn, 2005).
,
J I h (1) where h is determined according to object elevation of considered region. Subsequently, the morphological reconstruction based on geodesic dilation is carried out as operator. The procedure would be continued until achieving the stability. Finally, nDSM is computed by Eq. (3) (Arefi & Hahn, 2005).
,
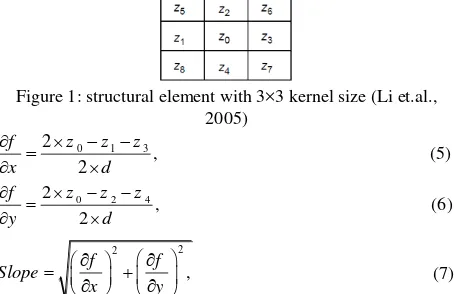
nDSM I Rim (3) where Rim is the reconstructed image. The third feature is the NDVI, which is the most well-known vegetation index and is very sensitive to chlorophyll. Because, chlorophyll strongly absorb visible light and strongly reflect near infrared light. slope, a structural element with 3×3 kernel size (Figure 1) was used (Eqs. 5-7) (Li et.al., 2005)
Figure 1: structural element with 3×3 kernel size (Li et.al., 2005) Finally, the fifth feature is roughness which is used to determine the texture of surface by computing the proportion between the vertical changes on considered surface and the flat surface. Whatever this feature has less value, smoother the surface would be and vice versa. The introduced structural element (Figure 1) is utilized in order to compute the roughness by uttilizing range image of LiDAR as follow:
1 2 3 4 5 6 7 8 9 collected by an operator. This is very important that the training data don’t have any mistake. Existence any mistake in training data decreases the detection results accuracy and procedure encounters a problem. Training data should contain the pixels of building and non-building.
2.1.2 Support Vector Machines
The theory of Support Vector Machines (SVMs) was proposed in 1965 by Vladimi. SVMs are supervised learning algorithms which recognize pattern and analyze data. They have been utilized for regression and classification. Assume some training data is existed that contains a set of n points as follows (Taylor, 2000):
1 {( i, i | i , i { 1,1})}ni .
D x y x R y (10) The goal is finding the maximum-margin to divide data into two groups. The first group has yi=1 and the other one has yi=-1. The points of each group have maximum distant with the points of the other one. The hyperplanes can be a set of point x according to Eq. (11) (Taylor, 2000):
: 0,
H w x b (11) where w is the normal vector to the hyperplane, b is the bias, and H is the hyperplnae that is identified for separating data. If separating the training data using linear equations would be possible, selecting two planes that divide data without any point between them could be possible. The bounded region, called margin should be minimized. The hyper planes equation is as follows: (Taylor, 2000).
1: 1,
The distant between computed hyperplanes is equal to 2 Lagrange multiplier is formed [Eq. (14)]. By placing derivatives equal to zero and using its result in Eq. (14), an equation, called Wolf dual [Eq. (15)] is produced (Taylor, 2000).
2 calculated by Eq. (16) and decision function for classification is obtained using Eq. (17) (Taylor, 2000): additional variable is used to form a primal Lagrange multiplier [Eq. (18)] (Taylor, 2000): between the marginal separating and the training data. If C has a small amount, the number of support vectors is increased. But, if C has a large value, over-fit is happened on training data. When the distribution of class is none-linear, the data transforms into space with higher dimension with a none-linear function as a kernel to classify data in this space. There are some kernels such as linear, polynomial, hyperbolic tangent, and radial basic function.
In this paper the collected training data are utilized as input of SVM with radial basic function kernel to train system. Then the trained SVM is used to detect building using input features.
2.2 3D Reconstruction
In this section, the proposed approach to reconstruct 3D model is explained completely. In Section 2.3.1, the planes of building roofs are separated and neighbor plates are recognized. The corners of each plate are computed in section 2.3.2. Finally, in Section 2.3.3, the extracted corners are connected to reconstruct the building.
2.2.1 Separating the planes of the roof
The result of building detection using SVM for each area is a binary image. In this image, the pixels which are equal to 1 indicate buildings and the other pixels that are equal to 0 indicate non-building regions. Thus, the detection result is labelled to separate buildings from each other. The height of
hipped and gabled roofs is increased initially and then is decreased; after reaching the maximum height (ridge line). In this regard, in order to separate planes, a labelled parcel which belongs to a building with hipped or gabled roof is evoked and multiplied to the horizontal slope [Eq.(5) ]. Then a ribbon with 1×5 kernel size is introduced to scan the building parcels in horizontal direction for finding the ridge lines. In each scan, if negative and positive slope values are exist in ribbon simultaneously, the central pixel will be equal to 1 and otherwise, the central pixel will be equal to 0. Subsequently, this procedure is repeated in vertical direction to extract ridge line, completely. After acquiring ridge lines, these pixels are eliminated from building parcels to separate roof planes. Finally, the separated planes are labeled and the adjacent planes are identified to produce adjacent matrix. The adjacent matrix causes to decrease the calculation volume and increase the accuracy. Because, when the adjacent planes are known, the only adjacent planes will be used to find corners as explained in the next section.
2.2.2 Computing corner coordinates
At least, three points are needed to generate a plane. This means if three points with 3D coordinates of a roof plane would be existed; it is possible to compute its plane parameters. Each separated roof planes (Section 2.3.1) has more than three points. Hence, the coefficients of each plane are computed by all points of each plane using linear polynomial curve. The goal of this paper is 3D reconstruction of buildings with hipped and gabled roofs. The proposed approach to find outline of these two roof types are explained individually:
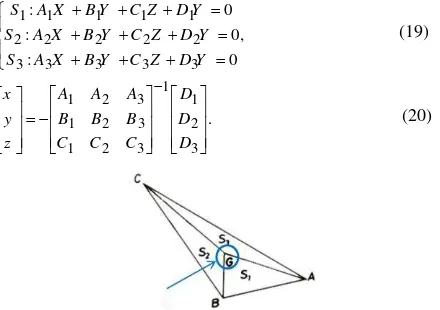
Hipped: Each point on top of the hipped roof is the intersection of three adjacent pages (Figure 2). So, the coordinates of these nodes can be achieved by using coefficients (Ai, Bi, Ci, Di|
Figure 2: Three adjacent planes and their intersection
Figure 3: Intersection between bottom plane and top planes
The bottom plane only has height (z direction) without any value in x and y direction. Accordingly, for computing the bottom plane coefficients, minimum height of upper plane is found. Then the intersection between planes is calculated by Eqs. (19) and (20).
Gabled: In these buildings, usually there are only two planes that have intersection with together. So, there is no intersection between planes. This means that with two planes, the intersection nodes of outline (Figure 4) can not be detected (red circle in Figure 4) and a line (intersection line) without end nodes can be achieved (Figure 4).
Figure 4: Intersection line of two planes
The intersection between intersection lines and boundary of each plane parcels is utilized to determine lines of end nodes intersection for detecting building outline. The extracted points which are closer together more than a specified threshold are removed and would be replaced by their mean value.
2.2.3 Connecting extracted nodes and reconstructing model
After computing the corners of each plane, these nodes should be connected together regularly to reconstruct each plane. If two nodes are connected together wrongly, each plane formed incorrectly. Thus, connecting extracted nodes is very important. In this regard, the nodes are connected randomly at first. Then if the lines of the constructed polygon cut together, another sort of nodes is chosen. The procedure is carrying out till achieving a polygon without any wrong intersection. Subsequently, the generated polygon of each plane are merged together to reconstruct the final roof model. Constructing buildings need the height of nodes in the floor. Hence, a buffer zone is specified around each node to find minimum height of range image in the buffer zone.
3. EXPERIMENT
To do experiment, firstly, the test data are presented in Section 3.1. Then the proposed approach is implemented and the results of classification are presented in Section 3.2, and finally, the results of 3D reconstruction are represented in Section 3.3. 3.1 Test Data Set
ISPRS published a test data-set as a benchmark in which the researchers can evaluate their methods and compare the results with each other. This data-set contains aerial images and LiDAR data and carried out by German Association of Photogrammetry and Remote Sensing (DGPF) from Vaihingen in Germany. The aerial images contain three bands including red, green, and near infrared with 11 bits radiometric resolution and 8cm ground resolution. The LiDAR data have 10 strips with 30% overlapping and 7 or 8 point/m2 in overlap regions
and 4 point/m2 in individual regions. Each area has unique characteristics as the proposed approach can be evaluated completely. Figure 5 shows the two test areas and their boundaries.
(a) (b)
Figure 5: Test data set, (a) Area 1, (b) Area 2
3.2 Building Detection
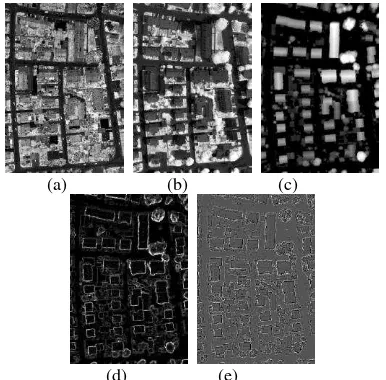
According to Section 2.1.1, implementing the approach to detect building begins by generating introduced features using LiDAR data and aerial images. Figures 6 and 7 show the produced feature for Areas 1 and 2.
(a) (b) (c)
(d) (e)
Figure 6: The produced features of Area1, (a) Intensity image of LiDAR, (b) NDVI, (c)nDSM, (d) Slope, (e) Roughness.
(a) (b) (c)
(d) (e)
Figure 7: The produced features of Area2, (a) Intensity image of LiDAR, (b) NDVI, (c)nDSM, (d) Slope, (e) Roughness.
Objects
Training Data
Area1 (pixel) Area2(pixel)
building 255 162
non-building 341 764
Table 1: The number of training data for each area
The selected training data were utilized in SVM algorithm to detect buildings in test areas. In order to evaluate building detection results three parameters such as completeness, correctness and quality are computed as follow (Rottensteiner et al., 2013):
, TP Completeness
TP FN
(21)
,
TP Correctness
TP FP
(22)
,
TP Quality
TP FP FN
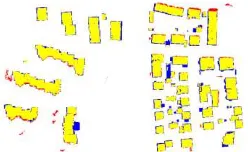
(23) where, TP is the number of pixels which have been detected correctly, FP is the number of pixels which have been detected wrongly, and FN is the number of pixels which not have been recognized. Figure 8 shows evaluation parameters schematically and Table 2 represents the evaluation results based on Eqs. (21), (22), and (23).
Quality Assessment
Building Area 1 Area 2 Completeness 87.87% 80.40% Correctness 93.96% 94.49% Quality 83.17% 76.80% Table 2: Evaluation results of building detection
Figure 8: Evaluation results schematically (yellow: TP, red: FP, blue: FN)
According to Table 2 and ISPRS report (Rottensteiner et al., 2013), the ulitized approach has very good performance for building detection.
3.3 3D Reconstruction
The proposed approach to reconstruct building is implemented separately for each building. Some reconstructed buildings are presented in Figures 9-12.
(a) (b) (c) (d)
(e) (f)
Figure 9: The reconstructed building, (a) detected parcel, (b) ridge line with boundary, (c) separated planes of roof, (d) the roof corners, (e) 3D model, (f) Reconstructed 3D model on
range image of LiDAR
(a) (b) (c) (d)
(e) (f)
Figure 10: The reconstructed building, (a) detected parcel, (b) ridge line with boundary, (c) separated planes of roof, (d) the roof corners, (e) 3D model, (f) Reconstructed 3D model on
range image of LiDAR
(a) (b) (c) (d)
(e) (f)
Figure 11: The reconstructed building, (a) detected parcel, (b) ridge line with boundary, (c) separated planes of roof, (d) the roof corners, (e) 3D model, (f) Reconstructed 3D model on
range image of LiDAR
(a) (b) (c) (d)
Figure 12: The reconstructed building, (a) detected parcel, (b) ridge line with boundary, (c) separated planes of roof, (d) the roof corners, (e) 3D model, (f) Reconstructed 3D model on
range image of LiDAR
4. CONCLUSION
This paper proposed an approach to detect and reconstruct building using LiDAR data and aerial images. In this regard, five features were produced. Then some training data was selected from features. The training data contained building and non-building pixels and they were collected with high accuracy. The training data was used as input of SVM for detecting buildings. Evaluating detection results by ISPRS reference data showed that the utilized approach has very good performance. The detected buildings were labelled to reconstruct 3D model of buildings individually. By specifying a ribbon, the regions that have slope change direction were recognized for detecting building boundaries and ridge lines. Recognizing ridge lines and boundaries caused to separate roof planes. The corners of hipped roofs were obtained by computing the intersections among each three adjacent planes. Also, the corners of gabled roofs were computed by finding the intersections between separated roof planes and intersection line of two adjacent planes. Subsequently, the computed nodes were connected correctly with an approach. Finally, 3D model of the building was acquired by both reconstructing each roof planes and merging them. The proposed approach for 3D reconstruction has reached credible performance regarding to different buildings. Moreover, this approach didn’t use some methods like Hough and RANSAC to estimate ridge line or boundaries and this caused to reduce the complexity the computational volume.
REFERENCES
Alharty, A., & Bethel, J., 2004. Detailed building reconstruction from airborne laser data using a moving surface method. IAPRS international archive of photogrammetry and remote sensing, pp. 213-219.
Arefi, H., & Hahn, M., 2005. A morphological reconstruction algorithm for separating off-terrain points from terrain points in laser. International Archives of Photogrammetry, Remote Sensing and Spatial Information Sciences 36.
Arefi, H., & Reinartz, P., 2013. Building Reconstruction Using DSM and Orthorectified Images. 1681–1703.
Chen, D., & Zhang, L., 2012. Urban building roof segmentation from airborne lidar. International Journal of Remote Sensing 33(20), 6497-6515.
Kabolizade, M., Ebadi, H., & Mohammadzadeh, A., 2012. Design and implementation of an algorithm for automatic 3d reconstruction of building models using genetic algorithm international. International Journal of Applied Earth Observation and Geoinformation, Vol. 19,pp.104–114.
Li, Z., Zhu, Q., & Gold, C., 2005. Digital terrain modeling: principles and methodology. CRC press.
Mass, H., & Vosselman, G., 1999. Two algorithms for extracting building models from raw laser altimetry data. ISPRS Journal of Photogrammetry & Remote Sensing, 54(2-3): 153-163.
Moussa, A., & EI-Shemy, N., 2012. A new object based method for automated extraction of urban object from airborne sensors data. Remote Sensing and Spatial Information Sciences (pp. Vol.XXXIX, Part B,). Melbourn, Australia: ISPRS Annals of the Photogrammetry.
Niemeyer, J., Mallet, C., Rottensteiner, F., & Sörgel, U., 2013. Classification of urban LiDAR data using conditional random field and random forests. Proceedings of the JURSE. São Paulo – Brazil.
Perera, S., Nalani, H., & Maas, H., 2012. Anautomatedmethodfor 3D roof outlinegeneration and regularizationinairbornelaserscannerdata. ISPRS Annals of the Photogrammetry, Remote Sensing and Spatial Information Sciences, (pp. Volume I-3). Congress, Melbourne, Australia.
Rabbani, T., & Van Den Heuvel, F. (2005). Efficient hough transform for automatic detection of cylinders in point clouds. ISPRS WG III/3, III/4 3, 60-65.
Rottensteiner, F., 2003. Automatic generation of high-quality building models from Lidar data. IEEE Computer Graphics and Applications 23(6), pp. 42-51.
Rottensteiner, F., Sohn, G., Gerke, M., Wegner, J., Breitkopf, U., & Jang, J., 2013. Results of the ISPRS benchmark on urban object. ISPRS Journal of Photogrammetry and Remote Sensing.
Tarsha-Kurdi, F., & Landes, T., 2007. Hough-transform and extended ransac algorithms for automatic detection of 3d building roof planes from lidar data. International Archives of Photogrammetry, Remote Sensing and Spatial Information Systems 36, 407-412.
Taylor, J., 2000. An Introduction to Support Vector Machines and Other Kernel-Based Learning Methods. Cambridge, Cambridge University Press.
Vosselman, G., & Dijkman, S., 2001. 3D building model reconstruction from point clouds and ground plans. InternationalArchives of the Photogrammetry (pp. 3/W4, Vol. 34). Annapolis, MA, USA: Remote Sensing and SpatialInformation Sciences.
Wang, L., & Chu, C., 2009. 3D building reconstruction from LiDAR data.In Systems. Man and Cybernetics, SMC., pp.3054-3059.
Zhang, K., Chen, S., Whitman, D., Shyu, M., Yan, J., & Zhang, C., 2003. A progressive morphological filter for removing non-ground measurements from airborne LIDAR data. IEEE Trans. on Geoscience and Remote Sensing, pp. 872-882.
Zhang, K., Yan, J., & Chen, S., 2009. Automatic 3D building reconstruction from airborne lidar measurements. Urban Remote Sensing Event,, (pp. pp.1-5). Shanghai.