QUALIFICATION OF POINT CLOUDS MEASURED BY SFM SOFTWARE
Kazuo Oda, Satoko Hattori, Hiroyuki Saeki, Toko Takayama, Ryohei Honma
Asia Air Survey Co., Ltd. (kz.oda, stk.hattori, jan.saeki, tk.takayama, ryh.honma)@ajiko.co.jp
Commission V
KEY WORDS: Five Point Algorithm, Relative Orientation, UAV
ABSTRACT:
This paper proposes a qualification method of a point cloud created by SfM (Structure-from-Motion) software. Recently, SfM software is popular for creating point clouds. Point clouds created by SfM Software seems to be correct, but in many cases, the result does not have correct scale, or does not have correct coordinates in reference coordinate system, and in these cases it is hard to evaluate the quality of the point clouds. To evaluate this correctness of the point clouds, we propose to use the difference between point clouds with different source of images. If the shape of the point clouds with different source of images is correct, two shapes of different source might be almost same. To compare the two or more shapes of point cloud, iterative-closest-point (ICP) is implemented. Transformation parameters (rotation and translation) are iteratively calculated so as to minimize sum of squares of distances. This paper describes the procedure of the evaluation and some test results.
1. INTRODUCTION
Recently, SfM (Structure-from-Motion) software is popular for 3D reconstruction and point cloud generation. SfM applications, such as Smart3DCaputure, PhotoScan, and Pix4D, are convenient for non-professional operator of photogrammetry, because these systems only require sequence of photos to generate point clouds with colour index which corresponds to the colour of original image pixel where the each point is projected. If the condition of capturing image is well-done, the result seems to be quite accurate. However, in many cases, the result is not constructed with correct scale or correct coordinates in reference coordinate system.
Basically, the quality of the point clouds created by dense image matching of SfM software should estimate by comparing true point cloud or more precise point cloud. In some cases, point cloud data measured by a laser scanner are adopted. But in many cases, laser scanner data do not have sufficient precision for, such as small objects. If the objects are on a cliff and hard to be accessed, measuring by TLS (Terrestrial Laser Scanner), might be impossible.
We focused on the evaluation of correctness of shape of the point cloud created by SfM. Even if it does not have correct scale, the shape of the object might be correct. To evaluate this correctness, we propose the difference of point clouds with different source of images. It the shapes of the point clouds with different source of images is correct, two shapes of different source might be almost same.
To compare the two or more shapes of point cloud, iterative-closest-point (ICP) is implemented by Besl et al., 1992 and Takai et al., 2013. Transformation parameters (scale, rotation, and translation) are iteratively calculated so as to minimize sum of squares of distances. If the shape of the point cloud is correct, the distances of corresponding points between the two point clouds are expected to be small. Distance in ICP should be determined as the distance between a point of one point cloud and its nearest face of the other point cloud. The distances of the
two point clouds reflect the error of the two point clouds’ shapes. This method can be applied for point clouds without correct scale.
This evaluation cannot be applied for some cases. One is the case that the object is isotropic like a sphere, or the case that the object is planar. This means that the method should check the anisotropy of the object by statistical analysis of distribution of normal vectors.
This ICP optimization and error estimation can also be used for extracting the part of deformation of the shape.
2. QUALIFIATION METHOD
The qualification method follows the procedure shown in Figure 1.
2.1 Capturing Two Groups of Images
Two groups of images are collected: Image set A and Image set B. Two groups of images should be captured under almost same condition, but it should not be same, because the errors in the point clouds created from these image groups should not have same tendency in systematic error caused by aerial triangulation and dense image matching.
2.2 Creating point clouds
Two point clouds of each image groups are generated by SfM software. The two of these point clouds should be almost the same coordinate system. This can be attained by creating GCPs in the point clouds of one group of images and execute bundle adjustment in the other group of images. To avoid the deformation caused by systematic error of bundle adjustment, the errors of GCP coordinates should be large in bundle adjustment.
The International Archives of the Photogrammetry, Remote Sensing and Spatial Information Sciences, Volume XL-4/W5, 2015 Indoor-Outdoor Seamless Modelling, Mapping and Navigation, 21–22 May 2015, Tokyo, Japan
This contribution has been peer-reviewed.
Figure 1. Procedure of the Qualification 2.3 Point Cloud Registration
Registration of two point clouds is executed with ICP algorithm. ICP iteratively try to minimize the distance of two point clouds. One point cloud, the source, is moved to fit the other point cloud, the target, by rigid transformation which is the combination of translation and rotation.
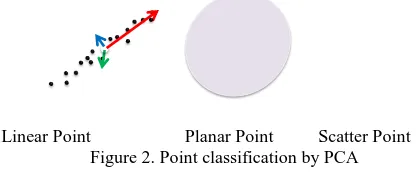
We adopt CCICP (Classification and Combined ICP) algorithm. The CCICP algorithm minimizes point-to-plane, point-to-point distances, simultaneously, and also reject incorrect correspondences based on point classification by PCA (Principle Component Analysis) (Takai et al 2013). The points in the local point clouds are classified into linear points, planar points and scatter points depending on the results of the PCA which is shown Figure 2 (Demanke et al 2011).
Linear Point Planar Point Scatter Point Figure 2. Point classification by PCA
Point-to-plane and point-to-point distances are minimized simultaneously in CCICP. Point-to-plane distance minimization is applied to planar-planar correspondences and point-to-point distance minimization is applied to the other correspondences. Point-to-plane and point-to-point distance minimization problem is solved using the method of Low (Low, 2004). Point-to-point distance (Dpt_pt) and point-to-plane distance (Dpt_pl) is defined in following equation:
where is a transformation matrix in homogeneous coordinate system is a point in source point cloud, is the matching point in target point cloud, and is the normal vector of point
calculated by PCA.T is described as following
CCICP minimizes sum of square difference of corresponding coordinates of points. Detail of CCICP algorithm is described in the paper of Takai et al (2013).
2.4 Quality Evaluation
CCICP outputs the mean value of square distances E. Root of E value includes systematic error of both point cloud. Therefore, root mean square error of each point cloud is smaller than root of E.
3. TESTS AND RESULT
3.1 Test Object
The test object is a lava stone of Izu Oshima Island. The size of the lava stone is about 10 cm width and 5 cm height. Surface of the lava stone is partly rough with small holes, and partly smooth. The colour of the lava stone is almost black. Also, the stone object is set on a map-printed cloth (Figure 3).
Figure 3. The test object: lava stone of Izu Oshima Island 3.2 Image capturing
The cloth and the stone had been set on a rotary chair (Figure 4) and images had been captured with SONY Cyber-shot DSC-WX200 (Figure 5). Two set of images, (image set A and image set B) had been captured. For each set of images, more than hundred of images had been captured all around the test object, with two different angles of depression (Table 1).
Figure 4. Image capturing stage
Figure 5. SONY Cyber-shot DSC-WX200
Table 1. Two set of images
Image Set A Image Set B
Number of Images 111 125
Camera SONY Cyber-shot
DSC-WX200
SONY Cyber-shot DSC-WX200 Image Resolution About 0.03mm About 0.03mm
3.3 Generation of Point Clouds
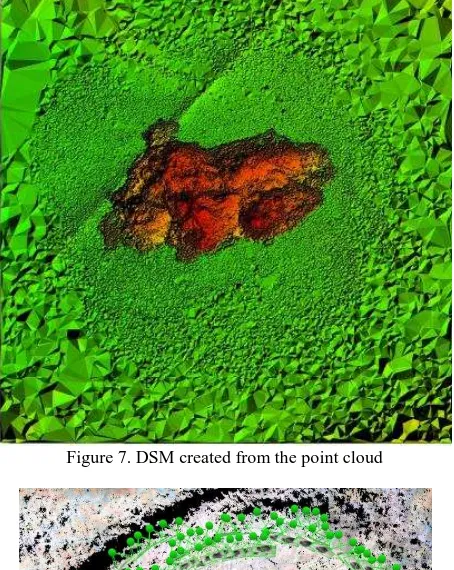
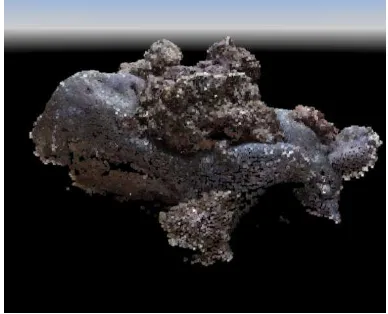
Two set of images had been processed with SfM software, named Pix4Dmapper of Pix4D, for the generation of point cloud. Image set A had been processed without GCP, therefore the image coordinates of point cloud of image set A is arbitrary and the unit of the coordinate system is approximately 1 mm (Figure 6). 111 images had been processed and all of the images had been adopted for point cloud generation. The point cloud is dense around at stone and sparse at surrounding ( Figure 7.). In this paper, we refer to 1 unit length as 1mm.
Image set B had been processed with 125 images (Figure 8). Six GCPs measured in image set A (Figure 9) had been used in bundle adjustment procedure in Pix4D. To avoid the systematic deformation with bundle adjustment, the accuracy of GCPs had been set to 20 mm.
Figure 6. Point cloud A generated from image set A and estimated camera position and rotation
Figure 7. DSM created from the point cloud
Figure 8. Point cloud B generated from image set B and estimated camera position and rotation The International Archives of the Photogrammetry, Remote Sensing and Spatial Information Sciences, Volume XL-4/W5, 2015
Indoor-Outdoor Seamless Modelling, Mapping and Navigation, 21–22 May 2015, Tokyo, Japan
This contribution has been peer-reviewed.
(1) Alignment of 6 GCPs
(2) A GCP on the stone
(3) A GCP on the cloth Figure 9. GCPs in point cloud
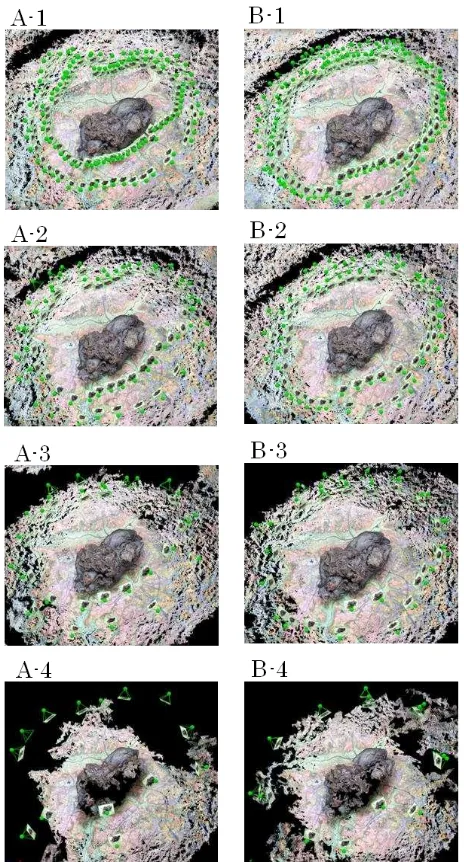
Point clouds with reduced images had been generated with image set A and B respectively. We refer to point clouds generated from 1/1, 1/2, 1/4, 1/8 of image set A as 1, 2, A-3 and A-4 respectively, and similarly, B-1, B-2, B-A-3 and B-4 respectively. The number of points tends to decrease in both point cloud data set of both image set (Figure 10, Table 2).
Figure 10. Point Clouds with reduced images Table 2. Data set name list of point clouds
Point clouds with image set A Point clouds with image set B Data set name Number of
image
Data set name Number of images
A-1 111 B-1 125
A-2 56 B-2 63
A-3 28 B-3 32
A-4 14 B-4 16
3.4 Image Registration
Image registration by CCICP had been executed for four pairs of point clouds: A-1 and B-1, A-2 and B-2, A-3 and B-3, A-4 and B-4. Source point cloud generated from image set A had been fitted to target point cloud generated from image set B. Search distance of matching point was set to 1mm and search distance for PCA was set to 0.8mm. Number of sampling points for CCICP matching had been decreased to 1/10 of full data points of point clouds. Matching points were limited to the object stone and points of the cloth had been eliminated. The International Archives of the Photogrammetry, Remote Sensing and Spatial Information Sciences, Volume XL-4/W5, 2015
Table 3 shows the number of matching pairs for CCICP. Matching points were more than 90% of sample points of CCICP. It is considered that eliminated pairs in CCICP include points with big errors, pairs with different classification, or sparse point cloud, but their numbers were relatively small. Table 3 also shows that more than 90% of CCICP pairs were planar points. Figure 11 shows result of PCA classification of A-1.
Table 3. Numbers of matching pairs for CCICP
Source Target number
A-1 B-1 1326160 132616 126858 128109 3263
96% 97% 2%
A-2 B-2 876770 87677 86888 85241 1647
99% 97% 2%
A-3 B-3 534260 53426 53044 52522 522
99% 98% 1%
A-4 B-4 171620 17162 16026 15739 287
93% 92% 2%
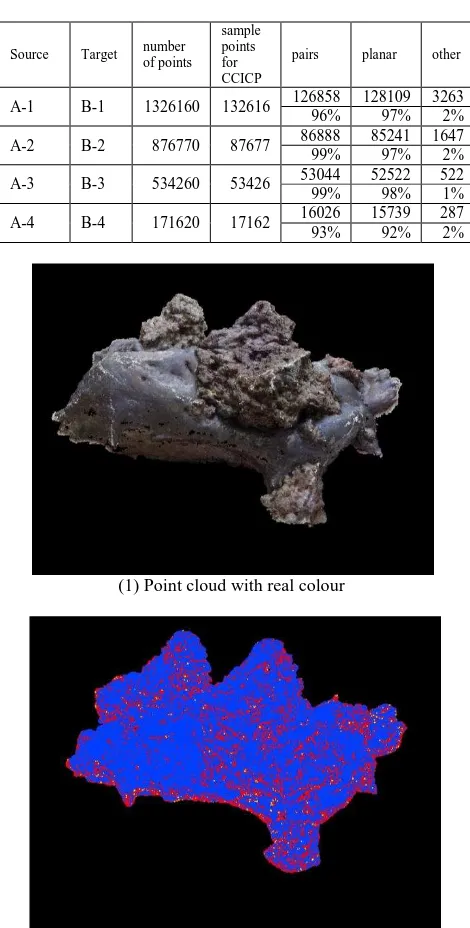
(1) Point cloud with real colour
Blue: planar points Yellow: scatter points Red: Linear points
(2) Classification result Figure 11. PCA classification of A-1
Figure 12 shows a sample profile of point clouds before and after CCICP registration, and Table 4 shows mean distances of point clouds before and after CCICP registration. In all cases, mean distances are about pixel size (0.03mm) or less. This shows that these setting of images and number of images do not affect precision of measurement so much, while it greatly affects number of measured points.
Table 4. Mean distance before/after CCICP registration Source Target Number
(1) point cloud profile before CCICP
(2) Point cloud profile after CCICP White: Source points, Red: Target points Figure 12. Result of CCICP point cloud registration
Figure 13 shows 3D error (distance of two point clouds) for registration between of A-1 and A-2. This shows that big errors (more than 0.09mm) cluster to some parts, while error distribution of other part have no eminent tendency. This means this qualification method can access local matching quality in a point cloud.
The International Archives of the Photogrammetry, Remote Sensing and Spatial Information Sciences, Volume XL-4/W5, 2015 Indoor-Outdoor Seamless Modelling, Mapping and Navigation, 21–22 May 2015, Tokyo, Japan
This contribution has been peer-reviewed.
(1) Point cloud with real colour
(2) Point cloud coloured by error Blue: < 0.03mm Green: < 0.06mm Yellow: < 0.09mm Red: >0.09mm
Figure 13. 3D error distribution for registration between A-1 and A-2
4. CONCLUSION AND FUTURE WORKS
Qualification method of point cloud generated by SfM has been proposed. With CCICP registration, point cloud quality can be estimated, as well as local matching quality in a point cloud. The error level of the point cloud is estimated by mean distance of two point clouds.
This method requires redundant image capturing, but it is easy for small objects with large overlapping configuration.
Numerical relationship between mean distance of CCICP and errors in point cloud generation has not been theoretically discussed in this paper. We are planning to clarify the relationship by analyzing the result of CCICP with simulated errors of point clouds.
5. ACKNOWLEDGEMENT
We wish to thank Prof. Satoshi Kanai and Assoc. Prof. Hiroaki Date, Hokkaido University, for help for CCICP programming and inspiring suggestion.
REFERENCES
Besl, Paul J.; N.D. McKay (1992). A Method for Registration of 3-D Shapes. IEEE Trans. on Pattern Analysis and Machine Intelligence (Los Alamitos, CA, USA: IEEE Computer Society) 14 (2): 239–256. doi:10.1109/34.121791.
S. Takai, H. Date, S. Kanai, Y. Niina, K. Oda, and T. Ikeda(2013). Accurate registration of MMS point clouds of urban areas using trajectory, ISPRS Workshop Laser Scanning 2013, 277-282, Nov. 13th, 2013, Antalya, Turkey.
Demantke, J., Mallet, C., David. N., Vallet, B.(2011). Dimensionality based scale selection in 3D LiDAR Point Cloud. The International Archives of the Photogrammetry Remote Sensing and Spatial Information Sciences, 38 (Part 5/W12) (on CDROM).