A LONG-TERM PERSPECTIVE ON DEFORESTATION RATES IN THE BRAZILIAN
AMAZON
M.D. Velasco Gomez a, R. Beuchlea,*, Y. Shimabukuroa, b, R. Grecchi a, D. Simonetti a, H.D. Eva a, F. Achard a
a European Commission, Joint Research Centre (JRC), Institute for Environment and Sustainability (IES), Forest Resource and
Climate Unit, Via E. Fermi 2749, 21027 Ispra (VA), Italy– (diana.velasco-gomez, rene.beuchle, yosio.shimabukuro, rosana.grecchi, dario.simonetti, hugh.eva, frederic.achard)@jrc.ec.europa.eu
b Brazilian National Institute for Space Research (INPE), Av. dos Astronautas 1758, Jd. Granja - CEP: 12227-010, São José dos
Campos - SP, Brazil - yosio@dsr.inpe.br
KEY WORDS: land cover change, arc of deforestation, Brazilian Amazon, Landsat, systematic sample, multi-temporal analysis
ABSTRACT:
Monitoring tropical forest cover is central to biodiversity preservation, terrestrial carbon stocks, essential ecosystem and climate functions, and ultimately, sustainable economic development. The Amazon forest is the Earth’s largest rainforest, and despite intensive studies on current deforestation rates, relatively little is known as to how these compare to historic (pre 1985) deforestation rates. We quantified land cover change between 1975 and 2014 in the so-called Arc of Deforestation of the Brazilian Amazon, covering the southern stretch of the Amazon forest and part of the Cerrado biome. We applied a consistent method that made use of data from Landsat sensors: Multispectral Scanner (MSS), Thematic Mapper (TM), Enhanced Thematic Mapper Plus (ETM+) and Operational Land Imager (OLI). We acquired suitable images from the US Geological Survey (USGS) for five epochs: 1975, 1990, 2000, 2010, and 2014. We then performed land cover analysis for each epoch using a systematic sample of 156 sites, each one covering 10 km × 10 km, located at the confluence point of integer degree latitudes and longitudes. An object-based classification of the images was performed with five land cover classes: tree cover, tree cover mosaic, other wooded land, other land cover, and water. The automatic classification results were corrected by visual interpretation, and, when available, by comparison with higher resolution imagery. Our results show a decrease of forest cover of 24.2% in the last 40 years in the Brazilian Arc of Deforestation, with an average yearly net forest cover change rate of -0.71% for the 39 years considered.
* Corresponding author
1. INTRODUCTION
The Joint Research Centre of the European Commission has been involved in monitoring tropical forest cover with remote sensing since 20 years, with the goal of reducing the uncertainties in measuring forest change and the related carbon emissions (Achard et al., 2014). Remote sensing technology has been the major provider of cost-effective, high-quality datasets for land surface monitoring in the past decades (Lunetta et al., 2002), on this background the TREES-3 project was carried out from 2007 to 2014 assessing forest cover changes in the pan-tropics between 1990 and 2010 on basis of a regular sampling grid with medium resolution satellite imagery (Stibig et al., 2014, Mayaux et al., 2013, Beuchle et al., 2015) – providing major input the Forest Resource Assessment 2010 – Remote Sensing Survey (FRA2010RSS, FAO & JRC 2012) carried out by the Food and Agriculture Organisation (FAO) of the United Nations. The Brazilian Amazon, the largest tropical forest on earth, has been undergoing rapid deforestation during the last four decades (Mertens et al., 2002), nowhere in the world has so much forest disappeared so rapidly as in this area (Andersen et al., 2002). On this background we extended the time of observation of TREES-3 from 1975 to 2014. For the Brazilian ‘Arc of Deforestation’ (AOD) along the South and East of the Flanks of the Brazilian Legal Amazon (Pacheco et al., 2006), in order to get a full picture on historical and recent forest cover change in this area.
2. MATERIAL AND METHOD 2.1 Study area
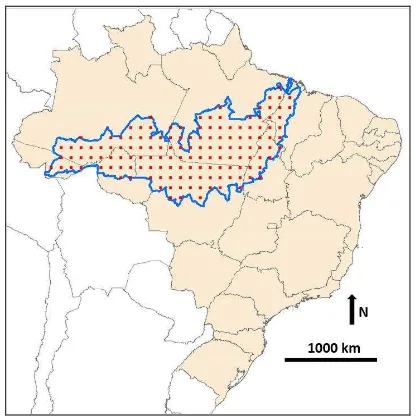
The gradual transformation of the Amazon forest, launched by the advancement of the ‘economic front’, created a vast area with a rapidly declining forest cover in the form of a large arc, ranging from the westernmost Brazilian Acre State, across Southern Amazonas, Southern Pará and the North of Rondônia, and Mato Grosso States to the border of Pará State with the States of Tocantins and Maranhão (Figure 1). This so-called ‘Arc of Deforestation’ is roughly 2,800 km long and 1,000 km wide (at its widest point), covering an area of approximately 1,700,000 km2. It was defined by the Brazilian Institute of Environment and Renewable Natural Resources (IBAMA) in the early 1990ies by mapping 256 municipalities with the most intensive deforestation activities. At the time, approximately 75% of the deforestation in the Brazilian Amazon was concentrated in the AOD (Gonçalves, 2014). It reflects the imprint in the forest of Brazilian agricultural frontier expansion, mainly by large-scale pasture for cattle ranching and soybean production (Mertens et al., 2002), and the accompanying increase of population close to or within the AOD.
2.2 Layout of sample grid
efforts while providing accurate estimates of forest cover and forest cover changes (Achard et al., 2002; Eva et al., 2012, Hansen et al., 2008; Potapov et al., 2011). In conjunction with FAO’s FRA2010RSS study, a sampling grid was designed with a sample of 10km X 10km at the confluence of full degree latitudes and longitudes over the area of the Arc of Deforestation, resulting in 141 samples regularly distributed over the area (Fig. 1).
2.3 Landsat imagery
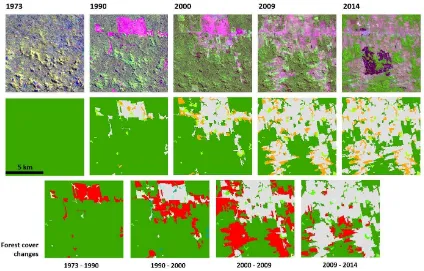
For the mapping of the forest cover for the years 1975, 1990, 2000, 2010 and 2014 imagery from Landsat MSS, TM, ETM+, and OLI were downloaded from the Global Land Survey (GLS) archives, provided by the United States Geological Survey (USGS). The images selected were as close as possible to the target date (30 June for all target years) and with the least cloud cover possible (Beuchle et al., 2011). Good quality imagery was available for almost all the sample units for all target years (example: Fig.2), the number of images processed adding up to more than 700. The only exceptions to using Landsat imagery consisted in three sample units in the easternmost part of the Arc of Deforestation, where the forest cover for the year 1975 was estimated on basis of Corona imagery from 1965 in combination of rather cloudy MSS images from 1975.
Figure 1. Regular sample grid (red squares) within the Arc of Deforestation (blue line), Brazilian territory in light orange
2.4 Image segmentation & classification
The selected images underwent an extensive pre-processing, including image geo-location check, conversion to top-of atmosphere reflectance, cloud-masking, de-hazing and image normalization on basis of pseudo-invariant features (Bodart et al., 2011). For each sample unit, the pre-processed images from the five ‘epochs’ (years 1975, 1990, 2000, 2010 and 2014) went through a multi-step segmentation using eCognition software (Trimble©), followed by an object-based classification process based on membership functions defined by a collection of spectral signatures taken across the tropical belt (Raši et al., 2011, 2013). Objects were classified into five land cover classes (Table 1); the Tree Cover class was defined in compatibility with the definition of forest by FAO (FAO, 1998).
Tree Cover (TC) ≥70% of tree cover per object / canopy closure ≥ 30%
Table 1. Sequential criteria for TREES-3 object-based land cover classification (Rasi et al., 2011)
Examples of the Landsat imagery and land cover classification results are shown in Fig. 2. The resulting classified objects, with a minimum mapping unit (MMU) of 5 ha, underwent an validation, where falsely labelled objects were assigned the correct class interactively (Eva et al., 2012). One step of the validation exercise consisted in the improvement of the land cover classification of the year 1990 and year 2000 by Brazilian national experts from EMBRAPA (Campinas, Brazil). The classification accuracy obtained was measured by an independent classification of 34 randomly selected sample units distributed over the whole Brazilian Amazon, selecting the figures of forest cover 1990 and deforestation 1990-2000 as criteria. The two estimates carried out by TREES-3 and national experts from the Brazilian National Space Research Institute (INPE) showed a good correspondence both for the forest area of year 1990 and deforestation of period 1990–2000 with slopes close to 1 (1.017 and 1.008 respectively) and R2 close to 1 (0.986 and 0.978 respectively).
2.5 Statistical analysis
Figure 2. Forest cover change analysis for the AOD (example: sample unit South 10°, West 58° in Northern Mato Grosso State); upper line: Landsat MSS, TM, ETM and OLI imagery for the different target dates:, middle line: land cover maps for the respective dates (green: tree cover, light green: tree cover mosaic, orange: other wooded land, grey: other land, blue: water); bottom line: forest cover change maps for the target periods: green: unchanged tree cover, light green: tree cover -> tree cover mosaic, red: deforested
areas, dark blue-green: tree cover re-growth
3. RESULTS
Our results show that the forest cover in the Arc of Deforestation has decreased (net loss) from 1,526,374 km2 (or 89.7% coverage) to 1,157,216 km2 (or 68.0% coverage) from 1975 - 2014, the net loss of forest for the whole period adds up to 369,158 km2 or 24.2% of the forest cover in 1975 (Table 2).
1975 1990 2000 2010 2014 1,526.4 1,380.8 1,272.2 1,164.2 1,157.2
89.7% 81.2% 74.8% 68.4% 68.0%
9.5% 16.7% 23.7% 24.2%
Table 2: Forest cover change statistics in the AOD 1975–2014; first row: year of analysis; second row: forest area (1000 km2); third row: respective forest cover percentages of the whole area of interest; fourth row: net loss of forest with respect to the
baseline year 1975
For the period between 1975 and 2014, we calculated the yearly percentage of net forest loss as follows (Puyravaud, 2003):
(1)
where t1, t2 = time 1 and time 2
A1, A2 = forest cover at time 1 and time 2
In the period from 1975–1990, the percentage of yearly net change of forest was at -0.67%, rising to -0.82% and -0.89% for
1990–2000 and 2000–2010 respectively, before it decreased to a low -0.15% in the period between 2010–2014.
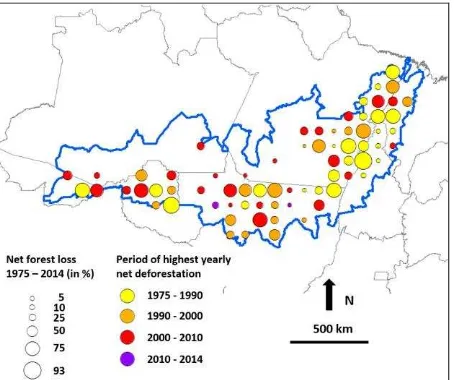
The spatial and temporal patterns of the deforestation activities are not equally distributed within the area of the Arc of Deforestation. (Fearnside et al., 2005). The main area of forest conversion within the AOD can be found at the Southern and Eastern part of the area (Figure 3). The overall net forest loss and the period with the highest deforestation rate for the different sample units can be seen in Figure 4.
Figure 3. Forest cover (in %) in 1975 for the sample units (green); net loss of forest (in %) until year 2014 per sample site
The spatial and temporal distribution of the highest yearly net deforestation shows only very rough patterns. The deforestation activities on the Eastern border of the Arc of Deforestation (in the East of Pará State) have been initiated at a very early stage (period between 1975 and 1990), whereas the main forest losses in Mato Grosso State (Central South of the AOD) happened mainly in the period between year 1990 and 2000. In the latest period, between 2010 and 2014, the deforestation rates in all but two sample units are consistently lower than in earlier periods, due to the overall decrease of forest conversion in the Brazilian Amazon after 2005 (INPE, 2008).
Figure 4. Net forest loss between 1975 and 2014 (circle size) and period of highest yearly net deforestation (colour); outline
of the Arc of Deforestation in blue
In general access by roads to the forest triggers forest conversion (Ahmed et al., 2013) to pastures, fields of crop agriculture or settlements. The increasing density of roads, increasing population and economic (mainly agricultural) activities were the main reasons for the deforestation activities on the Southern and Eastern borders of the Brazilian Amazon.
The population in the Legal Amazon increased from 3.5 million in 1950 to 20.0 million in 2000 and to 24.3 million in 2008 (Perz et al., 2005, Amazon Fund, 2010). This increase in population was accompanied by a densification of the road network, e.g. between year 2004 and 2007, the road network in the Brazilian Amazon grew by almost 17,000 km, mainly in the area of the AOD (Ahmed et al., 2013). These dynamics went along with a parallel increase of agricultural production by enlarging the areas crops and pastures through forest conversion. After 2005, while the deforestation rates in the Brazilian Amazon decreased, the persistent increase of crop yields was mainly due to an intensification of agriculture (Macedo et al., 2011).
4. DISCUSSION AND CONCLUSIONS
In order to make an assessment of our results, we compared our deforestation estimates with those from PRODES (INPE, 2008), as official estimates of the Brazilian government, and with the Global Forest Watch (GFW) data (Hansen at al., 2013). PRODES uses Landsat imagery to map yearly gross deforestation areas within the Brazilian Legal Amazon with a minimum mapping unit of 6.25 ha, whereas GFW data resulted
from time-series analysis of Landsat imagery and mapped pixel-based percentages of tree cover for year 2000 and yearly forest loss from year 2001–2013 (Table 3).
In order to be able to compare our data with GFW (and because there is not a clear definition of what GFW considers forest), we applied the same criteria as used in our study, considering forest above a threshold of 30% of tree cover.
INPE only considers only the area of evergreen forest within the Legal Amazon for the PRODES analysis, thus excluding some areas of deciduous forest and savannah. We took the minimum common area (evergreen forest within the AOD) of all three datasets, comprising 1495406 km2, to produce the comparative statistics.
Table 3. Comparison of areas of gross deforestation for the humid forest part (as defined by PRODES) of the Brazilian Arc
of Deforestation from TREES-3, PRODES and GFW
For the calculation of the deforested areas year 2000 we used the figures provided by INPE (2014) and GFW (2014). Regarding the GFW data we assumed that any pixel with a tree cover percentage lower than 30% as non-forest and thus deforested at some stage earlier than year 2000. From the TREES-3 data we excluded 20 sample units (covering an area considered as non-evergreen forest by INPE). We aggregated the figures of gross deforestation from the periods 1975–1990 and 1990-2000 to calculate the overall area of gross deforestation at year 2000.
The three approaches provide quite diverging results, especially regarding the numbers for the deforested area in year 2000 and the comparison of the gross deforested area between 2010 and 2014. This shows that even if the evergreen forest is considered as an ‘easy target’ for forest cover change analysis, compared to e.g. seasonal forest or savannah (Barreda-Bautista et al., 2011), and even if the same type of imagery is used (Landsat) in the comparative studies, the differences in the applied methods (different minimum mapping units, sampling vs. wall-to-wall, object-based vs. pixel-based, time series analysis vs. single image analysis etc.) potentially leads to diverging figures on areas of forest conversion.
ACKNOWLEDGEMENTS
REFERENCES
Achard, F., Beuchle, R., Mayaux, P., Stibig, H.-J., Bodart, C., Brink, A., Carboni, S., Desclée, B., Donnay, F., Eva, H.D., Lupi, A., Raši, R., Seliger, R., Simonetti, D., 2014. Determination of tropical deforestation rates and related carbon losses from 1990 to 2010. Global Change Biology, 20, pp. 2540–2554.
Achard, F., Eva, H.D., Stibig, H.-J., Mayaux, P., Gallego, J., Richards, T., Malingreau, J.-P., 2002. Determination of deforestation rates of the world's humid tropical forests.
Science, 297, pp. 999–1002.
Ahmed, S.E., Souza Jr., C.M., Ribeiro, J., Ewers, R., 2013. Temporal patterns of road network development in the Brazilian Amazon. Regional Environmental Change, 13, pp. 927–937.
Amazon Fund, 2010. Annual Report 2010. Available at: http://www.amazonfund.gov.br/FundoAmazonia/export/sites/de fault/site_en/Galerias/Arquivos/Relatorio_Atividades/RAFA_20
10_en.pdf. Brazilian Development Bank, Rio de Janeiro, Brazil.
(25.03.2015).
Andersen, L.E., Granger, C.W., Reis, E.J., Weinhold, D., Wunder, S., 2002. The Dynamics of deforestation and economic growth in the Brazilian Amazon. Cambridge University Press,
Cambridge, UK.
Barreda-Bautista, B.D.l., López-Caloca, A.A., Couturier, S., Silván-Cárdenas, J. L., 2011. Tropical dry forests in the global picture: the challenge of remote sensing-based change detection in tropical dry environments. In: E. G. Carayannis (Ed.), Planet Earth 2011 - Global warming challenges and opportunities for policy and practice, pp. 231–256.
Beuchle, R., Eva, H.D., Stibig, H.-J., Bodart, C., Brink, A., Mayaux, P., Johansson, D., Achard, F., Belward, A., 2011. A satellite data set for tropical forest area change assessment,
International Journal of Remote Sensing, 32, pp. 7009–7031.
Beuchle, R., Grecchi, R.C., Shimabukuro, Y.E., Seliger, R., Eva, H.D., Sano, E., Achard, F., 2015. Land cover changes in the Brazilian Cerrado and Caatinga biomes from 1990 to 2010 based on a systematic remote sensing sampling approach.
ISPRS Journal of Photogrammetry and Remote Sensing, 66, pp. 555–563.
Bodart, C., Brink, A.B., Donnay, F., Lupi, A., Mayaux, P., Achard, F., 2013. Continental estimates of forest cover and forest cover changes in the dry ecosystems of Africa between 1990 and 2000, Journal of Biogeography, 40, pp. 1036–1047.
Eva, H.D., Achard, F., Beuchle, R., De Miranda, E., Carboni, S.,Seliger, R., Vollmar, M., Holler, W., Oshiro, O., Barrena, V., Gallego, J., 2012. Forest cover changes in tropical South and Central America from 1990 to 2005 and related carbon emissions and removals, Remote Sensing, 4, pp. 1369–1391.
FAO, 1998. FRA 2000 terms and definitions. FRA working paper 1. FAO Forestry Department. Available at:
http://www.fao.org/docrep/006/ad665e/ad665e00.htm#TopOfPa ge (20.08.2014).
FAO, JRC, 2012. Global forest land-use change 1990–2005.
FAO Forestry Paper 169, Rome, Italy.
Fearnside, P.M., 2005. Deforestation in Brazilian Amazonia: History, Rates, and Consequences. Conservation Biology, 19, pp. 680–688.
GFW, 2014. Available at: http://www.globalforestwatch.org/ (25.03.2015). quantified by using multi-temporal and multi-resolution remotely sensed data. Proceedings of the National Academy of Sciences of the United States of America 105, pp. 9439–9444.
Hansen, M.C., Potapov, P.V., Moore, R., Hancher, M., Turubanova, S.A., Tyukavina, A., Thau, D., Stehman, S.V., Goetz, S.J, Loveland, T.R., Kommareddy, A., Egorov, A., Chini, L., Justice, C.O., Townshend, J.R.G., 2013. High-resolution global maps of 21st-century forest cover change.
Science, 342, pp. 850–853.
INPE, 2008. Monitoramento da cobertura florestal da Amazonia por Satelites: Sistemas PRODES, DETER, DEGRAD e identification of land-cover change in a biologically complex community in North Carolina, USA. Remote Sensing of Environment, 82, pp. 258–270.
Mayaux, P., Holmgren, P., Achard, F., Eva, H.D., Stibig, H.-J., Branthomme, A., 2005. Tropical forest cover change in the 1990s and options for future monitoring. Philosophical Transactions of the Royal Society of London. Series B, Biological Sciences, 360, pp. 373–384.
Mayaux, P., Pekel, J.-F., Desclée, B., Donnay, F., Lupi, A., Achard, F., Clerici, M., Bodart, C., Brink, A., Nasi, R., Belward, A., 2013. State and evolution of the African rainforests between 1990 and 2010. Philosophical Transactions of the Royal Society of London. Series B, Biological Sciences, 368, pp. 20120300.
Pacheco, P., 2006. Arc of Deforestation. In: Geist, H.J. (Ed.) Our Earth’s Changing Land: An Encyclopaedia of Land-Use and Land-cover. Vol.1 (A-K) (pp. 51-54), Greenwood Press, Westport, London.
Perz, S.G., Aramburú, C., Bremner, J., 2005. Population, land use and deforestation in the Pan Amazon basin: a comparison of Brazil, Bolivia, Colombia, Ecuador, Perú and Venezuela.
Environment, Development and Sustainability, 7, pp. 23-49.
Potapov, P., Hansen, M.C., Gerrand, A.M., Lindquist, E.J., Pittman, K., Turubanova, S., Løyche-Wilkie, M., 2011. The global Landsat imagery database for the FAO FRA remote sensing survey. International Journal of Digital Earth, 4, pp. 2-21.
Puyravaud, J.-P., 2003. Standardizing the calculation of the annual rate of deforestation. Forest Ecology and Management, 177, pp. 593–596.
Raši, R., Bodart, C., Stibig, H.-J., Eva, H.D., Beuchle, R., Carboni, S., Simonetti, D., Achard, F., 2011. An automated approach for segmenting and classifying a large sample of multi-date Landsat imagery for pan-tropical forest monitoring,
Remote Sensing of Environment, 115, pp. 3659–3669.
Raši, R., Beuchle, R., Bodart, C., Vollmar, M., Seliger, R., Achard, F., 2013. Automatic updating of an object-based tropical forest cover classification and change assessment, IEEE Journal of Selected Topics in Applied Earth Observations and Remote Sensing, 6, pp. 66–73.
Ridder, R.M., 2007. Global forest resources assessment 2010: Options and recommendations for a global remote sensing survey of forests. FAO Working Paper 141 (p. 68). Rome, Italy.
Särndal, C. E., Swensson, B., Wretman, J. 1992. Model assisted survey sampling. New York: Springer-Verlag.